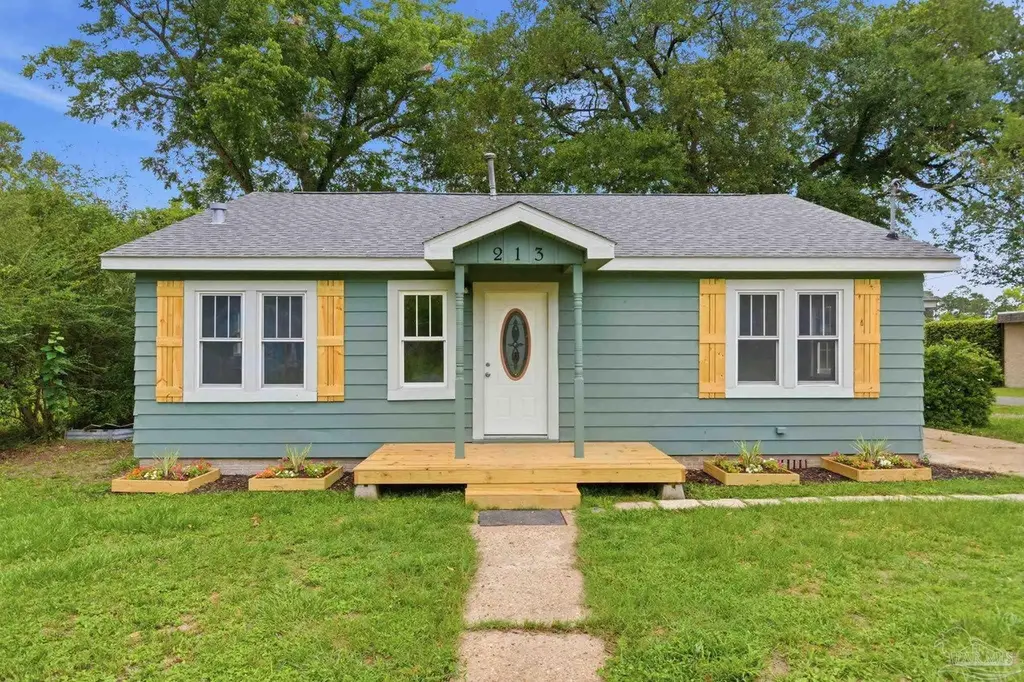
213 Rocky Ave · Gonzalez, FL
Flood risk 1/10 · Minimal
- FEMA flood zone
- X (unshaded)
- Chance of flooding over 30 yrs
- 0.0%
- Est. flood insurance / yr
- $507 – $1,088
Fire risk 4/10 · Minor
- Est. fire insurance / yr
- $947 – $1,759
Heat risk 9/10 · Severe
- Hot days now (above 105°F)
- 7 days/yr
- Hot days in 30 yrs
- 21 days/yr
Wind risk 9/10 · Severe
- Chance of severe wind over 30 yrs
- 99.0%
Air-quality risk 1/10 · Minimal
- Unhealthy air days now
- 0 days/yr
- Unhealthy air days in 30 yrs
- 0 days/yr
Risk factors via First Street. Map © Google.
Why this score? — see what drove the D grade
The composite is a weighted blend of 9 inputs, each scored 0–100. Each bar is that input's sub-score; the figure is the points it added to the 100-point composite (weight × sub-score).
- Cash flow +15.0/30.0
- ARV discount +8.3/15.0
- DSCR +4.6/10.0
- Schools +3.6/10.0
- Livability +3.6/5.0
- 1% rule +2.8/10.0
- Rent growth +2.5/5.0
- Condition / age +2.5/5.0
- Appreciation +0.0/10.0
$248,500
🖨 Deal sheet 📄 Offer letter ✓ Due diligence
Listing remarks MLS
Bring your vision and tools — opportunity is knocking at 213 Rocky Ave! This property sits on a spacious corner lot in one of Cantonment’s most convenient and desirable areas, surrounded by good schools and a friendly community. The home is in need of TLC and renovation, making it a perfect project for an investor, handyman, or buyer looking to create their dream home. With solid bones and endless potential, you can reimagine the space exactly how you want it — modernize, expand, or design a fresh new layout to match your vision. Enjoy the peaceful setting, proximity to local shopping and dining, and the quick drive to Pensacola, Navy Federal, and I-10 access. Homes in this area move fast once updated — don’t miss your chance to build instant equity and turn this diamond in the rough into something truly special! Sold As-Is. Cash or renovation financing preferred.
Key facts
- Extended front porch
- Covered back deck
- New roof
Tags
Property features AI
Finance
- Other: Located on a publicly maintained, county road; Property condition listed as resale; Green energy features include lighting
- HOA & community: No association
Exterior
- Parking: Driveway with open parking
- Utilities: Public water; Public sewer; Copper electrical wiring
- Home design: One-story, single-family (detached) home; Resale property; Frame construction
- Construction: Shingle roof; Off-grade foundation; Frame construction; Building area approximately 1,653 square feet
- Exterior features: Chain link fencing; Porch; Covered deck; Central access lot
Interior
- Kitchen: Remodeled kitchen; Dishwasher; Refrigerator; Electric water heater; ENERGY STAR qualified dishwasher, refrigerator, appliances, and water heater
- Bathrooms: 2 full bathrooms
- Heating & cooling: Central heating; Central air; Ceiling fans
- Interior features: Living/dining room combo; Living room remodeled; Kitchen completely remodeled in 2026; Bathroom completely remodeled in 2026
- Laundry & utility: Washer/dryer hookups
Neighborhood map
What this means for you Summary
Snapshot
- This is a 3-bed/1.0-bath single-family listed at $248k.
Deal economics
- At list price, monthly cash flow is $79 ($954/yr) — positive.
- The deal already cash-flows at list — no discount required.
- To meet the 1% rule (rent ≥ 1% of price), the offer needs to be $195k (21.7% below list).
- Recommended offer: $195k (21.7% below list) — sets the bar for 1% rule.
- Cap rate 6.7% vs local median 4.2% in Gonzalez — top-decile yield for the area; either an underpriced asset or a hidden risk that comps aren't pricing in. Stress-test before assuming the spread holds.
Location & tenants
- Location reads 71/100 on livability (#385 in FL) — a middle-class / working-renter tenant base. Strengths: cost of living A+, housing A+, employment A; Watch: amenities F, commute F, health & safety F.
- Escambia (suburban): math 40% / reading 45% proficiency, ranked #56 of 73 in FL (top 77%) — families likely to look elsewhere, expect single-tenant / working-renter base with shorter leases.
- Market conditions: 513 active listings in the ZIP; solid renter incomes; 1,479 units permitted in Escambia County in 2024 (0 in 5+ unit buildings).
Forward outlook
- Local home prices are declining (-3.0%/yr); year-one equity from $2k of loan paydown is wiped out by about $7k of value loss. Plan a longer hold.
- Escambia County population projected at +13% by 2050 — modest demand growth; plan on rents tracking national, not racing it.
Negotiation context
- It's been on market 17 days — a 2% lower offer ($245k) is reasonable based on typical stale-listing flexibility.
- 2 sale attempts with the ask held roughly flat each time — persistent listings suggest the price (not the market) is what's stuck; bring a comps-based counter.
- Current owner paid $65k; list at $248k implies a 282% gain — meaningful room to come down on a strong offer.
Risks & watch-outs
- Watch-outs: built in 1947 — expect roof / HVAC / electrical / plumbing capex.
- Climate carrying-cost: severe wind risk, 99% chance of damaging wind over 30y; extreme-heat days projected 7→21/yr by 2055 (HVAC capex compounding) — expect insurance premiums to compound above CPI over the hold.
Questions for the listing agent
- Built in 1947 — when were the roof, HVAC, electrical panel, plumbing, and water heater last replaced?
- Is there a deadline driving the sale (1031 exchange, divorce, estate, relocation)? That informs how much negotiation room exists.
- The area grade is low — what's the realistic commute time and amenity access for the typical tenant pool here? Any planned neighborhood developments (good or bad) we should know about?
- What's the average days-on-market for RENTAL listings here right now (not sales)? A rising rental-DOM trend means longer vacancies and softer asking-rent achievability than the comps imply.
- What's the recent tenant-quality profile in this submarket — average credit score on applications, eviction rate, late-payment / NSF rate, and stable-employment percentage? A property-management company in the area should have these aggregated.
- How much new for-sale + rental construction is in the pipeline within 1–3 miles? Heavy new supply typically softens prices + rents 12–24 months out; constrained supply supports both.
Investment metrics
- 1% rule
- 0.78% ✗
- Cap rate
- 6.68%
- Cash-on-cash
- 1.37%
- DSCR
- 1.06
- GRM
- 10.6
CMA / ARV
- ARV (on-the-fly)
- $253,075
- Comps found
- 12
Show comp detail 12 sales within ~0.75 mi
| Address | Dist | Beds/Ba | Sqft | Sold | Price | $/sf | Match |
|---|---|---|---|---|---|---|---|
| 309 Homeland Ave | 0.12mi | 3/2.0 | 1,350 (+2%) | 1mo | $187,000 | $139 | 86 |
| 204 Rocky Ave | 0.07mi | 3/1.0 | 1,183 (-11%) | 6mo | $175,000 | $148 | 74 |
| 311 Booth Ave | 0.19mi | 3/1.0 | 1,218 (-8%) | 6mo | $195,000 | $160 | 72 |
| 307 Booth Ave | 0.18mi | 3/2.0 | 1,344 (+1%) | 16mo | $236,000 | $176 | 72 |
| 405 Mintz Ln | 0.02mi | 3/2.0 | 1,462 (+10%) | 9mo | $295,000 | $202 | 70 |
| 806 Watson Ave | 0.57mi | 3/2.0 | 1,359 (+3%) | 5mo | $200,000 | $147 | 61 |
| 505 Coulter Ave | 0.28mi | 3/2.0 | 1,454 (+10%) | 18mo | $285,000 | $196 | 52 |
| 807 Coulter Ave | 0.60mi | 3/2.0 | 1,307 (-1%) | 20mo | $263,000 | $201 | 50 |
| 1123 Green Gate Rd Lot 8F | 0.67mi | 3/2.0 | 1,474 (+11%) | 4mo | $270,990 | $184 | 42 |
| 205 Webb St | 0.52mi | 4/2.0 (+1) | 1,464 (+10%) | 10mo | $280,000 | $191 | 41 |
| 517 Sugar Pine Way Unit 16A | 0.74mi | 3/2.0 | 1,425 (+8%) | 14mo | $293,200 | $206 | 38 |
| 915 Pine Top Ln Unit 3B | 0.75mi | 3/2.0 | 1,425 (+8%) | 18mo | $292,900 | $206 | 34 |
Match score weights: distance 35% · size 25% · config 20% · recency 20%. Top-matched comps best support the ARV.
Projected returns pro-forma
-3.0% appreciation · 3.0% rent growth · sell at horizon
- IRR
- -14.2%
- Equity multiple
- 0.49×
- Total profit
- $-35,337
- Equity at exit
- $37,052
- IRR
- -5.5%
- Equity multiple
- 0.64×
- Total profit
- $-24,781
- Equity at exit
- $21,486
Cash invested: $69,580 (down + closing). Projections, not guarantees.
Landlord ↔ Tenant lean methodology
- Overall (STATE)
- 87 Strongly Landlord-Friendly
- State Florida
- 87 Strongly Landlord-Friendly · R+3
- County
- — inherits STATE
- City
- — inherits STATE
ZIP-level market 32533
- Home prices YoY
- -14.6%
- Active inventory
- 513
- Price-to-rent
- 10.6×
Monthly cashflow live
- Estimated rent
- $1,946 medium interval (Pro) →
- Mortgage (P&I)
- −$1,303
- Tax from tax record
- −$51 /mo · $617/yr
- Insurance
- −$104
- HOA
- −$0
- Vacancy / Maint / Mgmt
- −$409
- Net cashflow
- $79
Break-even live
UW: 25.0% down · 7.5% · 30yr · 1.5% tax · 5.0% vac · 8.0% maint · 8.0% mgmt
Financing live
Cash to close
- Down payment
- $62,125
- Closing costs
- $7,455
- Reserves months
- —
- Total cash needed
- —
Loan-product check · same deal, 3 products live
Conventional
25% down · 7.5% · 30yr
- Down + closing
- —
- Monthly P&I
- —
- Monthly cashflow
- —
- DSCR
- —
- Eligible?
- —
Personal DTI + credit; lowest rate.
DSCR
20% down · 8.5% · 30yr
- Down + closing
- —
- Monthly P&I
- —
- Monthly cashflow
- —
- DSCR
- —
- Eligible?
- —
No personal income docs; deal must DSCR.
Hard money
10% down · 12.0% · 12mo
- Down + closing
- —
- Monthly P&I
- —
- Monthly cashflow
- —
- DSCR
- —
- Eligible?
- —
Short-term bridge; refi at stabilization.
Listing history 12 events
-
2026-06-18days on market $248,500 Active 17 DOM
-
2026-06-17days on market $248,500 Active 16 DOM
-
2026-06-16days on market $248,500 Active 15 DOM
-
2026-06-15days on market $248,500 Active 14 DOM
-
2026-06-14pricedays on market $248,500 Active 12 DOM
-
2026-06-10days on market $249,000 Active 9 DOM
-
2026-06-09days on market $249,000 Active 8 DOM
-
2026-06-08days on market $249,000 Active 7 DOM
-
2026-06-07days on market $249,000 Active 6 DOM
-
2026-06-03days on market $249,000 Active 2 DOM
-
2026-06-01remarks 693-char remark
-
2026-06-01$249,000 Active 1 DOM
ⓘ Source: listings_history table (triggers on properties + properties_extension) + one-shot
backfill from property_details.listing_events for pre-trigger history.
Tax reassessment forecast FL · Resets to sale price
- Current annual tax
- $617 · $51/mo
- Projected year-2 tax
- $2,063 · $172/mo
- Expected delta
- +$1,446/yr (+$120/mo · 234.3%)
ⓘ Screening estimate from a state-policy table — verify with the county assessor before closing.
Climate risk First Street
- Flood 1/10 Low FEMA zone X (unshaded) · 0% chance over 30 yrs
- Wildfire 4/10 Moderate
- Heat 9/10 Extreme 7 d/yr ≥105°F today · 21 d/yr by 30 yrs out
- Wind 9/10 Extreme 99% chance of damaging wind over 30 yrs
- Air quality 1/10 Low 0 unhealthy d/yr today · 0 by 30 yrs out
Nearby sold comps map
Loading sold comps map…
Walkable amenities ~0.75 mi
Loading nearby amenities…
Taxation est. · year 1
- Rental income
- $23,356
- − Mortgage interest
- −$13,920
- − Property taxes
- −$617
- − Insurance
- −$1,242
- − Repairs & maintenance
- −$1,868
- − Management
- −$1,868
- − Depreciation
- −$7,229
- Taxable loss
- −$3,390
- Est. tax savings @ 24.0%
- +$814
- After-tax cash flow
- $1,767/yr
For passive investors: Depreciation is non-cash, so a rental often shows a tax loss while cash-flowing — sheltering income. Rental losses are passive: they offset passive income freely, and up to $25,000/yr can offset ordinary (W-2) income if you actively participate and your MAGI is under $100k (phasing out to $0 by $150k); unused losses carry forward. On sale, claimed depreciation is recaptured at up to 25%, and gains may owe capital-gains tax (a 1031 exchange can defer both). Figures are a year-1 estimate at your 24.0% rate — not tax advice; consult a CPA.
Schools (NCES district)
- District
- Escambia
- NCES district ID
- 1200510
- Math proficiency
- 40% ▼ -9.00%
- Reading proficiency
- 45% ▼ -4.00%
- Median HH income
- $44,649
- Composite
- 36.04/100
- National rank
- #4773
- State rank
- #56 of 73 in FL
Livability — Gonzalez
- Score
- 71/100
- State rank
- #385
- US rank
- #6813
Category grades
Schools grade is shown separately in the Schools card above.
Census & demographics
- County
- Escambia County · 301,722 people
- Metro
- Pensacola-Ferry Pass-Brent, FL
- Population (ZIP)
- 31,860
- Household income
- $86,087
- Rent vs Own
- Severe rent burden
- 389.0
Population outlook (Escambia County) Hauer SSP2
- Today (2025)
- 334,637 people
- By 2030
- 345,779 · +3.3%
- By 2040
- 364,828 · +9.0%
- By 2050
- 378,514 · +13.1%
- By 2075
- 403,220 · +20.5%
- By 2100
- 386,125 · +15.4%
Race, ethnicity, and origin ACS 2023
- Neighborhood character
- Predominantly White (74%)
- Race & ethnicity
- White 74% Black 12% Two or more races 8% Hispanic / Latino 4% Asian 3%
- Common ancestry
- Italian 2% Serbian 2% Lithuanian 2%
- Foreign-born
- 3% · Canada, Guatemala, China
- Languages at home
- 96% English-only · Spanish 2% Vietnamese 1%
Political lean MEDSL · Escambia
- 2024 margin
- R (+19.5) · D 39.7% · R 59.2% · Other 1.1%
- 2008→2024 swing
- -0.2pp no change · 2008: -19.3pp · 2024: -19.5pp
- All cycles
- 2024: R+19.5 2020: R+15.1 2016: R+20.6 2012: R+20.6 2008: R+19.3
Not yet ingested
- Civics
- —
Market trends
- HPI YoY
- ▼ -44.13%
- Current HPI
- 259.2605
- Rent YoY
- —
- Metro
- Pensacola-Ferry Pass-Brent, FL
- State GDP YoY
- ▲ 3.28%
- F500 in state
- 36
Industry mix (Fortune 500 HQ in FL)
| Industry | F500 HQs | Revenue |
|---|---|---|
| Industrial Technology | 2 | $29B |
|
||
| Insurance | 2 | $17B |
|
||
| Retail | 1 | $60B |
|
||
| Technology Distribution | 1 | $58B |
|
||
| Homebuilding | 1 | $35B |
|
||
| Technology Manufacturing | 1 | $35B |
|
||
Price history
+634.5% since first listed9 events — show timeline
- 2026-06-01 Listed $249,000 PARMLS
- 2025-12-19 Sold (Public Records) $65,000 Public Records
- 2025-12-19 Sold (MLS) $65,000 PARMLS
- 2025-11-26 Contingent — PARMLS
- 2025-11-11 Price Changed $82,500 PARMLS
- 2025-10-30 Price Changed $95,000 PARMLS
- 2025-10-15 Listed $100,000 PARMLS
- 2005-03-08 Sold (Public Records) $77,000 Public Records
- 1990-10-01 Sold (Public Records) $33,900 Public Records
Property tax history
+3.7%/yrLatest (2025): $617 · +25.8% YoY. Source: county tax records.
Cash-flow waterfall
monthlySold comps — $/sqft
last 12 mo · ≤1 miLoading sold comps…