 Triplex
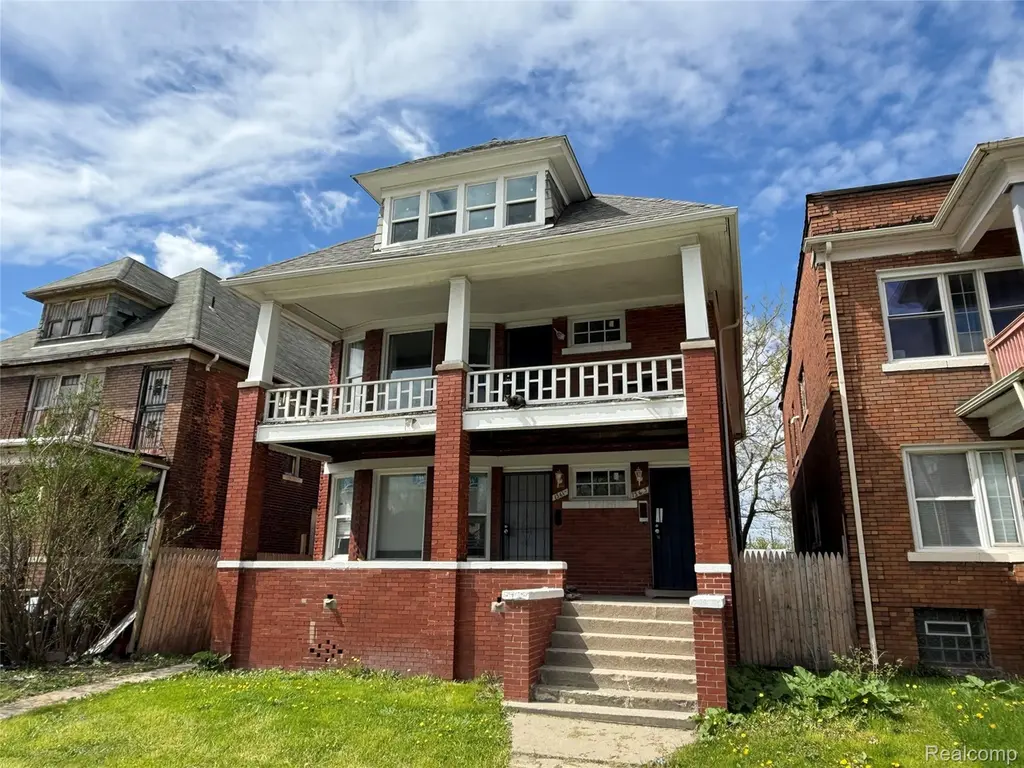
1561 W Grand Blvd · Detroit, MI
Flood risk 1/10 · Minimal
- FEMA flood zone
- X (unshaded)
- Chance of flooding over 30 yrs
- 0.0%
- Est. flood insurance / yr
- $507 – $1,088
Fire risk 1/10 · Minimal
- Est. fire insurance / yr
- $784 – $1,456
Heat risk 3/10 · Minor
- Hot days now (above 97°F)
- 7 days/yr
- Hot days in 30 yrs
- 15 days/yr
Wind risk 2/10 · Minimal
- Chance of severe wind over 30 yrs
- —
Air-quality risk 4/10 · Minor
- Unhealthy air days now
- 6 days/yr
- Unhealthy air days in 30 yrs
- 8 days/yr
Risk factors via First Street. Map © Google.
Why this score? — see what drove the B- grade
The composite is a weighted blend of 9 inputs, each scored 0–100. Each bar is that input's sub-score; the figure is the points it added to the 100-point composite (weight × sub-score).
- Cash flow +30.0/30.0
- DSCR +10.0/10.0
- 1% rule +9.4/10.0
- ARV discount +7.5/15.0
- Livability +3.7/5.0
- Rent growth +2.5/5.0
- Condition / age +2.5/5.0
- Schools +1.3/10.0
- Appreciation +0.0/10.0
$349,900
🖨 Deal sheet 📄 Offer letter ✓ Due diligence
Multi-family units
County records classify this as Multi-Family (2-4 Unit). Listing-text estimate: 3 units. confirmed
Listing remarks MLS
Turnkey, fully renovated triplex offering immediate income potential and attractive investment metrics in one of Detroit's rapidly improving neighborhoods. Located just minutes from Downtown Detroit, New Center, Henry Ford Hospital, Wayne State University, and major freeway access, this multifamily property is ideally positioned for both strong rental demand and long-term appreciation. All three units have been extensively updated with modern finishes, including renovated kitchens featuring quartz countertops, updated cabinetry, and beautifully remodeled bathrooms with quartz surfaces and contemporary fixtures. Investors will appreciate the significant capital improvements already completed, reducing near-term maintenance expenses and enhancing tenant appeal. The property is projected to generate approximately $3,300 per month ($39,600 annually) in gross rental income, with the second-floor unit currently leased at $1,200 per month. The first-floor unit is projected at $1,300 per month and the third-floor unit at $800 per month, providing immediate upside through lease-up of the remaining units. With a projected gross rent multiplier under 9 and estimated cap rate approaching 7%, this property presents a compelling opportunity for investors seeking cash flow, appreciation potential, and a renovated asset requiring minimal additional investment. Whether adding to an established portfolio or entering the multifamily market, this property checks all the boxes for today's investor. Rare opportunity to acquire a fully renovated triplex with strong income potential, modern finishes, and an unbeatable location near Detroit's largest employment, medical, and educational centers. Buyer and Buyer's Agent to verify all information. BATVAI.
Key facts
- Renovated kitchens
- Modern finishes
- Updated cabinetry
Tags
Property features AI
Exterior
- Utilities: Public water; Public sewer
- Home design: Residential income, multi-family property; Lot approximately 0.12 acres (40 x 125); Subdivision: BELA HUBBARDS SUB; Directions: North of Warren and east of I-94; near W Warren Avenue
- Construction: Brick construction; Block foundation; Above-grade finished area approximately 2,662
- Exterior features: Paved road access; Pets allowed
Interior
- Bedrooms: One 2-bedroom unit; Second 2-bedroom unit
- Bathrooms: Three full bathrooms; One half bathroom; Each 2-bedroom unit has one bathroom; One additional unit with one bathroom
- Heating & cooling: Forced air heating (natural gas); No central cooling listed
- Interior features: Full, unfinished basement
Neighborhood map
What this means for you Summary
Snapshot
- This is a 3 × 4-bed/3.5-bath units multifamily listed at $350k.
Deal economics
- At list price, monthly cash flow is $2k ($19k/yr) — positive. Per door: $517/mo.
- The deal already cash-flows at list — no discount required.
- Meets the 1% rule at list price ($5k rent vs $350k).
- Recommended offer: $345k (1.5% below list) — sets the bar for market timing.
Location & tenants
- Location reads 73/100 on livability (#218 in MI) — a middle-class / working-renter tenant base. Strengths: amenities A+, commute A+, cost of living A+; Watch: schools F, crime F, employment F.
- Detroit Public Schools Community District (urban): math 10% / reading 24% proficiency, ranked #499 of 540 in MI (top 92%) — low school quality limits family demand, transient renter base, plan for 1-2y turnover; 90% free/reduced lunch — lower-income household profile, screen leases tightly.
- Market conditions: 184 active listings in the ZIP; lower-income renter base — watch delinquency; 2,639 units permitted in Wayne County in 2024 (1,216 in 5+ unit buildings).
- At $5,023/mo this rent would consume 167% of the median local household income ($36k/yr) (locally 601% of renters already pay >50% of income on rent) — very limited rent-growth headroom before tenants either downsize or default.
Forward outlook
- Local home prices are declining (-3.0%/yr); year-one equity from $2k of loan paydown is wiped out by about $10k of value loss. Plan a longer hold.
- Wayne County population projected at -17% by 2050 — secular population decline; favor cash flow + early exit over multi-decade hold.
- At projected returns (-3.0% appreciation + 3.0% rent growth), your $98k cash investment doubles in ~7 years — after that, you're playing with house money.
Negotiation context
- It's been on market 15 days — a 2% lower offer ($345k) is reasonable based on typical stale-listing flexibility.
- 6 sale attempts since 2y ago with the ask held roughly flat each time — persistent listings suggest the price (not the market) is what's stuck; bring a comps-based counter.
- Current owner paid $195k; list at $350k implies a 80% gain — meaningful room to come down on a strong offer.
Risks & watch-outs
- Watch-outs: built in 1912 — expect roof / HVAC / electrical / plumbing capex.
Questions for the listing agent
- Can we see the unit-by-unit rent roll, current vacancy, and any below-market leases? What's the average tenancy length?
- What capital expenditures (roof, boiler, parking lot, exteriors) have been made in the last 5 years, and what's planned in the next 2?
- Built in 1912 — when were the roof, HVAC, electrical panel, plumbing, and water heater last replaced?
- Is there a deadline driving the sale (1031 exchange, divorce, estate, relocation)? That informs how much negotiation room exists.
- Schools are F-rated, which usually means shorter tenancies and higher turnover. Who's the typical renter profile here, and what's been the actual vacancy rate?
- Crime grade is F in this area — have there been break-ins, vandalism, or insurance claims at this property in the last 3 years? What carrier currently insures it and at what premium?
- What's the average days-on-market for RENTAL listings here right now (not sales)? A rising rental-DOM trend means longer vacancies and softer asking-rent achievability than the comps imply.
- What's the recent tenant-quality profile in this submarket — average credit score on applications, eviction rate, late-payment / NSF rate, and stable-employment percentage? A property-management company in the area should have these aggregated.
- How much new apartment / multifamily construction is in the pipeline within 1–3 miles? Heavy new supply (>2% of stock underway) typically softens rents 12–24 months out; light construction supports rent growth.
Investment metrics
- 1% rule
- 1.44% ✓
- Cap rate
- 11.61%
- Cash-on-cash
- 18.99%
- DSCR
- 1.84
- GRM
- 5.8
CMA / ARV
No comps found within radius.
Projected returns pro-forma
-3.0% appreciation · 3.0% rent growth · sell at horizon
- IRR
- 10.9%
- Equity multiple
- 1.43×
- Total profit
- $42,103
- Equity at exit
- $52,171
- IRR
- 19.9%
- Equity multiple
- 2.67×
- Total profit
- $164,096
- Equity at exit
- $30,253
Cash invested: $97,972 (down + closing). Projections, not guarantees.
Landlord ↔ Tenant lean methodology
- Overall (STATE)
- 62 Landlord-Friendly
- State Michigan
- 62 Landlord-Friendly · EVEN
- County
- — inherits STATE
- City
- — inherits STATE
ZIP-level market 48208
- Home prices YoY
- -5.9%
- Active inventory
- 184
- Price-to-rent
- 17.4×
Monthly cashflow live
- Estimated rent
- $5,023 medium interval (Pro) →
- Mortgage (P&I)
- −$1,835
- Tax est. 1.5%
- −$437 /mo · $5,248/yr
- Insurance
- −$146
- HOA
- −$0
- Vacancy / Maint / Mgmt
- −$1,055
- Net cashflow
- $1,550
Break-even live
3-unit breakdown (identical units grouped — click to expand)
| Units | Beds | Baths | Est. rent |
|---|---|---|---|
| 3× units | 4 | 3.5 | $5,022 |
| #1 | 4 | 3.5 | $1,674 |
| #2 | 4 | 3.5 | $1,674 |
| #3 | 4 | 3.5 | $1,674 |
| Total (3 units) | $5,023 | ||
UW: 25.0% down · 7.5% · 30yr · 1.5% tax · 5.0% vac · 8.0% maint · 8.0% mgmt
Financing live
Cash to close
- Down payment
- $87,475
- Closing costs
- $10,497
- Reserves months
- —
- Total cash needed
- —
Loan-product check · same deal, 3 products live
Conventional
25% down · 7.5% · 30yr
- Down + closing
- —
- Monthly P&I
- —
- Monthly cashflow
- —
- DSCR
- —
- Eligible?
- —
Personal DTI + credit; lowest rate.
DSCR
20% down · 8.5% · 30yr
- Down + closing
- —
- Monthly P&I
- —
- Monthly cashflow
- —
- DSCR
- —
- Eligible?
- —
No personal income docs; deal must DSCR.
Hard money
10% down · 12.0% · 12mo
- Down + closing
- —
- Monthly P&I
- —
- Monthly cashflow
- —
- DSCR
- —
- Eligible?
- —
Short-term bridge; refi at stabilization.
Listing history 12 events
-
2026-06-18days on market $349,900 Active 15 DOM
-
2026-06-17days on market $349,900 Active 14 DOM
-
2026-06-16days on market $349,900 Active 13 DOM
-
2026-06-15days on market $349,900 Active 12 DOM
-
2026-06-13days on market $349,900 Active 10 DOM
-
2026-06-13days on market $349,900 Active 9 DOM
-
2026-06-09days on market $349,900 Active 7 DOM
-
2026-06-08days on market $349,900 Active 6 DOM
-
2026-06-07days on market $349,900 Active 5 DOM
-
2026-06-04days on market $349,900 Active 2 DOM
-
2026-06-02remarks 699-char remark
-
2026-06-02$349,900 Active 1 DOM
ⓘ Source: listings_history table (triggers on properties + properties_extension) + one-shot
backfill from property_details.listing_events for pre-trigger history.
Climate risk First Street
- Flood 1/10 Low FEMA zone X (unshaded) · 0% chance over 30 yrs
- Wildfire 1/10 Low
- Heat 3/10 Moderate 7 d/yr ≥97°F today · 15 d/yr by 30 yrs out
- Wind 2/10 Low
- Air quality 4/10 Moderate 6 unhealthy d/yr today · 8 by 30 yrs out
Nearby sold comps map
Loading sold comps map…
Walkable amenities ~0.75 mi
Loading nearby amenities…
Taxation est. · year 1
- Rental income
- $60,276
- − Mortgage interest
- −$19,600
- − Property taxes
- −$5,248
- − Insurance
- −$1,750
- − Repairs & maintenance
- −$4,822
- − Management
- −$4,822
- − Depreciation
- −$10,179
- Taxable income
- $13,855
- Est. tax owed @ 24.0%
- −$3,325
- After-tax cash flow
- $15,276/yr
For passive investors: Depreciation is non-cash, so a rental often shows a tax loss while cash-flowing — sheltering income. Rental losses are passive: they offset passive income freely, and up to $25,000/yr can offset ordinary (W-2) income if you actively participate and your MAGI is under $100k (phasing out to $0 by $150k); unused losses carry forward. On sale, claimed depreciation is recaptured at up to 25%, and gains may owe capital-gains tax (a 1031 exchange can defer both). Figures are a year-1 estimate at your 24.0% rate — not tax advice; consult a CPA.
Schools (NCES district)
- District
- Detroit Public Schools Community District
- NCES district ID
- 2601103
- Math proficiency
- 10% ▼ -2.00%
- Reading proficiency
- 24% ▲ 6.00%
- Median HH income
- $25,815
- Composite
- 13.06/100
- National rank
- #9564
- State rank
- #499 of 540 in MI
Livability — Detroit
- Score
- 73/100
- State rank
- #218
- US rank
- #5427
Category grades
Schools grade is shown separately in the Schools card above.
Census & demographics
- Census place
- Detroit, MI
- County
- Wayne County · 1,562,939 people
- City population
- 572,865
- Metro
- Detroit-Warren-Dearborn, MI
- Population (ZIP)
- 8,037
- Household income
- $36,194
- Rent vs Own
- Severe rent burden
- 601.0
Population outlook (Wayne County) Hauer SSP2
- Today (2025)
- 1,675,273 people
- By 2030
- 1,620,300 · -3.3%
- By 2040
- 1,502,341 · -10.3%
- By 2050
- 1,384,039 · -17.4%
- By 2075
- 1,124,592 · -32.9%
- By 2100
- 881,193 · -47.4%
Race, ethnicity, and origin ACS 2023
- Neighborhood character
- Predominantly Black (66%)
- Race & ethnicity
- Black 66% White 23% Two or more races 7% Hispanic / Latino 6% Asian 1%
- Hispanic origin (detail)
- Mexican 3% Puerto Rican 1%
- Common ancestry
- Romanian 3% Lithuanian 1% Slovak 1%
- Foreign-born
- 2% · Canada
- Languages at home
- 94% English-only · Spanish 5% Arabic 1%
Political lean MEDSL · Wayne
- 2024 margin
- Strong D (+29.0) · D 62.7% · R 33.7% · Other 3.6%
- 2008→2024 swing
- -20.5pp toward R · 2008: 49.5pp · 2024: 29.0pp
- All cycles
- 2024: D+29.0 2020: D+38.1 2016: D+37.3 2012: D+46.9 2008: D+49.5
Not yet ingested
- Civics
- —
Market trends
- HPI YoY
- ▼ -10.56%
- Current HPI
- 168.8907
- Rent YoY
- —
- Metro
- Detroit-Warren-Dearborn, MI
- State GDP YoY
- ▲ 1.37%
- F500 in state
- 28
Industry mix (Fortune 500 HQ in MI)
| Industry | F500 HQs | Revenue |
|---|---|---|
| Automotive Parts | 3 | $48B |
|
||
| Automotive | 2 | $372B |
|
||
| Chemicals | 1 | $45B |
|
||
| Automotive Retail | 1 | $29B |
|
||
| Healthcare / Medical Devices | 1 | $23B |
|
||
| Automotive Technology | 1 | $20B |
|
||
Price history
+206.9% since first listed17 events — show timeline
- 2026-05-27 Listed $349,900 MiRealSource-MiMLS
- 2026-05-27 Listed $349,900 REALCOMP
- 2025-01-29 Sold (Public Records) $194,900 Public Records
- 2025-01-10 Sold (MLS) $194,900 REALCOMP
- 2025-01-10 Sold (MLS) $194,900 MiRealSource-MiMLS
- 2024-12-26 Pending — MiRealSource-MiMLS
- 2024-12-26 Pending — REALCOMP
- 2024-12-14 Relisted — MiRealSource-MiMLS
- 2024-12-14 Relisted — REALCOMP
- 2024-11-05 Pending — MiRealSource-MiMLS
- 2024-11-05 Pending — REALCOMP
- 2024-10-11 Price Changed $194,900 MiRealSource-MiMLS
- 2024-10-11 Price Changed $194,900 REALCOMP
- 2024-09-25 Listed $205,000 REALCOMP
- 2024-09-25 Listed $205,000 MiRealSource-MiMLS
- 2006-02-06 Sold (Public Records) $110,000 Public Records
- 2004-08-20 Sold (Public Records) $114,000 Public Records
Property tax history
+6.7%/yrLatest (2025): $695 · -42.1% YoY. Source: county tax records.
Cash-flow waterfall
monthlySold comps — $/sqft
last 12 mo · ≤1 miLoading sold comps…