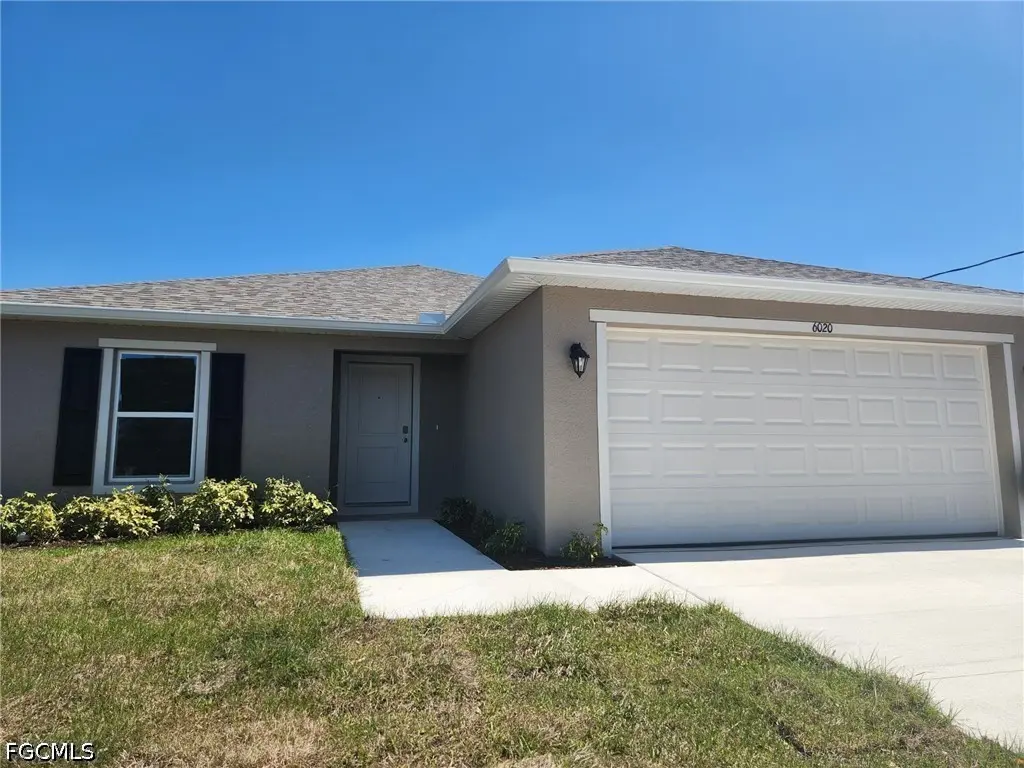
6020 Pat Ave N · Lehigh Acres, FL
Flood risk 1/10 · Minimal
- FEMA flood zone
- X (unshaded)
- Chance of flooding over 30 yrs
- 0.0%
- Est. flood insurance / yr
- $507 – $1,088
Fire risk 4/10 · Minor
- Est. fire insurance / yr
- $947 – $1,759
Heat risk 9/10 · Severe
- Hot days now (above 108°F)
- 7 days/yr
- Hot days in 30 yrs
- 26 days/yr
Wind risk 10/10 · Severe
- Chance of severe wind over 30 yrs
- 99.0%
Air-quality risk 2/10 · Minimal
- Unhealthy air days now
- 1 days/yr
- Unhealthy air days in 30 yrs
- 1 days/yr
Risk factors via First Street. Map © Google.
Why this score? — see what drove the F grade
The composite is a weighted blend of 9 inputs, each scored 0–100. Each bar is that input's sub-score; the figure is the points it added to the 100-point composite (weight × sub-score).
- ARV discount +7.5/15.0
- Cash flow +7.4/30.0
- Schools +4.1/10.0
- Livability +3.0/5.0
- Condition / age +2.5/5.0
- 1% rule +2.1/10.0
- DSCR +1.5/10.0
- Rent growth +1.3/5.0
- Appreciation +0.0/10.0
$313,000
🖨 Deal sheet 📄 Offer letter ✓ Due diligence
Listing remarks MLS
Introducing the Queen, a four-bedroom floor plan from our Value collection. Designed for privacy and comfort, this home features three bedrooms on one side while the Owner's Suite is situated on the other side. As you enter through the foyer, you'll notice the Great Room and Dining Area offers a seamless flow and abundant natural light from the sliding glass doors leading to the backyard. The kitchen, positioned at the back of the home, is conveniently adjacent to the dining room. With ample counterspace and cabinets, it provides the perfect setting for culinary endeavors and storage of all your essentials. The laundry room, located within the home, flows seamlessly into the two-car garage, enhancing convenience and functionality. Rest assured that the Queen floor plan exemplifies our commitment to quality craftsmanship. Constructed using CBS (Concrete Block System), this home incorporates energy-smart features throughout, including a digital thermostat, a ventilation and A/C system, a roof vent and soffit for attic ventilation, and dual-pane energy-efficient windows. We stand behind the quality of our homes, which is why the Queen floor plan includes a 1-year transferable builder warranty and a 10-year structural warranty.
Key facts
- Tile floors
- Under truss lanai
- Sliding glass doors
Tags
Property features AI
Finance
- Financial info: Pets allowed
- HOA & community: No association fee listed
Exterior
- Parking: Attached 2-car garage; Driveway; Paved parking
- Utilities: Cable available; Well water; Septic tank
- Home design: Single-story home; New construction; Faces west; Entry level: 1; Lot exposures: East
- Construction: Block, concrete and stucco construction; Shingle roof; Built as new construction
- Exterior features: Shutters (manual); No additional exterior features listed
Interior
- Kitchen: Dishwasher; Range
- Bedrooms: Master bedroom (12 x 16); Three additional bedrooms (each 12 x 12)
- Flooring: Carpet; Tile
- Bathrooms: 2 full bathrooms; Separate shower(s)
- Heating & cooling: Central heating (electric); Central air conditioning (electric)
- Interior features: Double-hung windows; Separate/formal dining room; Pantry; Separate shower (shower only); Walk-in closets; Split-bedroom floor plan; Unfurnished
- Laundry & utility: Laundry inside
Neighborhood map
What this means for you Summary
Snapshot
- This is a 4-bed/2.0-bath land listed at $313k.
Deal economics
- At list price, monthly cash flow is $-402 ($-5k/yr) — negative.
- To cash-flow at today's rent, offer at most $255k (18.6% below list).
- To meet the 1% rule (rent ≥ 1% of price), the offer needs to be $223k (28.8% below list).
- Recommended offer: $223k (28.8% below list) — sets the bar for 1% rule.
Location & tenants
- Location reads 59/100 on livability (#826 in FL) — a working-class tenant base; expect higher turnover. Strengths: cost of living A+, housing A+; Watch: crime C-, employment D+, schools D-.
- Lee (suburban): math 47% / reading 50% proficiency, ranked #42 of 73 in FL (top 58%) — families likely to look elsewhere, expect single-tenant / working-renter base with shorter leases.
- Market conditions: Rents falling (-4.7%/yr); 1335 active listings in the ZIP; 40 comparable units currently listed for rent nearby; rentals leasing fast (median 14d on market — plan ~1-2 weeks tenant-placement turnaround); solid renter incomes; 15,411 units permitted in Lee County in 2024 (4,686 in 5+ unit buildings).
- This rent runs 34% of the median local income ($78k/yr) — at the standard rent-burdened threshold; future hikes will face affordability resistance.
Forward outlook
- Local home prices are declining (-3.0%/yr); year-one equity from $2k of loan paydown is wiped out by about $9k of value loss. Plan a longer hold.
- Lee County population projected at +44% by 2050 — long-run rental-demand tailwind backs the buy-and-hold thesis.
Negotiation context
- It's been on market 93 days — a 9% lower offer ($285k) is reasonable based on typical stale-listing flexibility.
- 2 sale attempts with the ask held roughly flat each time — persistent listings suggest the price (not the market) is what's stuck; bring a comps-based counter.
- Current owner paid $20k; list at $313k implies a 1465% gain — meaningful room to come down on a strong offer.
Risks & watch-outs
- Climate carrying-cost: severe wind risk, 99% chance of damaging wind over 30y; extreme-heat days projected 7→26/yr by 2055 (HVAC capex compounding) — expect insurance premiums to compound above CPI over the hold.
Questions for the listing agent
- What do current leases actually rent for vs. the listed asking? Can we see a recent rent roll and the last 12 months of T-12 income?
- It's been on market 93 days. Have you received any prior offers? Is the seller open to a 29% concession, seller financing, or rate buy-down credit?
- Why hasn't it sold? Are there any deal-killer items the seller is aware of (foundation, flood, title, zoning, code violations)?
- Is there a deadline driving the sale (1031 exchange, divorce, estate, relocation)? That informs how much negotiation room exists.
- Schools are D-rated, which usually means shorter tenancies and higher turnover. Who's the typical renter profile here, and what's been the actual vacancy rate?
- The area grade is low — what's the realistic commute time and amenity access for the typical tenant pool here? Any planned neighborhood developments (good or bad) we should know about?
- What's the average days-on-market for RENTAL listings here right now (not sales)? A rising rental-DOM trend means longer vacancies and softer asking-rent achievability than the comps imply.
- What's the recent tenant-quality profile in this submarket — average credit score on applications, eviction rate, late-payment / NSF rate, and stable-employment percentage? A property-management company in the area should have these aggregated.
- How much new for-sale + rental construction is in the pipeline within 1–3 miles? Heavy new supply typically softens prices + rents 12–24 months out; constrained supply supports both.
Investment metrics
- 1% rule
- 0.71% ✗
- Cap rate
- 4.75%
- Cash-on-cash
- -5.51%
- DSCR
- 0.75
- GRM
- 11.7
CMA / ARV
No comps found within radius.
Projected returns pro-forma
-3.0% appreciation · 0.0% rent growth · sell at horizon
- IRR
- -29.1%
- Equity multiple
- 0.05×
- Total profit
- $-82,846
- Equity at exit
- $46,669
- IRR
- -47.2%
- Equity multiple
- -0.49×
- Total profit
- $-130,246
- Equity at exit
- $27,063
Cash invested: $87,640 (down + closing). Projections, not guarantees.
Landlord ↔ Tenant lean methodology
- Overall (STATE)
- 87 Strongly Landlord-Friendly
- State Florida
- 87 Strongly Landlord-Friendly · R+3
- County
- — inherits STATE
- City
- — inherits STATE
ZIP-level market 33971
- Home prices YoY
- -8.0%
- Rents YoY
- -4.7%
- Active inventory
- 1335
- Price-to-rent
- 11.7×
Monthly cashflow live
- Estimated rent
- $2,229 high interval (Pro) →
- Mortgage (P&I)
- −$1,641
- Tax est. 1.5%
- −$391 /mo · $4,695/yr
- Insurance
- −$130
- HOA
- −$0
- Vacancy / Maint / Mgmt
- −$468
- Net cashflow
- $-402
Break-even live
UW: 25.0% down · 7.5% · 30yr · 1.5% tax · 5.0% vac · 8.0% maint · 8.0% mgmt
Financing live
Cash to close
- Down payment
- $78,250
- Closing costs
- $9,390
- Reserves months
- —
- Total cash needed
- —
Loan-product check · same deal, 3 products live
Conventional
25% down · 7.5% · 30yr
- Down + closing
- —
- Monthly P&I
- —
- Monthly cashflow
- —
- DSCR
- —
- Eligible?
- —
Personal DTI + credit; lowest rate.
DSCR
20% down · 8.5% · 30yr
- Down + closing
- —
- Monthly P&I
- —
- Monthly cashflow
- —
- DSCR
- —
- Eligible?
- —
No personal income docs; deal must DSCR.
Hard money
10% down · 12.0% · 12mo
- Down + closing
- —
- Monthly P&I
- —
- Monthly cashflow
- —
- DSCR
- —
- Eligible?
- —
Short-term bridge; refi at stabilization.
Rent comps 40 comps
| Address | Beds | Baths | Sqft | Rent | $/sqft | DOM | Units | Dist |
|---|---|---|---|---|---|---|---|---|
| 3202 61st St W Lehigh Acres, FL | 3.0 | 2.0 | 1777 | $1,800 | $1.01 | 23d | 1 | 0.04mi |
| 3217 64th St W Lehigh Acres, FL | 4.0 | 2.0 | 1897 | $2,400 | $1.27 | 3d | 1 | 0.19mi |
| 3016 62nd St W Lehigh Acres, FL | 4.0 | 2.0 | 1389 | $1,750 | $1.26 | 21d | 1 | 0.27mi |
| 3208 66th St W Lehigh Acres, FL | 4.0 | 2.0 | 1800 | $2,100 | $1.17 | 11d | 1 | 0.33mi |
| 3013 64th St W Lehigh Acres, FL | 3.0 | 2.0 | 1389 | $1,750 | $1.26 | 23d | 1 | 0.33mi |
| 3105 66th St W Lehigh Acres, FL | 3.0 | 2.0 | 1615 | $2,000 | $1.24 | 23d | 1 | 0.34mi |
| 3103 58th St W Lehigh Acres, FL | 3.0 | 2.0 | 1310 | $1,800 | $1.37 | 3d | 1 | 0.38mi |
| 5901 Rita Ave N Lehigh Acres, FL | 3.0 | 2.0 | 1324 | $2,000 | $1.51 | 23d | 1 | 0.39mi |
| 3201 57th St W Lehigh Acres, FL | 3.0 | 2.0 | 1630 | $2,100 | $1.29 | 23d | 1 | 0.40mi |
| 3306 56th St W #1 Lehigh Acres, FL | 4.0 | 2.0 | 1534 | $2,099 | $1.37 | 21d | 1 | 0.47mi |
| 2910 61st St W Lehigh Acres, FL | 4.0 | 2.0 | 1810 | $2,095 | $1.16 | 21d | 1 | 0.48mi |
| 2910 61st St W Lehigh Acres, FL | 4.0 | 2.0 | 1810 | $1,915 | $1.06 | 1d | 1 | 0.48mi |
| 2910 57th St W Lehigh Acres, FL | 3.0 | 2.0 | 1550 | $1,805 | $1.16 | 1d | 1 | 0.52mi |
| 2906 65th St W Lehigh Acres, FL | 3.0 | 2.0 | 1310 | $2,175 | $1.66 | 23d | 1 | 0.56mi |
| 3505 67th St W Lehigh Acres, FL | 4.0 | 2.0 | 1389 | $1,799 | $1.30 | 16d | 1 | 0.59mi |
| 3404 68th St W Lehigh Acres, FL | 3.0 | 2.0 | 1458 | $1,855 | $1.27 | 3d | 1 | 0.59mi |
| 2906 68th St W Lehigh Acres, FL | 3.0 | 2.0 | 1239 | $1,875 | $1.51 | 23d | 1 | 0.59mi |
| 3406 68th St W Lehigh Acres, FL | 3.0 | 2.0 | 1472 | $1,875 | $1.27 | 3d | 1 | 0.60mi |
| 2806 58th St W Lehigh Acres, FL | 4.0 | 2.0 | 1993 | $2,300 | $1.15 | 3d | 1 | 0.65mi |
| 3213 51st St W Lehigh Acres, FL | 3.0 | 2.0 | 1654 | $2,250 | $1.36 | 1d | 1 | 0.76mi |
| 2809 55th St W Lehigh Acres, FL | 4.0 | 2.5 | 2113 | $2,300 | $1.09 | 3d | 1 | 0.76mi |
| 3601 57th St W Lehigh Acres, FL | 3.0 | 2.0 | 1458 | $1,850 | $1.27 | 3d | 1 | 0.77mi |
| 3012 51st St W Lehigh Acres, FL | 3.0 | 2.0 | 1551 | $1,599 | $1.03 | 16d | 1 | 0.77mi |
| 2713 56th St W Lehigh Acres, FL | 3.0 | 2.0 | 1606 | $2,100 | $1.31 | 21d | 1 | 0.83mi |
| 3304 49th St W Lehigh Acres, FL | 3.0 | 2.0 | 1399 | $2,340 | $1.67 | 1d | 1 | 0.86mi |
| 6048 Stratton Rd Fort Myers, FL | 3.0 | 2.0 | 1635 | $2,200 | $1.35 | 3d | 1 | 0.86mi |
| 6050 Stratton Rd Fort Myers, FL | 3.0 | 2.0 | 1635 | $2,200 | $1.35 | 3d | 1 | 0.87mi |
| 3502 72nd St W Lehigh Acres, FL | 4.0 | 2.0 | 1389 | $1,750 | $1.26 | 16d | 1 | 0.88mi |
| 3502 72nd St W Lehigh Acres, FL | 4.0 | 2.0 | 1920 | $1,750 | $0.91 | 2d | 1 | 0.88mi |
| 6108 Stratton Rd Fort Myers, FL | 3.0 | 2.0 | 1635 | $2,200 | $1.35 | 3d | 1 | 0.94mi |
| 3512 50th St W Lehigh Acres, FL | 3.0 | 2.0 | 1615 | $1,995 | $1.24 | 13d | 1 | 0.94mi |
| 6016 Lindbrook Ave Fort Myers, FL | 3.0 | 2.0 | 1422 | $1,800 | $1.27 | 21d | 1 | 0.95mi |
| 6006 Dora Ave N Lehigh Acres, FL | 3.0 | 2.0 | 1272 | $2,061 | $1.62 | 2d | 1 | 0.96mi |
| 3776 Passion Vine Dr Unit 1 Alva, FL | 3.0 | 2.0 | 1885 | $2,200 | $1.17 | 23d | 1 | 0.98mi |
| 3917 Passion Vine Dr Alva, FL | 4.0 | 3.0 | 1933 | $2,500 | $1.29 | 16d | 1 | 0.98mi |
| 5100 Hanna Ave N Lehigh Acres, FL | 3.0 | 2.0 | 1918 | $1,950 | $1.02 | 3d | 1 | 1.01mi |
| 3984 Sweet Alyssum Ter Alva, FL | 4.0 | 3.0 | 2032 | $2,500 | $1.23 | 3d | 1 | 1.05mi |
| 3958 Button Sage Rd Alva, FL | 4.0 | 3.0 | 2032 | $3,950 | $1.94 | 14d | 1 | 1.06mi |
| 3655 Rain Lily Ln Alva, FL | 4.0 | 2.0 | 1851 | $2,250 | $1.22 | 23d | 1 | 1.11mi |
| 6136 Hellman Ave Fort Myers, FL | 3.0 | 2.0 | 1297 | $1,876 | $1.45 | 3d | 1 | 1.13mi |
Listing history 17 events
-
2026-06-17days on market $313,000 Active 93 DOM
-
2026-06-16days on market $313,000 Active 92 DOM
-
2026-06-15days on market $313,000 Active 91 DOM
-
2026-06-13pricedays on market $313,000 Active 89 DOM
-
2026-06-10days on market $335,000 Active 86 DOM
-
2026-06-09days on market $335,000 Active 85 DOM
-
2026-06-07days on market $335,000 Active 83 DOM
-
2026-06-03days on market $335,000 Active 79 DOM
-
2026-06-02days on market $335,000 Active 78 DOM
-
2026-06-01days on market $335,000 Active 77 DOM
-
2026-06-01days on market $335,000 Active 76 DOM
-
2026-04-16price $335,000
-
2026-03-06price $335,000 1243-char remark
Show marketing remark (1243 chars)
Introducing the Queen, a four-bedroom floor plan from our Value collection. Designed for privacy and comfort, this home features three bedrooms on one side while the Owner's Suite is situated on the other side. As you enter through the foyer, you'll notice the Great Room and Dining Area offers a seamless flow and abundant natural light from the sliding glass doors leading to the backyard. The kitchen, positioned at the back of the home, is conveniently adjacent to the dining room. With ample counterspace and cabinets, it provides the perfect setting for culinary endeavors and storage of all your essentials. The laundry room, located within the home, flows seamlessly into the two-car garage, enhancing convenience and functionality. Rest assured that the Queen floor plan exemplifies our commitment to quality craftsmanship. Constructed using CBS (Concrete Block System), this home incorporates energy-smart features throughout, including a digital thermostat, a ventilation and A/C system, a roof vent and soffit for attic ventilation, and dual-pane energy-efficient windows. We stand behind the quality of our homes, which is why the Queen floor plan includes a 1-year transferable builder warranty and a 10-year structural warranty.
-
2026-02-17$325,000 Active
-
2025-04-12$325,000 Active 1243-char remark
Show marketing remark (1243 chars)
Introducing the Queen, a four-bedroom floor plan from our Value collection. Designed for privacy and comfort, this home features three bedrooms on one side while the Owner's Suite is situated on the other side. As you enter through the foyer, you'll notice the Great Room and Dining Area offers a seamless flow and abundant natural light from the sliding glass doors leading to the backyard. The kitchen, positioned at the back of the home, is conveniently adjacent to the dining room. With ample counterspace and cabinets, it provides the perfect setting for culinary endeavors and storage of all your essentials. The laundry room, located within the home, flows seamlessly into the two-car garage, enhancing convenience and functionality. Rest assured that the Queen floor plan exemplifies our commitment to quality craftsmanship. Constructed using CBS (Concrete Block System), this home incorporates energy-smart features throughout, including a digital thermostat, a ventilation and A/C system, a roof vent and soffit for attic ventilation, and dual-pane energy-efficient windows. We stand behind the quality of our homes, which is why the Queen floor plan includes a 1-year transferable builder warranty and a 10-year structural warranty.
-
2024-11-21soldstatus $20,000
-
1996-04-12soldstatus $8,600
ⓘ Source: listings_history table (triggers on properties + properties_extension) + one-shot
backfill from property_details.listing_events for pre-trigger history.
Climate risk First Street
- Flood 1/10 Low FEMA zone X (unshaded) · 0% chance over 30 yrs
- Wildfire 4/10 Moderate
- Heat 9/10 Extreme 7 d/yr ≥108°F today · 26 d/yr by 30 yrs out
- Wind 10/10 Extreme 99% chance of damaging wind over 30 yrs
- Air quality 2/10 Low 1 unhealthy d/yr today · 1 by 30 yrs out
Nearby sold comps map
Loading sold comps map…
Walkable amenities ~0.75 mi
Loading nearby amenities…
Taxation est. · year 1
- Rental income
- $26,745
- − Mortgage interest
- −$17,533
- − Property taxes
- −$4,695
- − Insurance
- −$1,565
- − Repairs & maintenance
- −$2,140
- − Management
- −$2,140
- − Depreciation
- −$9,105
- Taxable loss
- −$10,433
- Est. tax savings @ 24.0%
- +$2,504
- After-tax cash flow
- $-2,325/yr
For passive investors: Depreciation is non-cash, so a rental often shows a tax loss while cash-flowing — sheltering income. Rental losses are passive: they offset passive income freely, and up to $25,000/yr can offset ordinary (W-2) income if you actively participate and your MAGI is under $100k (phasing out to $0 by $150k); unused losses carry forward. On sale, claimed depreciation is recaptured at up to 25%, and gains may owe capital-gains tax (a 1031 exchange can defer both). Figures are a year-1 estimate at your 24.0% rate — not tax advice; consult a CPA.
Schools (NCES district)
- District
- Lee
- NCES district ID
- 1201080
- Math proficiency
- 47% ▼ -11.00%
- Reading proficiency
- 50% ▼ -4.00%
- Median HH income
- $49,518
- Composite
- 41.49/100
- National rank
- #3458
- State rank
- #42 of 73 in FL
Livability — Lehigh Acres
- Score
- 59/100
- State rank
- #826
- US rank
- #20055
Category grades
Schools grade is shown separately in the Schools card above.
Census & demographics
- Census place
- Lehigh Acres, FL
- County
- Lee County · 788,662 people
- City population
- 130,638
- Metro
- Cape Coral-Fort Myers, FL
- Population (ZIP)
- 30,790
- Household income
- $77,723
- Rent vs Own
- Severe rent burden
- 587.0
Population outlook (Lee County) Hauer SSP2
- Today (2025)
- 871,946 people
- By 2030
- 955,468 · +9.6%
- By 2040
- 1,113,587 · +27.7%
- By 2050
- 1,256,891 · +44.1%
- By 2075
- 1,560,270 · +78.9%
- By 2100
- 1,726,848 · +98.0%
Race, ethnicity, and origin ACS 2023
- Neighborhood character
- Diverse neighborhood (Simpson 0.65)
- Race & ethnicity
- Hispanic / Latino 49% Two or more races 32% White 26% Black 19% Asian 2%
- Hispanic origin (detail)
- Mexican 9% Puerto Rican 13% Cuban 14% Dominican 2%
- Common ancestry
- Hispanic 7% Estonian 1% Romanian 1%
- Foreign-born
- 31% · Canada, Vietnam, Guatemala
- Languages at home
- 46% English-only · Spanish 41% French/Haitian/Cajun 9% Other Indo-European 2%
Political lean MEDSL · Lee
- 2024 margin
- Strong R (+28.4) · D 35.5% · R 63.9%
- 2008→2024 swing
- -18.0pp toward R · 2008: -10.4pp · 2024: -28.4pp
- All cycles
- 2024: R+28.4 2020: R+19.2 2016: R+20.4 2012: R+16.6 2008: R+10.4
Not yet ingested
- Civics
- —
Market trends
- HPI YoY
- ▼ -27.68%
- Current HPI
- 317.7147
- Rent YoY
- ▼ -4.69%
- Metro
- Cape Coral-Fort Myers, FL
- State GDP YoY
- ▲ 3.28%
- F500 in state
- 36
Industry mix (Fortune 500 HQ in FL)
| Industry | F500 HQs | Revenue |
|---|---|---|
| Industrial Technology | 2 | $29B |
|
||
| Insurance | 2 | $17B |
|
||
| Retail | 1 | $60B |
|
||
| Technology Distribution | 1 | $58B |
|
||
| Homebuilding | 1 | $35B |
|
||
| Technology Manufacturing | 1 | $35B |
|
||
Price history
+3795.3% since first listed6 events — show timeline
- 2026-04-16 Price Changed $335,000 FORTMLS
- 2026-03-06 Price Changed $335,000 Zillow
- 2026-02-17 Listed $325,000 FORTMLS
- 2025-04-12 Listed $325,000 Zillow
- 2024-11-21 Sold (Public Records) $20,000 Public Records
- 1996-04-12 Sold (Public Records) $8,600 Public Records
Property tax history
+19.5%/yrLatest (2025): $455 · +13.0% YoY. Source: county tax records.
Cash-flow waterfall
monthlySold comps — $/sqft
last 12 mo · ≤1 miLoading sold comps…