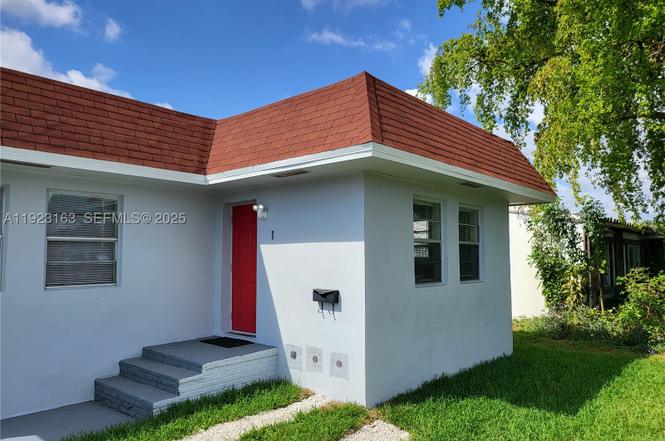
 Duplex
None · Hollywood, FL
Flood risk 3/10 · Minor
- FEMA flood zone
- X (shaded)
- Chance of flooding over 30 yrs
- 0.12%
- Est. flood insurance / yr
- $507 – $1,088
Fire risk 1/10 · Minimal
- Est. fire insurance / yr
- $947 – $1,759
Heat risk 10/10 · Severe
- Hot days now (above 105°F)
- 7 days/yr
- Hot days in 30 yrs
- 27 days/yr
Wind risk 10/10 · Severe
- Chance of severe wind over 30 yrs
- 99.0%
Air-quality risk 2/10 · Minimal
- Unhealthy air days now
- 2 days/yr
- Unhealthy air days in 30 yrs
- 2 days/yr
Risk factors via First Street. Map © Google.
Why this score? — see what drove the F grade
The composite is a weighted blend of 9 inputs, each scored 0–100. Each bar is that input's sub-score; the figure is the points it added to the 100-point composite (weight × sub-score).
- ARV discount +7.5/15.0
- Cash flow +5.7/30.0
- Schools +4.1/10.0
- Livability +3.8/5.0
- Rent growth +2.6/5.0
- Condition / age +2.5/5.0
- 1% rule +1.1/10.0
- DSCR +0.1/10.0
- Appreciation +0.0/10.0
$469,999
🖨 Deal sheet (PDF) 📄 Offer letter ✓ Due diligence
Multi-family units
County records classify this as Multi-Family (2-4 Unit). Listing-text estimate: 2 units. confirmed
Listing remarks
Best Priced Duplex in all of Hollywood. This property features two equal 1-bed/1-bath units, each offering strong rental appeal and flexibility for both short-term or long-term tenants. With ample parking, a huge yard, and split electrical meters, it’s perfectly set up for reliable, low-maintenance income. The oversized lot also offers exciting potential to enclose and add privacy to the property with fencing and utilize the space for RV parking or additional building or income opportunities/add ROI. You can live in one unit and rent the other, or lease both for maximum return. The property is centrally located and nearby highly-rated schools. Just minutes from Hollywood Beach, Downto
Key facts
- Huge yard
- Rv parking
- Ample parking
Tags
Property features AI
Finance
- Financial info: Two units reported at $2,400/month each and one unit reported at $2,400/month — units are month-to-month; Rent includes water
Exterior
- Parking: Four parking spaces; Other parking available
- Utilities: Cable available; Public sewer
- Home design: Single-story building; DH-3 zoning
- Construction: Block construction; Flat roof; Effective year built
- Exterior features: Less than a quarter acre lot
Interior
- Kitchen: Kitchens in each unit
- Bedrooms: Three 1-bedroom units (two units in Unit Type 1, one unit in Unit Type 2) — units are month-to-month
- Flooring: Vinyl
- Bathrooms: Each unit has 1 full bathroom
- Interior features: Vinyl flooring
- Laundry & utility: Water service included in rent for units
Neighborhood map
What this means for you Summary
Snapshot
- This is a 2 × 1-bed/1.0-bath units multifamily listed at $470k.
Deal economics
- At list price, monthly cash flow is $-968 ($-12k/yr) — negative. Per door: $-484/mo.
- To cash-flow at today's rent, offer at most $330k (29.8% below list).
- To meet the 1% rule (rent ≥ 1% of price), the offer needs to be $289k (38.6% below list).
- Recommended offer: $289k (38.6% below list) — sets the bar for 1% rule.
Location & tenants
- Location reads 76/100 on livability (#232 in FL, #3,548 nationally) — a middle-class / working-renter tenant base. Strengths: commute A+, housing A+, crime B+; Watch: amenities D.
- Broward (suburban): math 42% / reading 53% proficiency, ranked #46 of 73 in FL (top 63%) — families likely to look elsewhere, expect single-tenant / working-renter base with shorter leases.
- Zoned schools: Nova Blanche Forman Elementary (math 35% / reading 55%, grade D-, #1,271 of 2,144 statewide, top 60%, 769 students, 72% FRL); Nova Middle School (math 44% / reading 53%, grade C-, #274 of 571 statewide, top 50%, 1,284 students, 68% FRL); South Broward High School (math 24% / reading 49%, grade F, #351 of 667 statewide, top 54%, 2,397 students, 59% FRL).
- Market conditions: Rents flat; 591 active listings in the ZIP; 2,111 units permitted in Broward County in 2024 (1,265 in 5+ unit buildings).
- At $2,886/mo this rent would consume 61% of the median local household income ($56k/yr) (locally 3948% of renters already pay >50% of income on rent) — very limited rent-growth headroom before tenants either downsize or default.
Forward outlook
- Local home prices are declining (-3.0%/yr); year-one equity from $3k of loan paydown is wiped out by about $14k of value loss. Plan a longer hold.
- Broward County population projected at +34% by 2050 — long-run rental-demand tailwind backs the buy-and-hold thesis.
Negotiation context
- It's been on market 202 days — a 12% lower offer ($414k) is reasonable based on typical stale-listing flexibility.
Risks & watch-outs
- Watch-outs: built in 1938 — expect roof / HVAC / electrical / plumbing capex.
- Climate carrying-cost: severe wind risk, 99% chance of damaging wind over 30y; extreme-heat days projected 7→27/yr by 2055 (HVAC capex compounding) — expect insurance premiums to compound above CPI over the hold.
Questions for the listing agent
- What do current leases actually rent for vs. the listed asking? Can we see a recent rent roll and the last 12 months of T-12 income?
- It's been on market 202 days. Have you received any prior offers? Is the seller open to a 39% concession, seller financing, or rate buy-down credit?
- Can we see the unit-by-unit rent roll, current vacancy, and any below-market leases? What's the average tenancy length?
- What capital expenditures (roof, boiler, parking lot, exteriors) have been made in the last 5 years, and what's planned in the next 2?
- Built in 1938 — when were the roof, HVAC, electrical panel, plumbing, and water heater last replaced?
- Why hasn't it sold? Are there any deal-killer items the seller is aware of (foundation, flood, title, zoning, code violations)?
- Is there a deadline driving the sale (1031 exchange, divorce, estate, relocation)? That informs how much negotiation room exists.
- The area grade is low — what's the realistic commute time and amenity access for the typical tenant pool here? Any planned neighborhood developments (good or bad) we should know about?
- What's the average days-on-market for RENTAL listings here right now (not sales)? A rising rental-DOM trend means longer vacancies and softer asking-rent achievability than the comps imply.
- What's the recent tenant-quality profile in this submarket — average credit score on applications, eviction rate, late-payment / NSF rate, and stable-employment percentage? A property-management company in the area should have these aggregated.
- How much new apartment / multifamily construction is in the pipeline within 1–3 miles? Heavy new supply (>2% of stock underway) typically softens rents 12–24 months out; light construction supports rent growth.
Investment metrics
- 1% rule
- 0.61% ✗
- Cap rate
- 3.82%
- Cash-on-cash
- -8.83%
- DSCR
- 0.61
- GRM
- 13.6
CMA / ARV
No comps found within radius.
Projected returns pro-forma
-3.0% appreciation · 0.43% rent growth · sell at horizon
- IRR
- -34.8%
- Equity multiple
- -0.10×
- Total profit
- $-145,053
- Equity at exit
- $70,078
- IRR
- -64.5%
- Equity multiple
- -0.78×
- Total profit
- $-233,889
- Equity at exit
- $40,637
Cash invested: $131,600 (down + closing). Projections, not guarantees.
Landlord ↔ Tenant lean methodology
- Overall (STATE)
- 87 Strongly Landlord-Friendly
- State Florida
- 87 Strongly Landlord-Friendly · R+3
- County
- — inherits STATE
- City
- — inherits STATE
ZIP-level market 33020
- Rents YoY
- 0.4%
- Active inventory
- 591
- Price-to-rent
- 27.1×
Monthly cashflow live
- Estimated rent
- $2,886 high interval (Pro) →
- Mortgage (P&I)
- −$2,465
- Tax est. 1.5%
- −$587 /mo · $7,050/yr
- Insurance
- −$196
- HOA
- −$0
- Vacancy / Maint / Mgmt
- −$606
- Net cashflow
- $-968
Break-even live
Sensitivity live
| Price | -10% $-643 | -5% $-806 | +0% $-968 | +5% $-1,131 | +10% $-1,293 |
|---|---|---|---|---|---|
| Rent | -10% $-1,196 | -5% $-1,082 | +0% $-968 | +5% $-854 | +10% $-740 |
| Rate | -1.0pp $-731 | -0.5pp $-849 | base $-968 | +0.5pp $-1,090 | +1.0pp $-1,214 |
2-unit breakdown (identical units grouped — click to expand)
| Units | Beds | Baths | Est. rent |
|---|---|---|---|
| 2× units | 1 | 1 | $2,886 |
| #1 | 1 | 1 | $1,443 |
| #2 | 1 | 1 | $1,443 |
| Total (2 units) | $2,886 | ||
UW: 25.0% down · 7.5% · 30yr · 1.5% tax · 5.0% vac · 8.0% maint · 8.0% mgmt
Financing live
Cash to close
- Down payment
- $117,500
- Closing costs
- $14,100
- Reserves months
- —
- Total cash needed
- —
Loan-product check · same deal, 3 products live
Conventional
25% down · 7.5% · 30yr
- Down + closing
- —
- Monthly P&I
- —
- Monthly cashflow
- —
- DSCR
- —
- Eligible?
- —
Personal DTI + credit; lowest rate.
DSCR
20% down · 8.5% · 30yr
- Down + closing
- —
- Monthly P&I
- —
- Monthly cashflow
- —
- DSCR
- —
- Eligible?
- —
No personal income docs; deal must DSCR.
Hard money
10% down · 12.0% · 12mo
- Down + closing
- —
- Monthly P&I
- —
- Monthly cashflow
- —
- DSCR
- —
- Eligible?
- —
Short-term bridge; refi at stabilization.
Listing history 23 events
-
2026-06-21days on market $469,999 Active 202 DOM
-
2026-06-18days on market $469,999 Active 199 DOM
-
2026-06-17days on market $469,999 Active 198 DOM
-
2026-06-16days on market $469,999 Active 197 DOM
-
2026-06-15days on market $469,999 Active 196 DOM
-
2026-06-13days on market $469,999 Active 194 DOM
-
2026-06-09days on market $469,999 Active 190 DOM
-
2026-06-07days on market $469,999 Active 188 DOM
-
2026-06-04days on market $469,999 Active 185 DOM
-
2026-06-03days on market $469,999 Active 184 DOM
-
2026-06-02days on market $469,999 Active 183 DOM
-
2026-06-01days on market $469,999 Active 182 DOM
-
2026-05-31days on market $469,999 Active 181 DOM
-
2026-05-17price $474,999
-
2026-04-20price $479,999
-
2026-04-14price $489,997
-
2026-03-31price $489,998
-
2026-02-23price $489,999
-
2026-02-10price $499,998
-
2026-01-26price $499,999
-
2026-01-05price $500,000
-
2025-12-15price $515,000
-
2025-12-01$525,000 Active
ⓘ Source: listings_history table (triggers on properties + properties_extension) + one-shot
backfill from property_details.listing_events for pre-trigger history.
Climate risk First Street
- Flood 3/10 Moderate FEMA zone X (shaded) · 12% chance over 30 yrs
- Wildfire 1/10 Low
- Heat 10/10 Extreme 7 d/yr ≥105°F today · 27 d/yr by 30 yrs out
- Wind 10/10 Extreme 99% chance of damaging wind over 30 yrs
- Air quality 2/10 Low 2 unhealthy d/yr today · 2 by 30 yrs out
Nearby sold comps map
Loading sold comps map…
Walkable amenities ~0.75 mi
Loading nearby amenities…
Taxation est. · year 1
- Rental income
- $34,632
- − Mortgage interest
- −$26,327
- − Property taxes
- −$7,050
- − Insurance
- −$2,350
- − Repairs & maintenance
- −$2,771
- − Management
- −$2,771
- − Depreciation
- −$13,673
- Taxable loss
- −$20,309
- Est. tax savings @ 24.0%
- +$4,874
- After-tax cash flow
- $-6,743/yr
For passive investors: Depreciation is non-cash, so a rental often shows a tax loss while cash-flowing — sheltering income. Rental losses are passive: they offset passive income freely, and up to $25,000/yr can offset ordinary (W-2) income if you actively participate and your MAGI is under $100k (phasing out to $0 by $150k); unused losses carry forward. On sale, claimed depreciation is recaptured at up to 25%, and gains may owe capital-gains tax (a 1031 exchange can defer both). Figures are a year-1 estimate at your 24.0% rate — not tax advice; consult a CPA.
Schools (NCES district)
- District
- Broward
- NCES district ID
- 1200180
- Math proficiency
- 42% ▼ -18.00%
- Reading proficiency
- 53% ▼ -5.00%
- Median HH income
- $52,139
- Composite
- 40.88/100
- National rank
- #3621
- State rank
- #46 of 73 in FL
Livability — Hollywood
- Score
- 76/100
- State rank
- #232
- US rank
- #3548
Category grades
Schools grade is shown separately in the Schools card above.
Census & demographics
- Census place
- Hollywood, FL
- County
- Broward County · 1,963,430 people
- City population
- 109,079
- Metro
- Miami-Fort Lauderdale-Pompano Beach, FL
- Population (ZIP)
- 46,322
- Household income
- $56,473
- Rent vs Own
- Severe rent burden
- 3948.0
Population outlook (Broward County) Hauer SSP2
- Today (2025)
- 2,207,033 people
- By 2030
- 2,360,704 · +7.0%
- By 2040
- 2,661,208 · +20.6%
- By 2050
- 2,946,698 · +33.5%
- By 2075
- 3,602,273 · +63.2%
- By 2100
- 3,970,984 · +79.9%
Race, ethnicity, and origin ACS 2023
- Neighborhood character
- Diverse neighborhood (Simpson 0.68)
- Race & ethnicity
- Hispanic / Latino 43% Two or more races 31% White 28% Black 24% Asian 1%
- Hispanic origin (detail)
- Mexican 1% Puerto Rican 4% Cuban 9% Dominican 3% Salvadoran 3%
- Common ancestry
- Hispanic 5% Lithuanian 2% Scotch-Irish 1%
- Foreign-born
- 41% · Canada, Jamaica, Dominican Republic
- Languages at home
- 48% English-only · Spanish 38% French/Haitian/Cajun 6% Russian/Polish/Slavic 2%
Political lean MEDSL · Broward
- 2024 margin
- D (+17.0) · D 58.0% · R 41.0%
- 2008→2024 swing
- -17.8pp toward R · 2008: 34.7pp · 2024: 17.0pp
- All cycles
- 2024: D+17.0 2020: D+29.8 2016: D+35.0 2012: D+34.9 2008: D+34.7
Not yet ingested
- Civics
- —
Market trends
- HPI YoY
- ▼ -406.34%
- Current HPI
- 524.7664
- Rent YoY
- ▲ 0.43%
- Metro
- Miami-Fort Lauderdale-Pompano Beach, FL
- State GDP YoY
- ▲ 3.28%
- F500 in state
- 36
Industry mix (Fortune 500 HQ in FL)
| Industry | F500 HQs | Revenue |
|---|---|---|
| Industrial Technology | 2 | $29B |
|
||
| Insurance | 2 | $17B |
|
||
| Retail | 1 | $60B |
|
||
| Technology Distribution | 1 | $58B |
|
||
| Homebuilding | 1 | $35B |
|
||
| Technology Manufacturing | 1 | $35B |
|
||
Price history
-9.5% since first listed10 events — show timeline
- 2026-05-17 Price Changed $474,999 MARMLS
- 2026-04-20 Price Changed $479,999 MARMLS
- 2026-04-14 Price Changed $489,997 MARMLS
- 2026-03-31 Price Changed $489,998 MARMLS
- 2026-02-23 Price Changed $489,999 MARMLS
- 2026-02-10 Price Changed $499,998 MARMLS
- 2026-01-26 Price Changed $499,999 MARMLS
- 2026-01-05 Price Changed $500,000 MARMLS
- 2025-12-15 Price Changed $515,000 MARMLS
- 2025-12-01 Listed $525,000 MARMLS
Cash-flow waterfall
monthlySold comps — $/sqft
last 12 mo · ≤1 miLoading sold comps…