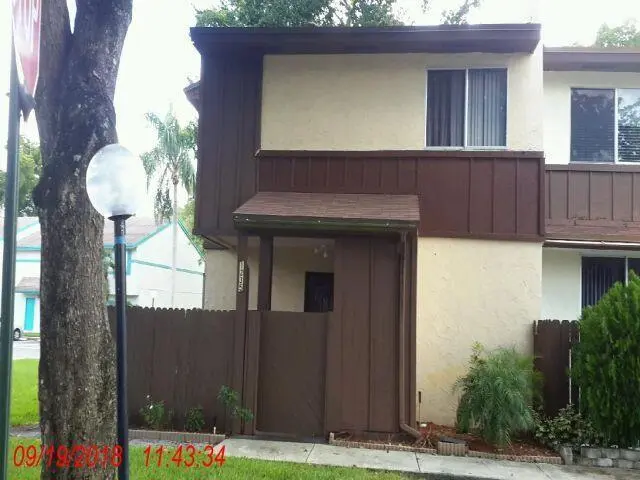
1235 Sussex Dr · North Lauderdale, FL
Flood risk 1/10 · Minimal
- FEMA flood zone
- X (unshaded)
- Chance of flooding over 30 yrs
- 0.0%
- Est. flood insurance / yr
- $507 – $1,088
Fire risk 1/10 · Minimal
- Est. fire insurance / yr
- $947 – $1,759
Heat risk 10/10 · Severe
- Hot days now (above 105°F)
- 7 days/yr
- Hot days in 30 yrs
- 28 days/yr
Wind risk 10/10 · Severe
- Chance of severe wind over 30 yrs
- 99.0%
Air-quality risk 3/10 · Minor
- Unhealthy air days now
- 3 days/yr
- Unhealthy air days in 30 yrs
- 3 days/yr
Risk factors via First Street. Map © Google.
Why this score? — see what drove the D+ grade
The composite is a weighted blend of 9 inputs, each scored 0–100. Each bar is that input's sub-score; the figure is the points it added to the 100-point composite (weight × sub-score).
- ARV discount +15.0/15.0
- Cash flow +12.9/30.0
- Schools +4.1/10.0
- DSCR +3.9/10.0
- Livability +3.8/5.0
- 1% rule +2.9/10.0
- Condition / age +2.5/5.0
- Rent growth +2.3/5.0
- Appreciation +0.0/10.0
$335,900
🖨 Deal sheet (PDF) 📄 Offer letter ✓ Due diligence
Listing remarks MLS
HUD property sold as-is. Info. from sources deemed reliable-not guaranteed, Liens/ Code violations may/may not exist. Buyer to verify & resolve. Evidence of mold may/may not be present. No remediation offered. FHA Eligible w/ a repair escrow of $330
Key facts
- $128 HOA
- 2 parking spots
- Community pool
Property features AI
Finance
- Other: Living area reported as 1,612 (source: other)
- HOA & community: Community association managed by Premier Association Services; HOA fee $128 per month; HOA covers sewer, trash, and pool service; Association allows pets (restrictions possible); No listed association amenities
Exterior
- Parking: Assigned open parking; 2 parking spaces
- Utilities: Public water; Public sewer; Electricity available; Sewer available
- Home design: Condominium; Two stories; Resale condition; Facing west
- Construction: Built with CBS and wood frame; Shingle roof; 2 total stories
- Exterior features: Not waterfront; No waterfront features
Interior
- Kitchen: Electric range; Refrigerator
- Bedrooms: 2 main-level bedrooms
- Flooring: Carpet
- Bathrooms: 2 full bathrooms; 1 half bathroom
- Heating & cooling: Central heating; Central air conditioning
- Interior features: No specified interior features
- Laundry & utility: Electric water heater
Neighborhood map
What this means for you Summary
Snapshot
- This is a 3-bed/2.0-bath single-family listed at $336k.
Deal economics
- At list price, monthly cash flow is $-25 ($-299/yr) — negative.
- To cash-flow at today's rent, offer at most $331k (1.3% below list).
- To meet the 1% rule (rent ≥ 1% of price), the offer needs to be $265k (21.0% below list).
- Recommended offer: $265k (21.0% below list) — sets the bar for 1% rule.
- Cap rate 6.2% vs local median 4.3% in North Lauderdale — top-decile yield for the area; either an underpriced asset or a hidden risk that comps aren't pricing in. Stress-test before assuming the spread holds.
Location & tenants
- Location reads 76/100 on livability (#230 in FL, #3,635 nationally) — a middle-class / working-renter tenant base. Strengths: housing A+, health & safety A+, cost of living A; Watch: commute C-, employment D, amenities F.
- Broward (suburban): math 42% / reading 53% proficiency, ranked #46 of 73 in FL (top 63%) — families likely to look elsewhere, expect single-tenant / working-renter base with shorter leases.
- Zoned schools: North Lauderdale Elementary School (math 24% / reading 30%, grade F, #1,969 of 2,144 statewide, top 94%, 646 students, 82% FRL); Silver Lakes Middle School (math 21% / reading 30%, grade F, #512 of 571 statewide, top 90%, 782 students, 77% FRL); Coconut Creek High School (math 13% / reading 26%, grade F, #562 of 667 statewide, top 85%, 1,892 students, 72% FRL) — zoned schools average 77% FRL vs 51% district-wide (26 pts higher); higher-poverty schools than district average — tighter screening recommended.
- Zoned-school proficiency averages 24% at this address vs 48% district-wide (-24 pts) — the specific schools serving this property underperform the Broward average; the district grade overstates school quality for this exact location.
- Market conditions: Rents soft (-0.7%/yr); 302 active listings in the ZIP; 40 comparable units currently listed for rent nearby; rentals at typical pace (median 27d on market — plan ~3-4 weeks tenant-placement turnaround); 2,111 units permitted in Broward County in 2024 (1,265 in 5+ unit buildings).
- At $2,654/mo this rent would consume 50% of the median local household income ($64k/yr) (locally 3073% of renters already pay >50% of income on rent) — very limited rent-growth headroom before tenants either downsize or default.
Forward outlook
- Local home prices are declining (-3.0%/yr); year-one equity from $2k of loan paydown is wiped out by about $10k of value loss. Plan a longer hold.
- Broward County population projected at +34% by 2050 — long-run rental-demand tailwind backs the buy-and-hold thesis.
Negotiation context
- It's been on market 39 days — a 3% lower offer ($326k) is reasonable based on typical stale-listing flexibility.
- 2 sale attempts since 16y ago with the ask held roughly flat each time — persistent listings suggest the price (not the market) is what's stuck; bring a comps-based counter.
- Current owner paid $53k; list at $336k implies a 534% gain — meaningful room to come down on a strong offer.
Risks & watch-outs
- Climate carrying-cost: severe wind risk, 99% chance of damaging wind over 30y; extreme-heat days projected 7→28/yr by 2055 (HVAC capex compounding) — expect insurance premiums to compound above CPI over the hold.
Questions for the listing agent
- What do current leases actually rent for vs. the listed asking? Can we see a recent rent roll and the last 12 months of T-12 income?
- It's been on market 39 days. Have you received any prior offers? Is the seller open to a 21% concession, seller financing, or rate buy-down credit?
- What does the HOA fee cover, when was the last increase, and are there any pending special assessments or reserve-fund shortfalls?
- Is there a deadline driving the sale (1031 exchange, divorce, estate, relocation)? That informs how much negotiation room exists.
- The area grade is low — what's the realistic commute time and amenity access for the typical tenant pool here? Any planned neighborhood developments (good or bad) we should know about?
- What's the average days-on-market for RENTAL listings here right now (not sales)? A rising rental-DOM trend means longer vacancies and softer asking-rent achievability than the comps imply.
- What's the recent tenant-quality profile in this submarket — average credit score on applications, eviction rate, late-payment / NSF rate, and stable-employment percentage? A property-management company in the area should have these aggregated.
- How much new for-sale + rental construction is in the pipeline within 1–3 miles? Heavy new supply typically softens prices + rents 12–24 months out; constrained supply supports both.
Investment metrics
- 1% rule
- 0.79% ✗
- Cap rate
- 6.20%
- Cash-on-cash
- -0.32%
- DSCR
- 0.99
- GRM
- 10.5
CMA / ARV
- ARV (on-the-fly)
- $425,568
- Comps found
- 5
Show comp detail 5 sales within ~0.75 mi
| Address | Dist | Beds/Ba | Sqft | Sold | Price | $/sf | Match |
|---|---|---|---|---|---|---|---|
| 7610 NW 66th Ter | 0.64mi | 2/2.0 (-1) | 1,647 (+2%) | 2mo | $435,000 | $264 | 60 |
| 6702 NW 71st St | 0.68mi | 2/2.0 (-1) | 1,587 (-2%) | 12mo | $350,000 | $221 | 51 |
| 1105 SW 74th Ave | 0.54mi | 3/2.0 | 1,560 (-3%) | 23mo | $460,000 | $295 | 50 |
| 1213 SW 82nd Ave | 0.44mi | 4/3.0 (+1) | 1,450 (-10%) | 7mo | $505,000 | $348 | 48 |
| 603 SW 76th Ter | 0.67mi | 3/3.0 | 1,784 (+11%) | 24mo | $465,000 | $261 | 27 |
Match score weights: distance 35% · size 25% · config 20% · recency 20%. Top-matched comps best support the ARV.
Projected returns pro-forma
-3.0% appreciation · 0.0% rent growth · sell at horizon
- IRR
- -20.0%
- Equity multiple
- 0.32×
- Total profit
- $-63,881
- Equity at exit
- $50,084
- IRR
- -20.4%
- Equity multiple
- 0.06×
- Total profit
- $-88,068
- Equity at exit
- $29,042
Cash invested: $94,052 (down + closing). Projections, not guarantees.
Landlord ↔ Tenant lean methodology
- Overall (STATE)
- 87 Strongly Landlord-Friendly
- State Florida
- 87 Strongly Landlord-Friendly · R+3
- County
- — inherits STATE
- City
- — inherits STATE
ZIP-level market 33068
- Rents YoY
- -0.7%
- Active inventory
- 302
- Price-to-rent
- 10.5×
Monthly cashflow live
- Estimated rent
- $2,654 high interval (Pro) →
- Mortgage (P&I)
- −$1,761
- Tax from tax record
- −$92 /mo · $1,107/yr
- Insurance
- −$140
- HOA
- −$128
- Lot rent
- −$0
- Vacancy / Maint / Mgmt
- −$557
- Net cashflow
- $-25
Break-even live
Sensitivity live
| Price | -10% $165 | -5% $70 | +0% $-25 | +5% $-120 | +10% $-215 |
|---|---|---|---|---|---|
| Rent | -10% $-235 | -5% $-130 | +0% $-25 | +5% $80 | +10% $185 |
| Rate | -1.0pp $144 | -0.5pp $60 | base $-25 | +0.5pp $-112 | +1.0pp $-201 |
UW: 25.0% down · 7.5% · 30yr · 1.5% tax · 5.0% vac · 8.0% maint · 8.0% mgmt
Financing live
Cash to close
- Down payment
- $83,975
- Closing costs
- $10,077
- Reserves months
- —
- Total cash needed
- —
Loan-product check · same deal, 3 products live
Conventional
25% down · 7.5% · 30yr
- Down + closing
- —
- Monthly P&I
- —
- Monthly cashflow
- —
- DSCR
- —
- Eligible?
- —
Personal DTI + credit; lowest rate.
DSCR
20% down · 8.5% · 30yr
- Down + closing
- —
- Monthly P&I
- —
- Monthly cashflow
- —
- DSCR
- —
- Eligible?
- —
No personal income docs; deal must DSCR.
Hard money
10% down · 12.0% · 12mo
- Down + closing
- —
- Monthly P&I
- —
- Monthly cashflow
- —
- DSCR
- —
- Eligible?
- —
Short-term bridge; refi at stabilization.
Rent comps 40 comps
| Address | Beds | Baths | Sqft | Rent | $/sqft | DOM | Units | Dist |
|---|---|---|---|---|---|---|---|---|
| 1177 Sussex Dr North Lauderdale, FL | 2.0 | 1.0 | 1236 | $2,370 | $1.92 | 26d | 1 | 0.03mi |
| 1349 Sussex Dr #1349 North Lauderdale, FL | 2.0 | 2.5 | 1350 | $2,250 | $1.67 | 1d | 1 | 0.10mi |
| 1233 Hampton Blvd North Lauderdale, FL | 3.0 | 2.5 | 1612 | $2,750 | $1.71 | 26d | 1 | 0.10mi |
| 7575 Hampton Blvd North Lauderdale, FL | 1.0–2.0 | 1.0–2.0 | 900 | $2,205 | $2.45 | 1d | 6 | 0.13mi |
| 1359 Avon Ln North Lauderdale, FL | 3.0 | 2.5 | 1632 | $3,300 | $2.02 | 26d | 1 | 0.17mi |
| 7900 Hampton Blvd North Lauderdale, FL | 1.0–2.0 | 1.0–2.0 | 925 | $2,413 | $2.61 | 0d | 32 | 0.21mi |
| 7731 SW 10th Ct Unit 4 North Lauderdale, FL | 3.0 | 1.0 | 1200 | $2,500 | $2.08 | 19d | 1 | 0.22mi |
| 7721 SW 10th Ct Unit B North Lauderdale, FL | 3.0 | 1.0 | 1050 | $1,950 | $1.86 | 26d | 1 | 0.22mi |
| 7701 SW 10th Ct Unit 1A North Lauderdale, FL | 3.0 | 1.0 | 1060 | $2,350 | $2.22 | 16d | 1 | 0.23mi |
| 8030 Hampton Blvd #414 North Lauderdale, FL | 2.0 | 2.0 | 1350 | $1,950 | $1.44 | 26d | 1 | 0.30mi |
| 8040 Hampton Blvd #508 North Lauderdale, FL | 2.0 | 2.0 | 1350 | $2,300 | $1.70 | 26d | 1 | 0.31mi |
| 1400 Avon Ln North Lauderdale, FL | 1.0–3.0 | 1.0–2.0 | 1070 | $2,873 | $2.69 | 1d | 60 | 0.33mi |
| 7926 Kimberly Blvd #202 North Lauderdale, FL | 2.0 | 1.5 | 1108 | $2,300 | $2.08 | 0d | 1 | 0.36mi |
| 7603 Kimberly Blvd North Lauderdale, FL | 3.0 | 2.0 | 1145 | $2,875 | $2.51 | 26d | 1 | 0.37mi |
| 7480 SW 10th Ct #1 North Lauderdale, FL | 3.0 | 2.0 | 1200 | $3,249 | $2.71 | 26d | 1 | 0.41mi |
| 7906 SW 8th St North Lauderdale, FL | 3.0 | 2.5 | 1440 | $3,500 | $2.43 | 7d | 1 | 0.48mi |
| 1317 SW 82nd Ave North Lauderdale, FL | 3.0 | 2.0 | 1566 | $3,500 | $2.23 | 26d | 1 | 0.48mi |
| 1507 Belmont Ln #1507 North Lauderdale, FL | 3.0 | 2.0 | 1553 | $2,300 | $1.48 | 26d | 1 | 0.50mi |
| 1507 Belmont Ln #1507 North Lauderdale, FL | 3.0 | 2.0 | 1553 | $2,300 | $1.48 | 23d | 1 | 0.50mi |
| 2303 Belmont Ln #2303 North Lauderdale, FL | 2.0 | 2.0 | 1154 | $1,900 | $1.65 | 26d | 1 | 0.50mi |
| 2008 Belmont Ln #2008 North Lauderdale, FL | 3.0 | 2.0 | 1480 | $2,400 | $1.62 | 26d | 1 | 0.50mi |
| 1307 Belmont Ln #1307 North Lauderdale, FL | 3.0 | 2.0 | 1480 | $2,350 | $1.59 | 26d | 1 | 0.50mi |
| 2707 Belmont Ln Unit 1 North Lauderdale, FL | 3.0 | 2.0 | 1553 | $2,250 | $1.45 | 26d | 1 | 0.50mi |
| 881 SW 74th Ter Unit 102C North Lauderdale, FL | 3.0 | 2.0 | 1150 | $2,200 | $1.91 | 26d | 1 | 0.50mi |
| 1213 SW 74th Ave North Lauderdale, FL | 4.0 | 2.0 | 1150 | $4,100 | $3.57 | 26d | 1 | 0.51mi |
| 861 SW 74th Ter Unit 102D North Lauderdale, FL | 3.0 | 2.0 | 1150 | $2,100 | $1.83 | 26d | 1 | 0.51mi |
| 861 SW 74th Ter Unit 102D North Lauderdale, FL | 3.0 | 2.0 | 1150 | $2,100 | $1.83 | 1d | 1 | 0.51mi |
| 7816 SW 7th Pl North Lauderdale, FL | 3.0 | 2.0 | 1620 | $3,500 | $2.16 | 26d | 1 | 0.52mi |
| 1001 SW 74th Ave Unit 201a North Lauderdale, FL | 3.0 | 2.0 | 1150 | $2,650 | $2.30 | 7d | 1 | 0.53mi |
| 7400 Kimberly Blvd Unit 202A North Lauderdale, FL | 3.0 | 2.0 | 1150 | $2,800 | $2.43 | 10d | 1 | 0.53mi |
| 7400 Kimberly Blvd Unit 202A North Lauderdale, FL | 3.0 | 2.0 | 1150 | $2,300 | $2.00 | 1d | 1 | 0.53mi |
| 7336 SW 8th Ct #6 North Lauderdale, FL | 2.0 | 2.0 | 1056 | $2,100 | $1.99 | 26d | 1 | 0.55mi |
| 7931 SW 7th Pl #7931 North Lauderdale, FL | 4.0 | 2.5 | 1620 | $3,300 | $2.04 | 16d | 1 | 0.58mi |
| 7931 SW 7th Pl North Lauderdale, FL | 4.0 | 2.5 | 1620 | $3,300 | $2.04 | 17d | 1 | 0.58mi |
| 7931 SW 7th Pl North Lauderdale, FL | 4.0 | 2.5 | 1620 | $3,300 | $2.04 | 19d | 1 | 0.58mi |
| 7966 SW 7th Ct North Lauderdale, FL | 4.0 | 2.5 | 1709 | $3,100 | $1.81 | 7d | 1 | 0.62mi |
| 1726 SW 81st Ter Unit 1726 North Lauderdale, FL | 3.0 | 2.5 | 1404 | $2,900 | $2.07 | 26d | 1 | 0.63mi |
| 709 SW 79th Ter North Lauderdale, FL | 2.0 | 2.0 | 1152 | $2,950 | $2.56 | 26d | 1 | 0.64mi |
| 1721 SW 81st Ter North Lauderdale, FL | 3.0 | 2.5 | 1404 | $2,750 | $1.96 | 10d | 1 | 0.64mi |
| 7516 NW 67th Ave Tamarac, FL | 3.0 | 2.0 | 1647 | $2,850 | $1.73 | 26d | 1 | 0.67mi |
HOA detail
- Monthly dues
- $128 · $1,536/yr
Listing history 21 events
-
2026-06-22days on market $335,900 Active 39 DOM
-
2026-06-21days on market $335,900 Active 38 DOM
-
2026-06-18days on market $335,900 Active 35 DOM
-
2026-06-17days on market $335,900 Active 34 DOM
-
2026-06-16days on market $335,900 Active 33 DOM
-
2026-06-15days on market $335,900 Active 32 DOM
-
2026-06-13days on market $335,900 Active 30 DOM
-
2026-06-09days on market $335,900 Active 26 DOM
-
2026-06-08days on market $335,900 Active 25 DOM
-
2026-06-07days on market $335,900 Active 24 DOM
-
2026-06-04days on market $335,900 Active 21 DOM
-
2026-06-03days on market $335,900 Active 20 DOM
-
2026-06-02days on market $335,900 Active 19 DOM
-
2026-06-01days on market $335,900 Active 18 DOM
-
2026-05-31days on market $335,900 Active 17 DOM
-
2026-05-14$335,900 Active
-
2010-08-02soldstatus $52,999 254-char remark
Show marketing remark (254 chars)
HUD property sold as-is. Info. from sources deemed reliable-not guaranteed, Liens/ Code violations may/may not exist. Buyer to verify & resolve. Evidence of mold may/may not be present. No remediation offered. FHA Eligible w/ a repair escrow of $330
-
2010-04-07historical 254-char remark
Show marketing remark (254 chars)
HUD property sold as-is. Info. from sources deemed reliable-not guaranteed, Liens/ Code violations may/may not exist. Buyer to verify & resolve. Evidence of mold may/may not be present. No remediation offered. FHA Eligible w/ a repair escrow of $330
-
2010-04-02$45,000 254-char remark
Show marketing remark (254 chars)
HUD property sold as-is. Info. from sources deemed reliable-not guaranteed, Liens/ Code violations may/may not exist. Buyer to verify & resolve. Evidence of mold may/may not be present. No remediation offered. FHA Eligible w/ a repair escrow of $330
-
2004-01-08soldstatus $129,000
-
1984-12-01soldstatus $66,000
ⓘ Source: listings_history table (triggers on properties + properties_extension) + one-shot
backfill from property_details.listing_events for pre-trigger history.
Tax reassessment forecast FL · Resets to sale price
- Current annual tax
- $1,107 · $92/mo
- Projected year-2 tax
- $2,788 · $232/mo
- Expected delta
- +$1,681/yr (+$140/mo · 151.7%)
ⓘ Screening estimate from a state-policy table — verify with the county assessor before closing.
Climate risk First Street
- Flood 1/10 Low FEMA zone X (unshaded) · 0% chance over 30 yrs
- Wildfire 1/10 Low
- Heat 10/10 Extreme 7 d/yr ≥105°F today · 28 d/yr by 30 yrs out
- Wind 10/10 Extreme 99% chance of damaging wind over 30 yrs
- Air quality 3/10 Moderate 3 unhealthy d/yr today · 3 by 30 yrs out
Nearby sold comps map
Loading sold comps map…
Walkable amenities ~0.75 mi
Loading nearby amenities…
Taxation est. · year 1
- Rental income
- $31,850
- − Mortgage interest
- −$18,816
- − Property taxes
- −$1,107
- − Insurance
- −$1,680
- − Repairs & maintenance
- −$2,548
- − Management
- −$2,548
- − HOA
- −$1,536
- − Depreciation
- −$9,772
- Taxable loss
- −$6,156
- Est. tax savings @ 24.0%
- +$1,478
- After-tax cash flow
- $1,178/yr
For passive investors: Depreciation is non-cash, so a rental often shows a tax loss while cash-flowing — sheltering income. Rental losses are passive: they offset passive income freely, and up to $25,000/yr can offset ordinary (W-2) income if you actively participate and your MAGI is under $100k (phasing out to $0 by $150k); unused losses carry forward. On sale, claimed depreciation is recaptured at up to 25%, and gains may owe capital-gains tax (a 1031 exchange can defer both). Figures are a year-1 estimate at your 24.0% rate — not tax advice; consult a CPA.
Schools (NCES district)
- District
- Broward
- NCES district ID
- 1200180
- Math proficiency
- 42% ▼ -18.00%
- Reading proficiency
- 53% ▼ -5.00%
- Median HH income
- $52,139
- Composite
- 40.88/100
- National rank
- #3621
- State rank
- #46 of 73 in FL
Livability — North Lauderdale
- Score
- 76/100
- State rank
- #230
- US rank
- #3635
Category grades
Schools grade is shown separately in the Schools card above.
Census & demographics
- Census place
- North Lauderdale, FL
- County
- Broward County · 1,963,430 people
- City population
- 54,439
- Metro
- Miami-Fort Lauderdale-Pompano Beach, FL
- Population (ZIP)
- 54,439
- Household income
- $64,051
- Rent vs Own
- Severe rent burden
- 3073.0
Population outlook (Broward County) Hauer SSP2
- Today (2025)
- 2,207,033 people
- By 2030
- 2,360,704 · +7.0%
- By 2040
- 2,661,208 · +20.6%
- By 2050
- 2,946,698 · +33.5%
- By 2075
- 3,602,273 · +63.2%
- By 2100
- 3,970,984 · +79.9%
Race, ethnicity, and origin ACS 2023
- Neighborhood character
- Diverse neighborhood (Simpson 0.61)
- Race & ethnicity
- Black 58% Hispanic / Latino 21% Two or more races 13% White 11% Asian 4%
- Hispanic origin (detail)
- Mexican 3% Puerto Rican 4% Cuban 1% Dominican 3%
- Common ancestry
- Hispanic 17% Estonian 1% Lithuanian 1%
- Foreign-born
- 47% · Canada, Jamaica, Vietnam
- Languages at home
- 59% English-only · Spanish 19% French/Haitian/Cajun 15% Other Indo-European 2%
Political lean MEDSL · Broward
- 2024 margin
- D (+17.0) · D 58.0% · R 41.0%
- 2008→2024 swing
- -17.8pp toward R · 2008: 34.7pp · 2024: 17.0pp
- All cycles
- 2024: D+17.0 2020: D+29.8 2016: D+35.0 2012: D+34.9 2008: D+34.7
Not yet ingested
- Civics
- —
Market trends
- HPI YoY
- ▼ -317.60%
- Current HPI
- 426.2972
- Rent YoY
- ▼ -0.74%
- Metro
- Miami-Fort Lauderdale-Pompano Beach, FL
- State GDP YoY
- ▲ 3.28%
- F500 in state
- 36
Industry mix (Fortune 500 HQ in FL)
| Industry | F500 HQs | Revenue |
|---|---|---|
| Industrial Technology | 2 | $29B |
|
||
| Insurance | 2 | $17B |
|
||
| Retail | 1 | $60B |
|
||
| Technology Distribution | 1 | $58B |
|
||
| Homebuilding | 1 | $35B |
|
||
| Technology Manufacturing | 1 | $35B |
|
||
Price history
+408.9% since first listed6 events — show timeline
- 2026-05-14 Listed $335,900 Beaches MLS
- 2010-08-02 Sold (MLS) $52,999 Beaches MLS
- 2010-04-07 Listing Removed — Beaches MLS
- 2010-04-02 Listed $45,000 Beaches MLS
- 2004-01-08 Sold (Public Records) $129,000 Public Records
- 1984-12-01 Sold (Public Records) $66,000 Public Records
Property tax history
+1.9%/yrLatest (2025): $1,107 · +1.4% YoY. Source: county tax records.
Cash-flow waterfall
monthlySold comps — $/sqft
last 12 mo · ≤1 miLoading sold comps…