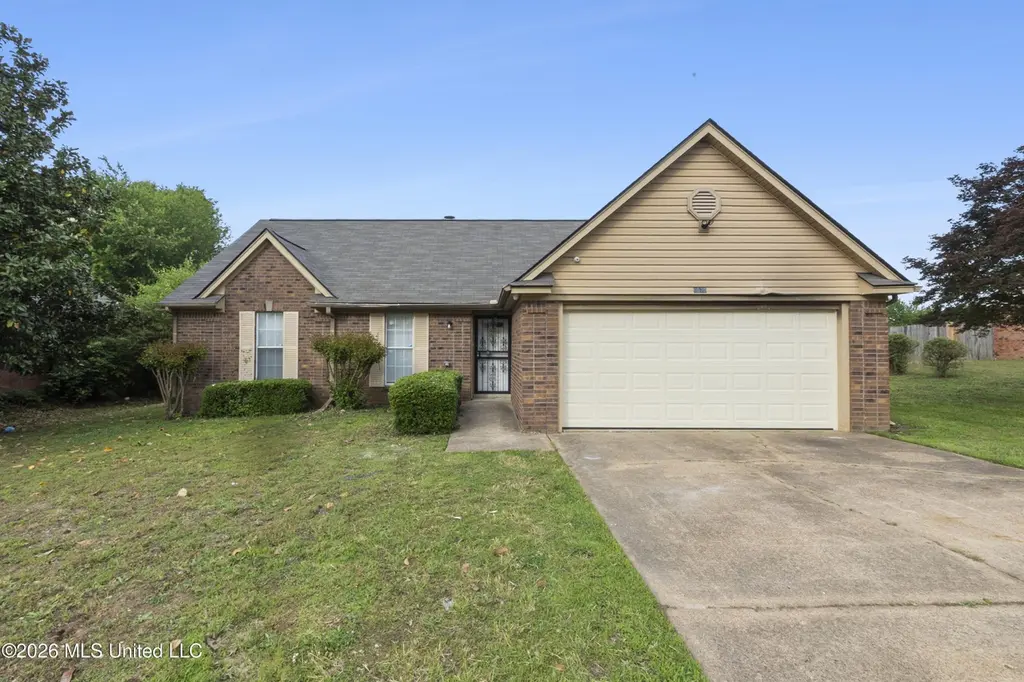
6570 Westbury Ave · Horn Lake, MS
Flood risk 1/10 · Minimal
- FEMA flood zone
- X (unshaded)
- Chance of flooding over 30 yrs
- 0.0%
- Est. flood insurance / yr
- $507 – $1,088
Fire risk 4/10 · Minor
- Est. fire insurance / yr
- $1,241 – $2,305
Heat risk 6/10 · Moderate
- Hot days now (above 109°F)
- 7 days/yr
- Hot days in 30 yrs
- 22 days/yr
Wind risk 4/10 · Minor
- Chance of severe wind over 30 yrs
- 18.0%
Air-quality risk 2/10 · Minimal
- Unhealthy air days now
- 2 days/yr
- Unhealthy air days in 30 yrs
- 2 days/yr
Risk factors via First Street. Map © Google.
Why this score? — see what drove the D grade
The composite is a weighted blend of 9 inputs, each scored 0–100. Each bar is that input's sub-score; the figure is the points it added to the 100-point composite (weight × sub-score).
- Cash flow +15.1/30.0
- ARV discount +8.1/15.0
- DSCR +4.6/10.0
- Schools +4.0/10.0
- 1% rule +3.3/10.0
- Livability +3.1/5.0
- Condition / age +2.5/5.0
- Rent growth +2.3/5.0
- Appreciation +0.0/10.0
$200,000
🖨 Deal sheet (PDF) 📄 Offer letter ✓ Due diligence
Listing remarks
Located in the heart of Horn Lake, Mississippi this beautifully remodeled 3-bedroom, 2-bath home is the perfect blend of comfort and modern style. From the moment you walk in, you'll notice the fresh updates and inviting atmosphere that make this home truly move-in ready. Featuring updated finishes, fresh paint , new roof , spacious living areas, and a functional layout designed for everyday living, this home is ideal for first-time buyers, or anyone looking for a like- new fresh start. Conveniently located near shopping, dining ( Chic fil A , Chipotle & Walmart to name a few), schools, and major highways, 6750 Westbury Avenue offers both comfort and convenience at an incredible v
Key facts
- Remodeled
- Updated finishes
- Fresh paint
Tags
Property features AI
Finance
- Other:
- Financial info:
- HOA & community:
Exterior
- Parking: 2-car garage; Driveway; Garage with automatic door opener and front-facing garage
- Security:
- Utilities: Public water; Public sewer; Natural gas connected; Water and sewer connected
- Home design: Single-family residence, one story; House with updated/remodeled condition; Living area reported as 1,320 (public records)
- Construction: Brick veneer and siding exterior; Slab foundation
- Exterior features: Architectural shingle roof; Lot approximately 0.3 acres
Interior
- Kitchen: Dishwasher
- Bedrooms:
- Flooring:
- Bathrooms: 2 full bathrooms
- Heating & cooling: Central heating (natural gas); Central air conditioning
- Interior features: Den fireplace
- Laundry & utility:
Neighborhood map
What this means for you Summary
Snapshot
- This is a 3-bed/2.0-bath single-family listed at $200k.
Deal economics
- At list price, monthly cash flow is $67 ($799/yr) — positive.
- The deal already cash-flows at list — no discount required.
- To meet the 1% rule (rent ≥ 1% of price), the offer needs to be $166k (16.8% below list).
- Recommended offer: $166k (16.8% below list) — sets the bar for 1% rule.
Location & tenants
- Location reads 61/100 on livability (#196 in MS) — a middle-class / working-renter tenant base. Strengths: cost of living A+, housing A+, crime A; Watch: employment D, amenities F, commute F.
- Desoto County School District (suburban): math 48% / reading 42% proficiency, ranked #20 of 130 in MS (top 15%) — families likely to look elsewhere, expect single-tenant / working-renter base with shorter leases.
- Zoned schools: Shadow Oaks Elementary School (459 students, 99% FRL); Horn Lake Middle School (math 37% / reading 21%, grade F, #90 of 179 statewide, top 52%, 1,021 students, 100% FRL); Horn Lake High (math 28% / reading 30%, grade F, #98 of 197 statewide, top 49%, 1,361 students, 100% FRL) — zoned schools average 100% FRL vs 43% district-wide (56 pts higher); higher-poverty schools than district average — tighter screening recommended.
- Zoned-school proficiency averages 29% at this address vs 45% district-wide (-16 pts) — the specific schools serving this property underperform the Desoto County School District average; the district grade overstates school quality for this exact location.
- Market conditions: Rents soft (-0.7%/yr); 98 active listings in the ZIP; 40 comparable units currently listed for rent nearby; rentals at typical pace (median 23d on market — plan ~3-4 weeks tenant-placement turnaround); 1,155 units permitted in DeSoto County in 2024 (0 in 5+ unit buildings).
- This rent runs 37% of the median local income ($53k/yr) — at the standard rent-burdened threshold; future hikes will face affordability resistance.
Forward outlook
- Local home prices are declining (-3.0%/yr); year-one equity from $1k of loan paydown is wiped out by about $6k of value loss. Plan a longer hold.
- DeSoto County population projected at +33% by 2050 — long-run rental-demand tailwind backs the buy-and-hold thesis.
Negotiation context
- Only 2 days on market — expect competitive offers; lowballing is unlikely to land.
Risks & watch-outs
- Climate carrying-cost: extreme-heat days projected 7→22/yr by 2055 (HVAC capex compounding) — expect insurance premiums to compound above CPI over the hold.
Questions for the listing agent
- Is there a deadline driving the sale (1031 exchange, divorce, estate, relocation)? That informs how much negotiation room exists.
- Schools are F-rated, which usually means shorter tenancies and higher turnover. Who's the typical renter profile here, and what's been the actual vacancy rate?
- The area grade is low — what's the realistic commute time and amenity access for the typical tenant pool here? Any planned neighborhood developments (good or bad) we should know about?
- What's the average days-on-market for RENTAL listings here right now (not sales)? A rising rental-DOM trend means longer vacancies and softer asking-rent achievability than the comps imply.
- What's the recent tenant-quality profile in this submarket — average credit score on applications, eviction rate, late-payment / NSF rate, and stable-employment percentage? A property-management company in the area should have these aggregated.
- How much new for-sale + rental construction is in the pipeline within 1–3 miles? Heavy new supply typically softens prices + rents 12–24 months out; constrained supply supports both.
Investment metrics
- 1% rule
- 0.83% ✗
- Cap rate
- 6.69%
- Cash-on-cash
- 1.43%
- DSCR
- 1.06
- GRM
- 10.0
CMA / ARV
- ARV (median comp)
- $202,574
- List price
- $200,000
- Delta
- -1.27%
- Verdict
- FAIR
- Comps
- 20 within 1.0 mi
Show comp detail 12 sales within ~0.75 mi
| Address | Dist | Beds/Ba | Sqft | Sold | Price | $/sf | Match |
|---|---|---|---|---|---|---|---|
| 6570 Westbury Ave | 0.00mi | 3/2.0 | 1,320 (0%) | 0mo | $200,000 | $152 | 100 |
| 6395 Kensington Rd | 0.18mi | 3/2.0 | 1,322 (+0%) | 1mo | $242,000 | $183 | 91 |
| 3410 Dorchester Cv | 0.44mi | 3/2.0 | 1,351 (+2%) | 1mo | $95,500 | $71 | 75 |
| 6795 Dunbarton Dr | 0.32mi | 3/2.0 | 1,260 (-4%) | 4mo | $208,000 | $165 | 74 |
| 3810 Union Ave | 0.63mi | 3/2.0 | 1,308 (-1%) | 2mo | $235,000 | $180 | 68 |
| 3405 Woodbine Cv | 0.47mi | 3/2.0 | 1,246 (-6%) | 4mo | $194,900 | $156 | 66 |
| 3350 W Tulane Rd | 0.58mi | 3/2.0 | 1,357 (+3%) | 4mo | $175,000 | $129 | 65 |
| 4039 Shadow Glen Dr | 0.28mi | 3/2.0 | 1,492 (+13%) | 2mo | $214,900 | $144 | 64 |
| 6325 Collinwood Rd | 0.34mi | 3/2.0 | 1,162 (-12%) | 2mo | $202,000 | $174 | 63 |
| 4511 Shadow Hollow Dr | 0.60mi | 3/2.0 | 1,250 (-5%) | 1mo | $225,000 | $180 | 62 |
| 3783 Conrail Cir | 0.72mi | 3/2.0 | 1,377 (+4%) | 2mo | $240,000 | $174 | 57 |
| 7251 Durango Dr | 0.70mi | 3/2.0 | 1,471 (+11%) | 6mo | $245,000 | $167 | 43 |
Match score weights: distance 35% · size 25% · config 20% · recency 20%. Top-matched comps best support the ARV.
Projected returns pro-forma
-3.0% appreciation · 0.0% rent growth · sell at horizon
- IRR
- -17.2%
- Equity multiple
- 0.41×
- Total profit
- $-33,102
- Equity at exit
- $29,821
- IRR
- -15.3%
- Equity multiple
- 0.24×
- Total profit
- $-42,438
- Equity at exit
- $17,292
Cash invested: $56,000 (down + closing). Projections, not guarantees.
Landlord ↔ Tenant lean methodology
- Overall (STATE)
- 90 Strongly Landlord-Friendly
- State Mississippi
- 90 Strongly Landlord-Friendly · R+11
- County
- — inherits STATE
- City
- — inherits STATE
ZIP-level market 38637
- Home prices YoY
- -13.4%
- Rents YoY
- -0.7%
- Active inventory
- 98
- Price-to-rent
- 10.0×
Monthly cashflow live
- Estimated rent
- $1,663 high interval (Pro) →
- Mortgage (P&I)
- −$1,049
- Tax from tax record
- −$115 /mo · $1,384/yr
- Insurance
- −$83
- HOA
- −$0
- Vacancy / Maint / Mgmt
- −$349
- Net cashflow
- $67
Break-even live
Sensitivity live
| Price | -10% $180 | -5% $123 | +0% $67 | +5% $10 | +10% $-47 |
|---|---|---|---|---|---|
| Rent | -10% $-65 | -5% $1 | +0% $67 | +5% $132 | +10% $198 |
| Rate | -1.0pp $167 | -0.5pp $117 | base $67 | +0.5pp $15 | +1.0pp $-38 |
UW: 25.0% down · 7.5% · 30yr · 1.5% tax · 5.0% vac · 8.0% maint · 8.0% mgmt
Financing live
Cash to close
- Down payment
- $50,000
- Closing costs
- $6,000
- Reserves months
- —
- Total cash needed
- —
Loan-product check · same deal, 3 products live
Conventional
25% down · 7.5% · 30yr
- Down + closing
- —
- Monthly P&I
- —
- Monthly cashflow
- —
- DSCR
- —
- Eligible?
- —
Personal DTI + credit; lowest rate.
DSCR
20% down · 8.5% · 30yr
- Down + closing
- —
- Monthly P&I
- —
- Monthly cashflow
- —
- DSCR
- —
- Eligible?
- —
No personal income docs; deal must DSCR.
Hard money
10% down · 12.0% · 12mo
- Down + closing
- —
- Monthly P&I
- —
- Monthly cashflow
- —
- DSCR
- —
- Eligible?
- —
Short-term bridge; refi at stabilization.
Rent comps 40 comps
| Address | Beds | Baths | Sqft | Rent | $/sqft | DOM | Units | Dist |
|---|---|---|---|---|---|---|---|---|
| 6455 Walnut Grove Rd Horn Lake, MS | 3.0 | 2.0 | 1178 | $1,600 | $1.36 | 45d | 1 | 0.19mi |
| 6420 Sandhurst Rd Horn Lake, MS | 3.0 | 2.0 | 1101 | $1,623 | $1.47 | 23d | 1 | 0.19mi |
| 3915 Woodland Dr Horn Lake, MS | 3.0 | 2.0 | 1400 | $1,775 | $1.27 | 45d | 1 | 0.22mi |
| 3560 Lakehurst Dr Horn Lake, MS | 4.0 | 2.0 | 1300 | $1,425 | $1.10 | 19d | 1 | 0.24mi |
| 6445 Collinwood Rd Horn Lake, MS | 3.0 | 2.0 | 1450 | $1,593 | $1.10 | 4d | 1 | 0.25mi |
| 3985 Fernway Dr Horn Lake, MS | 3.0 | 2.0 | 1726 | $1,903 | $1.10 | 45d | 1 | 0.26mi |
| 6270 Jamestown Ave Horn Lake, MS | 3.0 | 2.0 | 1053 | $1,523 | $1.45 | 45d | 1 | 0.28mi |
| 6290 Sandhurst Rd Horn Lake, MS | 3.0 | 2.0 | 1178 | $1,600 | $1.36 | 6d | 1 | 0.28mi |
| 3780 Southbrook Dr Horn Lake, MS | 4.0 | 2.0 | 1444 | $1,550 | $1.07 | 6d | 1 | 0.32mi |
| 3530 Mayfair Dr Horn Lake, MS | 4.0 | 2.0 | 1300 | $1,595 | $1.23 | 16d | 1 | 0.33mi |
| 6225 Sandhurst Rd Horn Lake, MS | 3.0 | 2.0 | 1200 | $1,395 | $1.16 | 45d | 1 | 0.34mi |
| 6420 Cornwall Rd Horn Lake, MS | 3.0 | 2.0 | 1189 | $1,550 | $1.30 | 16d | 1 | 0.35mi |
| 6585 Fairwood Cv Horn Lake, MS | 3.0 | 2.0 | 1473 | $1,553 | $1.05 | 25d | 1 | 0.35mi |
| 4355 Shadow Ridge Dr Horn Lake, MS | 3.0 | 2.0 | 1350 | $1,760 | $1.30 | 6d | 1 | 0.37mi |
| 4088 Carroll Dr W Horn Lake, MS | 3.0 | 2.0 | 1614 | $1,815 | $1.12 | 6d | 1 | 0.45mi |
| 3437 Laurelwood St Horn Lake, MS | 3.0 | 2.0 | 1200 | $1,480 | $1.23 | 13d | 1 | 0.49mi |
| 6392 Manchester Dr Horn Lake, MS | 3.0 | 2.0 | 1352 | $1,715 | $1.27 | 4d | 1 | 0.51mi |
| 6420 Forestgate Rd Horn Lake, MS | 3.0 | 2.0 | 1120 | $1,573 | $1.40 | 23d | 1 | 0.53mi |
| 6165 Forestgate Rd Horn Lake, MS | 3.0 | 1.5 | 1079 | $1,400 | $1.30 | 45d | 1 | 0.56mi |
| 4506 Shadow Hollow Dr Horn Lake, MS | 3.0 | 2.0 | 1300 | $1,645 | $1.27 | 4d | 1 | 0.60mi |
| 6620 Tealwood Dr Horn Lake, MS | 3.0 | 2.0 | 1833 | $2,170 | $1.18 | 5d | 1 | 0.64mi |
| 3914 Santa Fe Loop Horn Lake, MS | 3.0 | 3.0 | 1238 | $1,673 | $1.35 | 25d | 1 | 0.71mi |
| 7266 Illinois Central Ave Horn Lake, MS | 3.0 | 3.0 | 1778 | $1,718 | $0.97 | 4d | 1 | 0.73mi |
| 6475 Forest Glen Dr Horn Lake, MS | 3.0 | 1.5 | 1100 | $1,395 | $1.27 | 45d | 1 | 0.74mi |
| 7080 Benji Ave Horn Lake, MS | 3.0 | 2.0 | 1276 | $1,550 | $1.21 | 45d | 1 | 0.76mi |
| 7163 Layne Dr Horn Lake, MS | 3.0 | 2.0 | 1320 | $1,595 | $1.21 | 25d | 1 | 0.79mi |
| 3305 Laurel Dr Horn Lake, MS | 3.0 | 2.0 | 1085 | $1,450 | $1.34 | 25d | 1 | 0.81mi |
| 7340 Durango Dr Horn Lake, MS | 3.0 | 2.0 | 1362 | $1,705 | $1.25 | 6d | 1 | 0.81mi |
| 3060 Fairmeadow Dr Horn Lake, MS | 3.0 | 1.5 | 1104 | $1,663 | $1.51 | 4d | 1 | 0.82mi |
| 6230 Somerset Dr Horn Lake, MS | 3.0 | 2.0 | 1204 | $1,593 | $1.32 | 4d | 1 | 0.85mi |
| 3285 Edenshire Ln Horn Lake, MS | 2.0 | 2.0 | 1407 | $1,573 | $1.12 | 25d | 1 | 0.86mi |
| 7101 Tulane Rd N Horn Lake, MS | 2.0–3.0 | 2.0 | 1189 | $1,750 | $1.47 | 4d | 6 | 0.90mi |
| 4238 Highgate Dr Horn Lake, MS | 3.0 | 2.0 | 1232 | $1,585 | $1.29 | 45d | 1 | 0.90mi |
| 7202 Brenwood Dr Horn Lake, MS | 3.0 | 2.0 | 1490 | $1,705 | $1.14 | 23d | 1 | 0.90mi |
| 2890 Meadowbrook Dr Horn Lake, MS | 3.0 | 2.0 | 1171 | $1,375 | $1.17 | 4d | 1 | 0.91mi |
| 6360 Greenbriar Dr Horn Lake, MS | 3.0 | 1.5 | 1328 | $1,465 | $1.10 | 45d | 1 | 0.92mi |
| 7341 Lee Ann Dr Horn Lake, MS | 3.0 | 2.0 | 1247 | $1,660 | $1.33 | 4d | 1 | 0.92mi |
| 2921 Normandy Dr Horn Lake, MS | 3.0 | 1.5 | 1250 | $1,200 | $0.96 | 25d | 1 | 0.96mi |
| 7311 Madelyn Cv Horn Lake, MS | 3.0 | 3.0 | 1263 | $1,395 | $1.10 | 25d | 1 | 1.01mi |
| 7311 Madelyn Cv Horn Lake, MS | 3.0 | 3.0 | 1263 | $1,395 | $1.10 | 23d | 1 | 1.01mi |
Listing history 3 events
-
2026-05-09status Pending 763-char remark
-
2026-05-06$200,000 Active 763-char remark
-
1991-03-01soldstatus
ⓘ Source: listings_history table (triggers on properties + properties_extension) + one-shot
backfill from property_details.listing_events for pre-trigger history.
Tax reassessment forecast MS · Resets to sale price
- Current annual tax
- $1,384 · $115/mo
- Projected year-2 tax
- $1,580 · $132/mo
- Expected delta
- +$196/yr (+$16/mo · 14.2%)
ⓘ Screening estimate from a state-policy table — verify with the county assessor before closing.
Climate risk First Street
- Flood 1/10 Low FEMA zone X (unshaded) · 0% chance over 30 yrs
- Wildfire 4/10 Moderate
- Heat 6/10 Major 7 d/yr ≥109°F today · 22 d/yr by 30 yrs out
- Wind 4/10 Moderate 18% chance of damaging wind over 30 yrs
- Air quality 2/10 Low 2 unhealthy d/yr today · 2 by 30 yrs out
Nearby sold comps map
Loading sold comps map…
Walkable amenities ~0.75 mi
Loading nearby amenities…
Taxation est. · year 1
- Rental income
- $19,960
- − Mortgage interest
- −$11,203
- − Property taxes
- −$1,384
- − Insurance
- −$1,000
- − Repairs & maintenance
- −$1,597
- − Management
- −$1,597
- − Depreciation
- −$5,818
- Taxable loss
- −$2,639
- Est. tax savings @ 24.0%
- +$633
- After-tax cash flow
- $1,432/yr
For passive investors: Depreciation is non-cash, so a rental often shows a tax loss while cash-flowing — sheltering income. Rental losses are passive: they offset passive income freely, and up to $25,000/yr can offset ordinary (W-2) income if you actively participate and your MAGI is under $100k (phasing out to $0 by $150k); unused losses carry forward. On sale, claimed depreciation is recaptured at up to 25%, and gains may owe capital-gains tax (a 1031 exchange can defer both). Figures are a year-1 estimate at your 24.0% rate — not tax advice; consult a CPA.
Schools (NCES district)
- District
- Desoto County School District
- NCES district ID
- 2801320
- Math proficiency
- 48% ▼ -13.00%
- Reading proficiency
- 42% ▼ -6.00%
- Median HH income
- $59,272
- Composite
- 39.56/100
- National rank
- #3933
- State rank
- #20 of 130 in MS
Livability — Horn Lake
- Score
- 61/100
- State rank
- #196
- US rank
- #17977
Category grades
Schools grade is shown separately in the Schools card above.
Census & demographics
- Census place
- Horn Lake, MS
- County
- DeSoto County · 176,513 people
- City population
- 26,647
- Metro
- Memphis, TN-MS-AR
- Population (ZIP)
- 26,647
- Household income
- $53,311
- Rent vs Own
- Severe rent burden
- 1052.0
Population outlook (DeSoto County) Hauer SSP2
- Today (2025)
- 203,338 people
- By 2030
- 217,692 · +7.1%
- By 2040
- 245,320 · +20.6%
- By 2050
- 270,133 · +32.8%
- By 2075
- 323,341 · +59.0%
- By 2100
- 348,742 · +71.5%
Race, ethnicity, and origin ACS 2023
- Neighborhood character
- Diverse neighborhood (Simpson 0.62)
- Race & ethnicity
- Black 44% White 42% Hispanic / Latino 9% Two or more races 5% Asian 1%
- Hispanic origin (detail)
- Mexican 7%
- Common ancestry
- Slovak 2% Lithuanian 1% Serbian 1%
- Foreign-born
- 7% · Canada
- Languages at home
- 91% English-only · Spanish 8%
Political lean MEDSL · DeSoto
- 2024 margin
- Strong R (+24.1) · D 36.7% · R 60.8% · Other 2.5%
- 2008→2024 swing
- +14.2pp toward D · 2008: -38.2pp · 2024: -24.1pp
- All cycles
- 2024: R+24.1 2020: R+23.9 2016: R+34.8 2012: R+33.5 2008: R+38.2
Not yet ingested
- Civics
- —
Market trends
- HPI YoY
- ▼ -32.08%
- Current HPI
- 206.5542
- Rent YoY
- ▼ -0.66%
- Metro
- Memphis, TN-MS-AR
- State GDP YoY
- —
- F500 in state
- 0
Price history
4 events — show timeline
- 2026-06-10 Sold (MLS) — MLSU
- 2026-05-09 Pending — MLSU
- 2026-05-06 Listed $200,000 MLSU
- 1991-03-01 Sold (Public Records) — Public Records
Property tax history
+4.5%/yrLatest (2025): $1,384 · +15.9% YoY. Source: county tax records.
Cash-flow waterfall
monthlySold comps — $/sqft
last 12 mo · ≤1 miLoading sold comps…