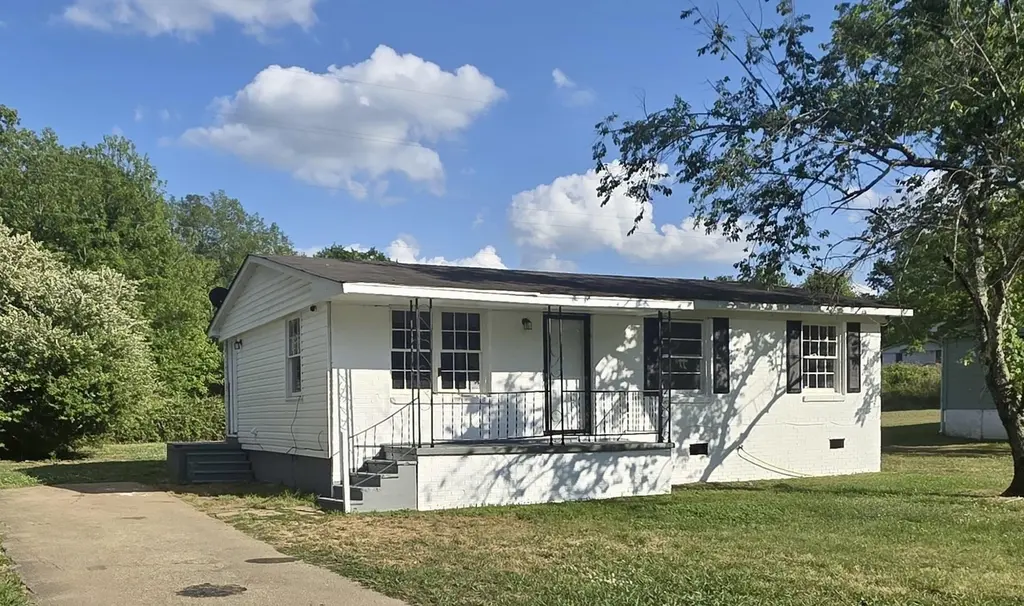
13 Heritage Ct · Spartanburg, SC
Flood risk 3/10 · Minor
- FEMA flood zone
- X (unshaded)
- Chance of flooding over 30 yrs
- 0.2%
- Est. flood insurance / yr
- $507 – $1,088
Fire risk 4/10 · Minor
- Est. fire insurance / yr
- $783 – $1,453
Heat risk 5/10 · Moderate
- Hot days now (above 105°F)
- 7 days/yr
- Hot days in 30 yrs
- 16 days/yr
Wind risk 2/10 · Minimal
- Chance of severe wind over 30 yrs
- 1.0%
Air-quality risk 4/10 · Minor
- Unhealthy air days now
- 3 days/yr
- Unhealthy air days in 30 yrs
- 4 days/yr
Risk factors via First Street. Map © Google.
Why this score? — see what drove the D grade
The composite is a weighted blend of 9 inputs, each scored 0–100. Each bar is that input's sub-score; the figure is the points it added to the 100-point composite (weight × sub-score).
- Cash flow +15.1/30.0
- ARV discount +7.5/15.0
- DSCR +4.6/10.0
- 1% rule +4.1/10.0
- Livability +3.8/5.0
- Schools +3.7/10.0
- Rent growth +2.7/5.0
- Condition / age +2.5/5.0
- Appreciation +0.0/10.0
$149,900
🖨 Deal sheet (PDF) 📄 Offer letter ✓ Due diligence
Listing remarks
This move-in-ready 3-bedroom, 1-bathroom home has been fully renovated with fresh paint inside and out. The interior features brand-new flooring and a modern kitchen complete with new stainless steel appliances. Equipped with a new AC system and quality upgrades throughout, this Spartanburg residence is perfectly prepared for immediate occupancy.
Key facts
- Fully renovated
- Brand-new flooring
- Quality upgrades
Tags
Property features AI
Finance
- Other: Directions available: From Downtown Spartanburg take US-29 North (East Main Street), continue ~3 miles, Right on Cherry Hill Road, follow ~1 mile, Right on Heritage Hills Drive, then first Left onto Heritage
- Financial info: Annual tax amount approximately $2,152
- HOA & community: HOA details not provided
Exterior
- Parking: 2-car garage
- Security: Security details not provided
- Utilities: Utilities details not provided
- Home design: Single-family residence; Residential property; One story
- Construction: Built area above grade approximately 912; Construction details not provided; Year built not provided
- Exterior features: Lot in Lakeview Manor subdivision
Interior
- Kitchen: Kitchen details not provided
- Bedrooms: Bedrooms info not provided
- Flooring: Flooring details not provided
- Bathrooms: 1 full bathroom
- Heating & cooling: Heating and cooling details not provided
- Interior features: One-level living
- Laundry & utility: Laundry details not provided
Neighborhood map
What this means for you Summary
Snapshot
- This is a 3-bed/1.0-bath single-family listed at $150k.
Deal economics
- At list price, monthly cash flow is $49 ($586/yr) — positive.
- The deal already cash-flows at list — no discount required.
- To meet the 1% rule (rent ≥ 1% of price), the offer needs to be $136k (9.1% below list).
- Recommended offer: $136k (9.1% below list) — sets the bar for 1% rule.
- Cap rate 6.7% vs local median 3.9% in Spartanburg — top-decile yield for the area; either an underpriced asset or a hidden risk that comps aren't pricing in. Stress-test before assuming the spread holds.
Location & tenants
- Location reads 76/100 on livability (#24 in SC, #3,679 nationally) — a middle-class / working-renter tenant base. Strengths: amenities A+, commute A+, cost of living A+; Watch: crime F, employment F.
- Spartanburg 03 (suburban): math 39% / reading 49% proficiency, ranked #28 of 80 in SC (top 35%) — families likely to look elsewhere, expect single-tenant / working-renter base with shorter leases.
- Zoned schools: Cannons Elementary (math 52% / reading 42%, grade D-, #209 of 597 statewide, top 36%, 393 students, 100% FRL); Clifdale Middle (695 students, 78% FRL); Broome High (math 42% / reading 80%, grade C+, #105 of 196 statewide, top 54%, 825 students, 68% FRL) — zoned schools average 82% FRL vs 57% district-wide (25 pts higher); higher-poverty schools than district average — tighter screening recommended.
- Market conditions: Rents flat; 276 active listings in the ZIP; 3,129 units permitted in Spartanburg County in 2024 (40 in 5+ unit buildings).
Forward outlook
- Local home prices are declining (-3.0%/yr); year-one equity from $1k of loan paydown is wiped out by about $4k of value loss. Plan a longer hold.
- Spartanburg County population projected at +18% by 2050 — long-run rental-demand tailwind backs the buy-and-hold thesis.
Negotiation context
- It's been on market 52 days — a 3% lower offer ($145k) is reasonable based on typical stale-listing flexibility.
- 3 sale attempts since 4y ago; this cycle's ask has dropped $20k (12%) from the opening price — seller is motivated, your offer sets the floor, not the list.
- Current owner paid $80k; list at $150k implies a 87% gain — meaningful room to come down on a strong offer.
Risks & watch-outs
- Climate carrying-cost: extreme-heat days projected 7→16/yr by 2055 (HVAC capex compounding) — expect insurance premiums to compound above CPI over the hold.
Questions for the listing agent
- It's been on market 52 days. Have you received any prior offers? Is the seller open to a 9% concession, seller financing, or rate buy-down credit?
- Built in 1972 — when were the roof, HVAC, electrical panel, plumbing, and water heater last replaced?
- Is there a deadline driving the sale (1031 exchange, divorce, estate, relocation)? That informs how much negotiation room exists.
- Schools are D-rated, which usually means shorter tenancies and higher turnover. Who's the typical renter profile here, and what's been the actual vacancy rate?
- Crime grade is F in this area — have there been break-ins, vandalism, or insurance claims at this property in the last 3 years? What carrier currently insures it and at what premium?
- The area grade is low — what's the realistic commute time and amenity access for the typical tenant pool here? Any planned neighborhood developments (good or bad) we should know about?
- What's the average days-on-market for RENTAL listings here right now (not sales)? A rising rental-DOM trend means longer vacancies and softer asking-rent achievability than the comps imply.
- What's the recent tenant-quality profile in this submarket — average credit score on applications, eviction rate, late-payment / NSF rate, and stable-employment percentage? A property-management company in the area should have these aggregated.
- How much new for-sale + rental construction is in the pipeline within 1–3 miles? Heavy new supply typically softens prices + rents 12–24 months out; constrained supply supports both.
Investment metrics
- 1% rule
- 0.91% ✗
- Cap rate
- 6.68%
- Cash-on-cash
- 1.40%
- DSCR
- 1.06
- GRM
- 9.2
CMA / ARV
No comps found within radius.
Projected returns pro-forma
-3.0% appreciation · 0.64% rent growth · sell at horizon
- IRR
- -16.7%
- Equity multiple
- 0.42×
- Total profit
- $-24,325
- Equity at exit
- $22,351
- IRR
- -13.5%
- Equity multiple
- 0.30×
- Total profit
- $-29,487
- Equity at exit
- $12,961
Cash invested: $41,972 (down + closing). Projections, not guarantees.
Landlord ↔ Tenant lean methodology
- Overall (STATE)
- 90 Strongly Landlord-Friendly
- State South Carolina
- 90 Strongly Landlord-Friendly · R+6
- County
- — inherits STATE
- City
- — inherits STATE
ZIP-level market 29307
- Home prices YoY
- -17.7%
- Rents YoY
- 0.6%
- Active inventory
- 276
- Price-to-rent
- 9.2×
Monthly cashflow live
- Estimated rent
- $1,363 medium interval (Pro) →
- Mortgage (P&I)
- −$786
- Tax from tax record
- −$179 /mo · $2,152/yr
- Insurance
- −$62
- HOA
- −$0
- Vacancy / Maint / Mgmt
- −$286
- Net cashflow
- $49
Break-even live
Sensitivity live
| Price | -10% $134 | -5% $91 | +0% $49 | +5% $6 | +10% $-36 |
|---|---|---|---|---|---|
| Rent | -10% $-59 | -5% $-5 | +0% $49 | +5% $103 | +10% $157 |
| Rate | -1.0pp $124 | -0.5pp $87 | base $49 | +0.5pp $10 | +1.0pp $-29 |
UW: 25.0% down · 7.5% · 30yr · 1.5% tax · 5.0% vac · 8.0% maint · 8.0% mgmt
Financing live
Cash to close
- Down payment
- $37,475
- Closing costs
- $4,497
- Reserves months
- —
- Total cash needed
- —
Loan-product check · same deal, 3 products live
Conventional
25% down · 7.5% · 30yr
- Down + closing
- —
- Monthly P&I
- —
- Monthly cashflow
- —
- DSCR
- —
- Eligible?
- —
Personal DTI + credit; lowest rate.
DSCR
20% down · 8.5% · 30yr
- Down + closing
- —
- Monthly P&I
- —
- Monthly cashflow
- —
- DSCR
- —
- Eligible?
- —
No personal income docs; deal must DSCR.
Hard money
10% down · 12.0% · 12mo
- Down + closing
- —
- Monthly P&I
- —
- Monthly cashflow
- —
- DSCR
- —
- Eligible?
- —
Short-term bridge; refi at stabilization.
Listing history 29 events
-
2026-06-22days on market $149,900 Active 52 DOM
-
2026-06-18days on market $149,900 Active 49 DOM
-
2026-06-17days on market $149,900 Active 48 DOM
-
2026-06-16days on market $149,900 Active 47 DOM
-
2026-06-15days on market $149,900 Active 46 DOM
-
2026-06-14days on market $149,900 Active 44 DOM
-
2026-06-13pricedays on market $149,900 Active 43 DOM
-
2026-06-10days on market $159,900 Active 41 DOM
-
2026-06-09days on market $159,900 Active 40 DOM
-
2026-06-08days on market $159,900 Active 39 DOM
-
2026-06-07days on market $159,900 Active 38 DOM
-
2026-06-05days on market $159,900 Active 35 DOM
-
2026-06-03days on market $159,900 Active 34 DOM
-
2026-06-02days on market $159,900 Active 33 DOM
-
2026-06-01days on market $159,900 Active 32 DOM
-
2026-05-31days on market $159,900 Active 31 DOM
-
2026-05-30days on market $159,900 Active 30 DOM
-
2026-05-21price $159,900
-
2026-04-30$169,900 Active
-
2022-12-03historical
-
2022-11-26price $159,000
-
2022-11-10price $165,000
-
2022-10-17price $170,000
-
2022-10-17status Active
-
2022-08-25historical
-
2022-07-28$139,000 Active
-
2022-07-11soldstatus $80,000
-
2004-12-07soldstatus $26,500
-
1994-01-01soldstatus $79,000
ⓘ Source: listings_history table (triggers on properties + properties_extension) + one-shot
backfill from property_details.listing_events for pre-trigger history.
Tax reassessment forecast SC · Resets to sale price
- Current annual tax
- $2,152 · $179/mo
- Projected year-2 tax
- $2,152 · $179/mo
- Expected delta
- $0/yr ($0/mo · 0.0%)
ⓘ Screening estimate from a state-policy table — verify with the county assessor before closing.
Climate risk First Street
- Flood 3/10 Moderate FEMA zone X (unshaded) · 20% chance over 30 yrs
- Wildfire 4/10 Moderate
- Heat 5/10 Major 7 d/yr ≥105°F today · 16 d/yr by 30 yrs out
- Wind 2/10 Low 100% chance of damaging wind over 30 yrs
- Air quality 4/10 Moderate 3 unhealthy d/yr today · 4 by 30 yrs out
Nearby sold comps map
Loading sold comps map…
Walkable amenities ~0.75 mi
Loading nearby amenities…
Taxation est. · year 1
- Rental income
- $16,356
- − Mortgage interest
- −$8,397
- − Property taxes
- −$2,152
- − Insurance
- −$750
- − Repairs & maintenance
- −$1,308
- − Management
- −$1,308
- − Depreciation
- −$4,361
- Taxable loss
- −$1,920
- Est. tax savings @ 24.0%
- +$461
- After-tax cash flow
- $1,047/yr
For passive investors: Depreciation is non-cash, so a rental often shows a tax loss while cash-flowing — sheltering income. Rental losses are passive: they offset passive income freely, and up to $25,000/yr can offset ordinary (W-2) income if you actively participate and your MAGI is under $100k (phasing out to $0 by $150k); unused losses carry forward. On sale, claimed depreciation is recaptured at up to 25%, and gains may owe capital-gains tax (a 1031 exchange can defer both). Figures are a year-1 estimate at your 24.0% rate — not tax advice; consult a CPA.
Schools (NCES district)
- District
- Spartanburg 03
- NCES district ID
- 4503540
- Math proficiency
- 39% ▼ -5.00%
- Reading proficiency
- 49% ▲ 6.00%
- Median HH income
- $36,898
- Composite
- 36.52/100
- National rank
- #4645
- State rank
- #28 of 80 in SC
Livability — Spartanburg
- Score
- 76/100
- State rank
- #24
- US rank
- #3679
Category grades
Schools grade is shown separately in the Schools card above.
Census & demographics
- County
- Spartanburg County · 258,607 people
- City population
- 120,406
- Metro
- Spartanburg, SC
- Population (ZIP)
- 19,115
- Household income
- $65,850
- Rent vs Own
- Severe rent burden
- 438.0
Population outlook (Spartanburg County) Hauer SSP2
- Today (2025)
- 325,495 people
- By 2030
- 338,800 · +4.1%
- By 2040
- 363,471 · +11.7%
- By 2050
- 384,156 · +18.0%
- By 2075
- 430,137 · +32.1%
- By 2100
- 442,733 · +36.0%
Race, ethnicity, and origin ACS 2023
- Neighborhood character
- Predominantly White (74%)
- Race & ethnicity
- White 74% Black 20% Two or more races 4% Hispanic / Latino 3%
- Common ancestry
- Serbian 4% Slovak 2% Romanian 1%
- Foreign-born
- 4% · Canada, Jamaica
- Languages at home
- 91% English-only · Spanish 5% Russian/Polish/Slavic 1% Other Indo-European 1%
Political lean MEDSL · Spartanburg
- 2024 margin
- Solid R (+33.6) · D 32.6% · R 66.2% · Other 1.2%
- 2008→2024 swing
- -12.0pp toward R · 2008: -21.6pp · 2024: -33.6pp
- All cycles
- 2024: R+33.6 2020: R+27.3 2016: R+30.0 2012: R+23.1 2008: R+21.6
Not yet ingested
- Civics
- —
Market trends
- HPI YoY
- ▼ -52.58%
- Current HPI
- 244.9855
- Rent YoY
- ▲ 0.64%
- Metro
- Spartanburg, SC
- State GDP YoY
- ▲ 4.51%
- F500 in state
- 2
Industry mix (Fortune 500 HQ in SC)
| Industry | F500 HQs | Revenue |
|---|---|---|
| Packaging | 1 | $7B |
|
||
Price history
+102.4% since first listed12 events — show timeline
- 2026-05-21 Price Changed $159,900 SPMLS
- 2026-04-30 Listed $169,900 SPMLS
- 2022-12-03 Listing Removed — Greater Greenville MLS
- 2022-11-26 Price Changed $159,000 Greater Greenville MLS
- 2022-11-10 Price Changed $165,000 Greater Greenville MLS
- 2022-10-17 Price Changed $170,000 Greater Greenville MLS
- 2022-10-17 Relisted — Greater Greenville MLS
- 2022-08-25 Listing Removed — Greater Greenville MLS
- 2022-07-28 Listed $139,000 Greater Greenville MLS
- 2022-07-11 Sold (Public Records) $80,000 Public Records
- 2004-12-07 Sold (Public Records) $26,500 Public Records
- 1994-01-01 Sold (Public Records) $79,000 Public Records
Property tax history
+18.4%/yrLatest (2025): $2,152 · +0.7% YoY. Source: county tax records.
Cash-flow waterfall
monthlySold comps — $/sqft
last 12 mo · ≤1 miLoading sold comps…