 Multi-family
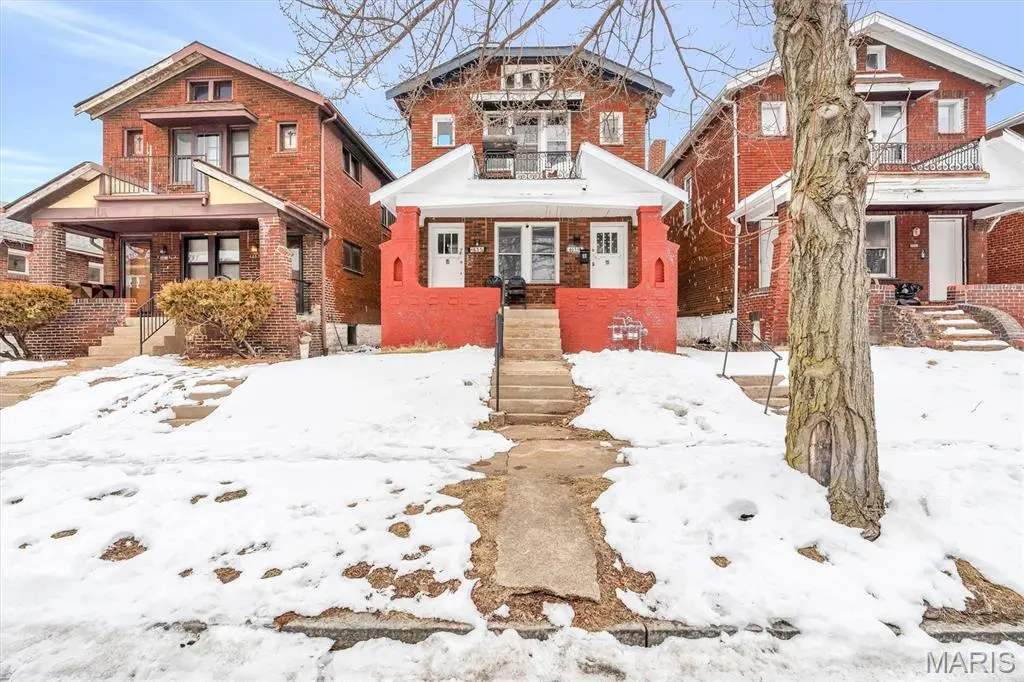
4655 Farlin Ave · St. Louis, MO
Flood risk 6/10 · Moderate
- FEMA flood zone
- X (unshaded)
- Chance of flooding over 30 yrs
- 0.74%
- Est. flood insurance / yr
- $473 – $860
Fire risk 1/10 · Minimal
- Est. fire insurance / yr
- $1,054 – $1,958
Heat risk 5/10 · Moderate
- Hot days now (above 107°F)
- 7 days/yr
- Hot days in 30 yrs
- 21 days/yr
Wind risk 2/10 · Minimal
- Chance of severe wind over 30 yrs
- 1.0%
Air-quality risk 4/10 · Minor
- Unhealthy air days now
- 5 days/yr
- Unhealthy air days in 30 yrs
- 6 days/yr
Risk factors via First Street. Map © Google.
Why this score? — see what drove the C+ grade
The composite is a weighted blend of 9 inputs, each scored 0–100. Each bar is that input's sub-score; the figure is the points it added to the 100-point composite (weight × sub-score).
- Cash flow +30.0/30.0
- 1% rule +10.0/10.0
- DSCR +10.0/10.0
- Appreciation +3.3/10.0
- Rent growth +2.5/5.0
- Livability +2.5/5.0
- Condition / age +2.5/5.0
- ARV discount +1.2/15.0
- Schools +1.2/10.0
$100,000
🖨 Deal sheet 📄 Offer letter ✓ Due diligence
Multi-family units
County records classify this as Multi-Family (2-4 Unit). Listing-text estimate: 1 unit. estimate disagrees with records
Listing remarks MLS
Versatile, income-producing opportunity in the heart of the Penrose neighborhood! This unique property offers a rare zoning variance allowing a daycare for up to 18 children on the main level, making it ideal for an owner-operator, entrepreneur, or investor seeking flexible use and strong upside. The upper unit already has a tenant in place, providing immediate rental income—perfect for an investor or a savvy buyer looking to house-hack by living on-site while offsetting expenses. Whether you envision running a daycare below, adding another rental, or creating a live/work setup, the possibilities are exponential. Situated on a quieter one-way street, the home features a fenced-in yard ideal for outdoor play or private enjoyment, plus a garage accessed from the rear alley for convenient off-street parking and storage. The layout and exterior setup support both residential comfort and business functionality. Located in the Penrose neighborhood, this property enjoys close proximity to public transportation, including multiple bus routes, making commuting and accessibility easy for residents, tenants, employees, or daycare families. Outdoor and community amenities are a standout, including Penrose Park, WC Handy Park, and Tink Bradley Playground, all offering green space, play areas, and neighborhood gathering spots. Nearby community gardens add to the strong sense of local connection and provide opportunities for gardening, wellness, and neighborhood engagement. Just minutes away, Fairground Park expands recreational options with lakes, trails, and expansive open green space. The area also benefits from quick access to I-70, I-55, and downtown St. Louis, placing major employment centers, hospitals, and educational institutions within easy reach. Neighborhood conveniences include local schools, community centers, churches, and everyday retail, with additional shopping and dining options a short drive away. Whether you’re an investor seeking steady cash flow, a buyer looking to live affordably while generating income, or someone ready to operate a licensed daycare, 4655 Farlin Avenue delivers flexibility, community connection, and opportunity in a well-established North St. Louis neighborhood.
Key facts
- Quick access to i-55
- Everyday retail
- Community centers
Tags
Neighborhood map
What this means for you Summary
Snapshot
- This is a 4-bed/2.0-bath multifamily listed at $100k.
Deal economics
- At list price, monthly cash flow is $994 ($12k/yr) — positive.
- The deal already cash-flows at list — no discount required.
- Meets the 1% rule at list price ($2k rent vs $100k).
- Recommended offer: $88k (12.0% below list) — sets the bar for market timing.
- Cap rate 18.2% vs local median 5.0% in St. Louis — top-decile yield for the area; either an underpriced asset or a hidden risk that comps aren't pricing in. Stress-test before assuming the spread holds.
Location & tenants
- Location reads: area grade C — affects rentability + tenant quality, not the cash-flow math above.
- St. Louis City (urban): math 10% / reading 18% proficiency, ranked #312 of 324 in MO (top 96%) — low school quality limits family demand, transient renter base, plan for 1-2y turnover; 80% free/reduced lunch — lower-income household profile, screen leases tightly.
- Market conditions: 97 active listings in the ZIP; 3 comparable units currently listed for rent nearby; rentals at typical pace (median 24d on market — plan ~3-4 weeks tenant-placement turnaround); lower-income renter base — watch delinquency; 294 units permitted in St. Louis city in 2024 (227 in 5+ unit buildings).
- At $2,003/mo this rent would consume 78% of the median local household income ($31k/yr) (locally 1655% of renters already pay >50% of income on rent) — very limited rent-growth headroom before tenants either downsize or default.
Forward outlook
- Local home prices are declining (-3.0%/yr); year-one equity from $691 of loan paydown is wiped out by about $3k of value loss. Plan a longer hold.
- St. Louis County population projected to shrink 6% by 2050 — rents likely to lag national; underwrite the cash flow, not the appreciation.
- At projected returns (-3.0% appreciation + 3.0% rent growth), your $28k cash investment doubles in ~3 years — after that, you're playing with house money.
Negotiation context
- It's been on market 129 days — a 12% lower offer ($88k) is reasonable based on typical stale-listing flexibility.
- 9 sale attempts since 6y ago with the ask held roughly flat each time — persistent listings suggest the price (not the market) is what's stuck; bring a comps-based counter.
- Current owner paid $45k; list at $100k implies a 122% gain — meaningful room to come down on a strong offer.
Risks & watch-outs
- Watch-outs: built in 1939 — expect roof / HVAC / electrical / plumbing capex.
- Climate carrying-cost: major flood risk; extreme-heat days projected 7→21/yr by 2055 (HVAC capex compounding) — expect insurance premiums to compound above CPI over the hold.
Questions for the listing agent
- It's been on market 129 days. Have you received any prior offers? Is the seller open to a 12% concession, seller financing, or rate buy-down credit?
- Built in 1939 — when were the roof, HVAC, electrical panel, plumbing, and water heater last replaced?
- Why hasn't it sold? Are there any deal-killer items the seller is aware of (foundation, flood, title, zoning, code violations)?
- Is there a deadline driving the sale (1031 exchange, divorce, estate, relocation)? That informs how much negotiation room exists.
- What's the average days-on-market for RENTAL listings here right now (not sales)? A rising rental-DOM trend means longer vacancies and softer asking-rent achievability than the comps imply.
- What's the recent tenant-quality profile in this submarket — average credit score on applications, eviction rate, late-payment / NSF rate, and stable-employment percentage? A property-management company in the area should have these aggregated.
- How much new apartment / multifamily construction is in the pipeline within 1–3 miles? Heavy new supply (>2% of stock underway) typically softens rents 12–24 months out; light construction supports rent growth.
Investment metrics
- 1% rule
- 2.00% ✓
- Cap rate
- 18.22%
- Cash-on-cash
- 42.59%
- DSCR
- 2.89
- GRM
- 4.2
CMA / ARV
- ARV (median comp)
- $87,716
- List price
- $100,000
- Delta
- 14.00%
- Verdict
- OVERPRICED
- Comps
- 20 within 1.0 mi
Show comp detail 4 sales within ~0.75 mi
| Address | Dist | Beds/Ba | Sqft | Sold | Price | $/sf | Match |
|---|---|---|---|---|---|---|---|
| 3068 Marcus Ave | 0.49mi | 4/2.0 | 2,028 (-2%) | 4mo | $28,000 | $14 | 70 |
| 3917 Cora Ave | 0.14mi | 4/2.0 | 1,926 (-7%) | 24mo | $89,900 | $47 | 62 |
| 4116 N Kingshighway Blvd | 0.51mi | 4/2.0 | 2,222 (+7%) | 22mo | $50,000 | $23 | 46 |
| 4237 Holly Ave | 0.60mi | 4/2.0 | 2,332 (+12%) | 7mo | $156,900 | $67 | 45 |
Match score weights: distance 35% · size 25% · config 20% · recency 20%. Top-matched comps best support the ARV.
Projected returns pro-forma
-3.0% appreciation · 3.0% rent growth · sell at horizon
- IRR
- 39.3%
- Equity multiple
- 2.68×
- Total profit
- $47,054
- Equity at exit
- $14,910
- IRR
- 45.7%
- Equity multiple
- 5.37×
- Total profit
- $122,338
- Equity at exit
- $8,646
Cash invested: $28,000 (down + closing). Projections, not guarantees.
Landlord ↔ Tenant lean methodology
- Overall (STATE)
- 81 Strongly Landlord-Friendly
- State Missouri
- 81 Strongly Landlord-Friendly · R+10
- County
- — inherits STATE
- City
- — inherits STATE
ZIP-level market 63115
- Home prices YoY
- -2.6%
- Active inventory
- 97
- Price-to-rent
- 8.3×
Monthly cashflow live
- Estimated rent
- $2,003 high interval (Pro) →
- Mortgage (P&I)
- −$524
- Tax from tax record
- −$23 /mo · $271/yr
- Insurance
- −$42
- HOA
- −$0
- Vacancy / Maint / Mgmt
- −$421
- Net cashflow
- $994
Break-even live
2-unit breakdown (identical units grouped — click to expand)
| Units | Beds | Baths | Est. rent |
|---|---|---|---|
| 2× units | 2 | 1 | $2,004 |
| #1 | 2 | 1 | $1,002 |
| #2 | 2 | 1 | $1,002 |
| Total (2 units) | $2,003 | ||
UW: 25.0% down · 7.5% · 30yr · 1.5% tax · 5.0% vac · 8.0% maint · 8.0% mgmt
Financing live
Cash to close
- Down payment
- $25,000
- Closing costs
- $3,000
- Reserves months
- —
- Total cash needed
- —
Loan-product check · same deal, 3 products live
Conventional
25% down · 7.5% · 30yr
- Down + closing
- —
- Monthly P&I
- —
- Monthly cashflow
- —
- DSCR
- —
- Eligible?
- —
Personal DTI + credit; lowest rate.
DSCR
20% down · 8.5% · 30yr
- Down + closing
- —
- Monthly P&I
- —
- Monthly cashflow
- —
- DSCR
- —
- Eligible?
- —
No personal income docs; deal must DSCR.
Hard money
10% down · 12.0% · 12mo
- Down + closing
- —
- Monthly P&I
- —
- Monthly cashflow
- —
- DSCR
- —
- Eligible?
- —
Short-term bridge; refi at stabilization.
Rent comps 3 comps
| Address | Beds | Baths | Sqft | Rent | $/sqft | DOM | Units | Dist |
|---|---|---|---|---|---|---|---|---|
| 5223 Ashland Ave Unit 2 St. Louis, MO | 3.0 | 1.0 | 2200 | $1,450 | $0.66 | 43d | 1 | 0.95mi |
| 4247 Maffitt Ave St. Louis, MO | 3.0 | 1.5 | 1700 | $1,000 | $0.59 | 4d | 1 | 1.07mi |
| 4202 Gano Ave Saint Louis, MO | 3.0 | 1.0 | 1650 | $1,168 | $0.71 | 23d | 1 | 1.48mi |
Listing history 39 events
-
2026-06-18days on market $100,000 Active 129 DOM
-
2026-06-17days on market $100,000 Active 128 DOM
-
2026-06-16days on market $100,000 Active 127 DOM
-
2026-06-15days on market $100,000 Active 126 DOM
-
2026-06-13days on market $100,000 Active 124 DOM
-
2026-06-09days on market $100,000 Active 120 DOM
-
2026-06-08days on market $100,000 Active 119 DOM
-
2026-06-08days on market $100,000 Active 118 DOM
-
2026-06-05days on market $100,000 Active 115 DOM
-
2026-06-03days on market $100,000 Active 114 DOM
-
2026-06-02days on market $100,000 Active 113 DOM
-
2026-06-01days on market $100,000 Active 112 DOM
-
2026-05-31days on market $100,000 Active 111 DOM
-
2026-02-09$100,000 Active 2244-char remark
Show marketing remark (2244 chars)
Versatile, income-producing opportunity in the heart of the Penrose neighborhood! This unique property offers a rare zoning variance allowing a daycare for up to 18 children on the main level, making it ideal for an owner-operator, entrepreneur, or investor seeking flexible use and strong upside. The upper unit already has a tenant in place, providing immediate rental income—perfect for an investor or a savvy buyer looking to house-hack by living on-site while offsetting expenses. Whether you envision running a daycare below, adding another rental, or creating a live/work setup, the possibilities are exponential. Situated on a quieter one-way street, the home features a fenced-in yard ideal for outdoor play or private enjoyment, plus a garage accessed from the rear alley for convenient off-street parking and storage. The layout and exterior setup support both residential comfort and business functionality. Located in the Penrose neighborhood, this property enjoys close proximity to public transportation, including multiple bus routes, making commuting and accessibility easy for residents, tenants, employees, or daycare families. Outdoor and community amenities are a standout, including Penrose Park, WC Handy Park, and Tink Bradley Playground, all offering green space, play areas, and neighborhood gathering spots. Nearby community gardens add to the strong sense of local connection and provide opportunities for gardening, wellness, and neighborhood engagement. Just minutes away, Fairground Park expands recreational options with lakes, trails, and expansive open green space. The area also benefits from quick access to I-70, I-55, and downtown St. Louis, placing major employment centers, hospitals, and educational institutions within easy reach. Neighborhood conveniences include local schools, community centers, churches, and everyday retail, with additional shopping and dining options a short drive away. Whether you’re an investor seeking steady cash flow, a buyer looking to live affordably while generating income, or someone ready to operate a licensed daycare, 4655 Farlin Avenue delivers flexibility, community connection, and opportunity in a well-established North St. Louis neighborhood.
-
2025-08-26historical
-
2025-06-22status Active
-
2025-04-09price $118,000
-
2025-02-15$125,000 Active
-
2024-10-28price $117,000
-
2024-10-17$118,000 Active
-
2024-10-16price $118,000
-
2024-10-16historical
-
2024-08-28historical
-
2024-07-31$124,000 Active
-
2024-07-18historical
-
2024-07-14historical
-
2024-07-10historical
-
2024-04-11historical
-
2024-03-11status Active
-
2024-03-11historical
-
2023-10-11$125,000 Active
-
2021-05-13soldstatus Closed
-
2021-04-09status Pending
-
2021-03-18$69,900 Active
-
2020-08-04soldstatus $45,000
-
2020-07-30soldstatus Closed
-
2020-07-14status Pending
-
2020-06-19$53,000 Active
-
2005-09-30soldstatus $82,500
ⓘ Source: listings_history table (triggers on properties + properties_extension) + one-shot
backfill from property_details.listing_events for pre-trigger history.
Tax reassessment forecast MO · Resets to sale price
- Current annual tax
- $271 · $23/mo
- Projected year-2 tax
- $970 · $81/mo
- Expected delta
- +$699/yr (+$58/mo · 258.2%)
ⓘ Screening estimate from a state-policy table — verify with the county assessor before closing.
Climate risk First Street
- Flood 6/10 Major FEMA zone X (unshaded) · 74% chance over 30 yrs
- Wildfire 1/10 Low
- Heat 5/10 Major 7 d/yr ≥107°F today · 21 d/yr by 30 yrs out
- Wind 2/10 Low 100% chance of damaging wind over 30 yrs
- Air quality 4/10 Moderate 5 unhealthy d/yr today · 6 by 30 yrs out
Nearby sold comps map
Loading sold comps map…
Walkable amenities ~0.75 mi
Loading nearby amenities…
Taxation est. · year 1
- Rental income
- $24,036
- − Mortgage interest
- −$5,602
- − Property taxes
- −$271
- − Insurance
- −$500
- − Repairs & maintenance
- −$1,923
- − Management
- −$1,923
- − Depreciation
- −$2,909
- Taxable income
- $10,909
- Est. tax owed @ 24.0%
- −$2,618
- After-tax cash flow
- $9,307/yr
For passive investors: Depreciation is non-cash, so a rental often shows a tax loss while cash-flowing — sheltering income. Rental losses are passive: they offset passive income freely, and up to $25,000/yr can offset ordinary (W-2) income if you actively participate and your MAGI is under $100k (phasing out to $0 by $150k); unused losses carry forward. On sale, claimed depreciation is recaptured at up to 25%, and gains may owe capital-gains tax (a 1031 exchange can defer both). Figures are a year-1 estimate at your 24.0% rate — not tax advice; consult a CPA.
Schools (NCES district)
- District
- St. Louis City
- NCES district ID
- 2929280
- Math proficiency
- 10% ▼ -6.00%
- Reading proficiency
- 18% ▼ -3.00%
- Median HH income
- $35,685
- Composite
- 11.54/100
- National rank
- #9699
- State rank
- #312 of 324 in MO
Livability — St. Louis
No livability data for this city. (Only ~50 U.S. cities are tracked.)
Census & demographics
- Census place
- St. Louis, MO
- County
- Saint Louis City · 254,015 people
- City population
- 283,259
- Metro
- St. Louis, MO-IL
- Population (ZIP)
- 14,488
- Household income
- $30,622
- Rent vs Own
- Severe rent burden
- 1655.0
Population outlook (St. Louis County) Hauer SSP2
- Today (2025)
- 315,737 people
- By 2030
- 313,865 · -0.6%
- By 2040
- 305,439 · -3.3%
- By 2050
- 296,529 · -6.1%
- By 2075
- 271,028 · -14.2%
- By 2100
- 255,359 · -19.1%
Race, ethnicity, and origin ACS 2023
- Neighborhood character
- Predominantly Black (95%)
- Race & ethnicity
- Black 95% White 2% Two or more races 2%
- Foreign-born
- 0%
Political lean MEDSL · St. Louis
- 2024 margin
- Solid D (+64.7) · D 81.4% · R 16.7% · Other 2.0%
- 2008→2024 swing
- -3.5pp toward R · 2008: 68.2pp · 2024: 64.7pp
- All cycles
- 2024: D+64.7 2020: D+66.2 2016: D+63.7 2012: D+66.6 2008: D+68.2
Not yet ingested
- Civics
- —
Market trends
- HPI YoY
- ▼ -3.42%
- Current HPI
- 127.3403
- Rent YoY
- —
- Metro
- St. Louis, MO-IL
- State GDP YoY
- ▲ 1.84%
- F500 in state
- 20
Industry mix (Fortune 500 HQ in MO)
| Industry | F500 HQs | Revenue |
|---|---|---|
| Healthcare | 1 | $163B |
|
||
| Insurance | 1 | $21B |
|
||
| Industrial Technology | 1 | $17B |
|
||
| Retail | 1 | $16B |
|
||
| Industrial Distribution | 1 | $10B |
|
||
| Utilities | 1 | $9B |
|
||
Price history
+21.2% since first listed26 events — show timeline
- 2026-02-09 Listed $100,000 MARIS as Distributed by MLS Grid
- 2025-08-26 Coming Soon — MARIS as Distributed by MLS Grid
- 2025-06-22 Relisted — MARIS as Distributed by MLS Grid
- 2025-04-09 Price Changed $118,000 MARIS as Distributed by MLS Grid
- 2025-02-15 Listed $125,000 MARIS as Distributed by MLS Grid
- 2024-10-28 Price Changed $117,000 MARIS as Distributed by MLS Grid
- 2024-10-17 Listed $118,000 MARIS as Distributed by MLS Grid
- 2024-10-16 Price Changed $118,000 MARIS as Distributed by MLS Grid
- 2024-10-16 Coming Soon — MARIS as Distributed by MLS Grid
- 2024-08-28 Delisted — MARIS as Distributed by MLS Grid
- 2024-07-31 Listed $124,000 MARIS as Distributed by MLS Grid
- 2024-07-18 Coming Soon — MARIS as Distributed by MLS Grid
- 2024-07-14 Delisted — MARIS as Distributed by MLS Grid
- 2024-07-10 Coming Soon — MARIS as Distributed by MLS Grid
- 2024-04-11 Delisted — MARIS as Distributed by MLS Grid
- 2024-03-11 Relisted — MARIS as Distributed by MLS Grid
- 2024-03-11 Delisted — MARIS as Distributed by MLS Grid
- 2023-10-11 Listed $125,000 MARIS as Distributed by MLS Grid
- 2021-05-13 Sold (MLS) — MARIS as Distributed by MLS Grid
- 2021-04-09 Pending — MARIS as Distributed by MLS Grid
- 2021-03-18 Listed $69,900 MARIS as Distributed by MLS Grid
- 2020-08-04 Sold (Public Records) $45,000 Public Records
- 2020-07-30 Sold (MLS) — MARIS as Distributed by MLS Grid
- 2020-07-14 Pending — MARIS as Distributed by MLS Grid
- 2020-06-19 Listed $53,000 MARIS as Distributed by MLS Grid
- 2005-09-30 Sold (Public Records) $82,500 Public Records
Property tax history
-7.4%/yrLatest (2024): $271 · +4.6% YoY. Source: county tax records.
Cash-flow waterfall
monthlySold comps — $/sqft
last 12 mo · ≤1 miLoading sold comps…