 Duplex
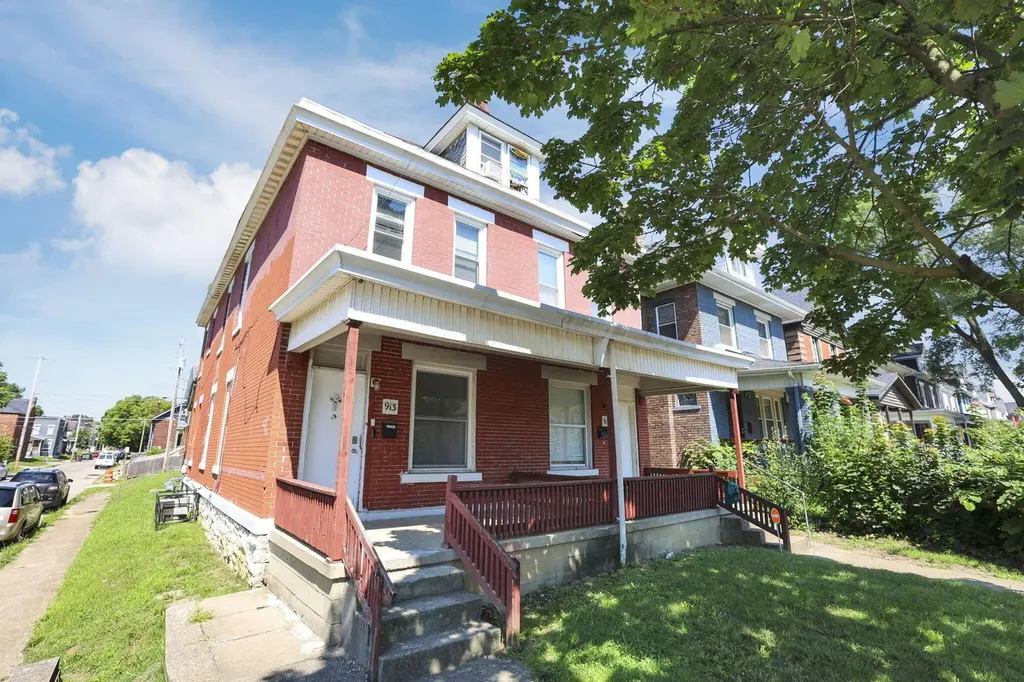
911 Linwood Ave Unit & 913 · Columbus, OH
Flood risk 3/10 · Minor
- FEMA flood zone
- X (unshaded)
- Chance of flooding over 30 yrs
- 0.2%
- Est. flood insurance / yr
- $473 – $860
Fire risk 1/10 · Minimal
- Est. fire insurance / yr
- $713 – $1,323
Heat risk 4/10 · Minor
- Hot days now (above 100°F)
- 7 days/yr
- Hot days in 30 yrs
- 18 days/yr
Wind risk 2/10 · Minimal
- Chance of severe wind over 30 yrs
- 1.0%
Air-quality risk 3/10 · Minor
- Unhealthy air days now
- 2 days/yr
- Unhealthy air days in 30 yrs
- 3 days/yr
Risk factors via First Street. Map © Google.
Why this score? — see what drove the C+ grade
The composite is a weighted blend of 9 inputs, each scored 0–100. Each bar is that input's sub-score; the figure is the points it added to the 100-point composite (weight × sub-score).
- Cash flow +26.6/30.0
- ARV discount +9.7/15.0
- DSCR +9.1/10.0
- 1% rule +7.2/10.0
- Livability +4.0/5.0
- Rent growth +3.4/5.0
- Condition / age +2.2/5.0
- Schools +1.7/10.0
- Appreciation +0.0/10.0
$375,000
🖨 Deal sheet 📄 Offer letter ✓ Due diligence
Multi-family units
County records classify this as Multi-Family (2-4 Unit). Listing-text estimate: 2 units. confirmed
Listing remarks MLS
Solid brick duplex in the heart of Southern Orchards with full occupancy & professional management already in place--ideal for a turnkey investor opportunity. Each side offers four- five bedrooms and 2 bathrooms, providing strong rental potential in a high-demand area. Recent updates include all-new HVAC systems in both units, upgraded electric service, and maintenance to the slate roof. Located just minutes from downtown Columbus, Nationwide Children's Hospital, and the revitalized Parsons Avenue corridor, the property is situated near dining, breweries, parks, and public transportation. Residents benefit from nearby attractions like Scioto Audubon Metro Park, Topiary Garden, and a vibrant calendar of community events. Southern Orchards continues to experience targeted redevelopment and institutional investment, making this a strategic long-term hold in one of Columbus's most promising growth zones. * Curb offers at this time- * See A2A *
Key facts
- Recent updates
- New hvac systems
- 4,356 sq ft lot
Tags
Neighborhood map
What this means for you Summary
Snapshot
- This is a 1×4bd/2ba + 1×5bd/2ba units multifamily listed at $375k. Condition is rated fair.
Deal economics
- At list price, monthly cash flow is $1k ($12k/yr) — positive. Per door: $504/mo.
- The deal already cash-flows at list — no discount required.
- Meets the 1% rule at list price ($5k rent vs $375k).
- Recommended offer: $330k (12.0% below list) — sets the bar for market timing.
- Cap rate 9.5% vs local median 3.8% in Columbus — top-decile yield for the area; either an underpriced asset or a hidden risk that comps aren't pricing in. Stress-test before assuming the spread holds.
Location & tenants
- Location reads 81/100 on livability (#97 in OH, #1,491 nationally) — a professional / high-income tenant draw. Strengths: commute A+, cost of living A+, housing A+; Watch: employment C-, crime F.
- Columbus City School District (urban): math 15% / reading 26% proficiency, ranked #626 of 656 in OH (top 95%) — low school quality limits family demand, transient renter base, plan for 1-2y turnover; 72% free/reduced lunch — lower-income household profile, screen leases tightly.
- Market conditions: Rents rising (+3.5%/yr); 193 active listings in the ZIP; 14 comparable units currently listed for rent nearby; rentals lingering (median 44d on market — plan ~5-8 weeks vacancy on turnover, expect pricing pressure); 64% of comp listings sitting > 30 days — soft ceiling on asking rent; solid renter incomes; 8,139 units permitted in Franklin County in 2024 (5,940 in 5+ unit buildings).
- At $4,557/mo this rent would consume 72% of the median local household income ($76k/yr) (locally 846% of renters already pay >50% of income on rent) — very limited rent-growth headroom before tenants either downsize or default.
Forward outlook
- Local home prices are declining (-3.0%/yr); year-one equity from $3k of loan paydown is wiped out by about $11k of value loss. Plan a longer hold.
- Franklin County population projected at +34% by 2050 — long-run rental-demand tailwind backs the buy-and-hold thesis.
- At projected returns (-3.0% appreciation + 3.5% rent growth), your $105k cash investment doubles in ~10 years — after that, you're playing with house money.
Negotiation context
- It's been on market 132 days — a 12% lower offer ($330k) is reasonable based on typical stale-listing flexibility.
- 2 sale attempts with the ask held roughly flat each time — persistent listings suggest the price (not the market) is what's stuck; bring a comps-based counter.
Risks & watch-outs
- Watch-outs: built in 1901 — expect roof / HVAC / electrical / plumbing capex.
Questions for the listing agent
- It's been on market 132 days. Have you received any prior offers? Is the seller open to a 12% concession, seller financing, or rate buy-down credit?
- Can we see the unit-by-unit rent roll, current vacancy, and any below-market leases? What's the average tenancy length?
- What capital expenditures (roof, boiler, parking lot, exteriors) have been made in the last 5 years, and what's planned in the next 2?
- Have any recent inspections been done? Can we get a copy of the seller's disclosures and any deferred-maintenance estimates?
- Built in 1901 — when were the roof, HVAC, electrical panel, plumbing, and water heater last replaced?
- Why hasn't it sold? Are there any deal-killer items the seller is aware of (foundation, flood, title, zoning, code violations)?
- Is there a deadline driving the sale (1031 exchange, divorce, estate, relocation)? That informs how much negotiation room exists.
- Crime grade is F in this area — have there been break-ins, vandalism, or insurance claims at this property in the last 3 years? What carrier currently insures it and at what premium?
- What's the average days-on-market for RENTAL listings here right now (not sales)? A rising rental-DOM trend means longer vacancies and softer asking-rent achievability than the comps imply.
- What's the recent tenant-quality profile in this submarket — average credit score on applications, eviction rate, late-payment / NSF rate, and stable-employment percentage? A property-management company in the area should have these aggregated.
- How much new apartment / multifamily construction is in the pipeline within 1–3 miles? Heavy new supply (>2% of stock underway) typically softens rents 12–24 months out; light construction supports rent growth.
Investment metrics
- 1% rule
- 1.22% ✓
- Cap rate
- 9.52%
- Cash-on-cash
- 11.53%
- DSCR
- 1.51
- GRM
- 6.9
CMA / ARV
- ARV (median comp)
- $394,399
- List price
- $375,000
- Delta
- -4.92%
- Verdict
- FAIR
- Comps
- 20 within 1.0 mi
Show comp detail 10 sales within ~0.75 mi
| Address | Dist | Beds/Ba | Sqft | Sold | Price | $/sf | Match |
|---|---|---|---|---|---|---|---|
| 857-859 Wilson Ave | 0.09mi | 6/— | 3,055 (-6%) | 13mo | $465,000 | $152 | 74 |
| 1339 Mooberry St | 0.44mi | 8/— | 3,398 (+4%) | 8mo | $170,000 | $50 | 66 |
| 885-887 Linwood Ave #885 | 0.04mi | 6/— | 2,927 (-10%) | 20mo | $515,000 | $176 | 65 |
| 961-963 Heyl Ave | 0.59mi | 6/— | 3,125 (-4%) | 1mo | $598,000 | $191 | 64 |
| 837 S Champion Ave #835 | 0.23mi | 6/— | 3,477 (+6%) | 19mo | $520,000 | $150 | 63 |
| 898-900 Berkeley Rd | 0.51mi | —/— | 3,143 (-4%) | 10mo | $340,000 | $108 | 62 |
| 654 Gilbert St | 0.49mi | 6/— | 3,416 (+4%) | 22mo | $535,000 | $157 | 51 |
| 631-633 S Champion Ave | 0.42mi | 6/— | 2,856 (-13%) | 15mo | $190,000 | $67 | 47 |
| 664 S Champion Ave | 0.37mi | 5/— | 2,858 (-12%) | 20mo | $465,000 | $163 | 45 |
| 429 Wilson Ave | 0.69mi | —/— | 2,856 (-13%) | 14mo | $425,000 | $149 | 35 |
Match score weights: distance 35% · size 25% · config 20% · recency 20%. Top-matched comps best support the ARV.
Projected returns pro-forma
-3.0% appreciation · 3.51% rent growth · sell at horizon
- IRR
- 1.5%
- Equity multiple
- 1.06×
- Total profit
- $5,884
- Equity at exit
- $55,914
- IRR
- 11.6%
- Equity multiple
- 1.93×
- Total profit
- $97,856
- Equity at exit
- $32,423
Cash invested: $105,000 (down + closing). Projections, not guarantees.
Landlord ↔ Tenant lean methodology
- Overall (STATE)
- 73 Landlord-Friendly
- State Ohio
- 73 Landlord-Friendly · R+6
- County
- — inherits STATE
- City
- — inherits STATE
ZIP-level market 43206
- Rents YoY
- 3.5%
- Active inventory
- 193
- Price-to-rent
- 15.5×
Monthly cashflow live
- Estimated rent
- $4,557 high interval (Pro) →
- Mortgage (P&I)
- −$1,967
- Tax est. 1.5%
- −$469 /mo · $5,625/yr
- Insurance
- −$156
- HOA
- −$0
- Vacancy / Maint / Mgmt
- −$957
- Net cashflow
- $1,008
Break-even live
2-unit breakdown (identical units grouped — click to expand)
| Units | Beds | Baths | Est. rent |
|---|---|---|---|
| 1× unit | 4 | 2 | $2,014 |
| 1× unit | 5 | 2 | $2,542 |
| Total (2 units) | $4,557 | ||
UW: 25.0% down · 7.5% · 30yr · 1.5% tax · 5.0% vac · 8.0% maint · 8.0% mgmt
Financing live
Cash to close
- Down payment
- $93,750
- Closing costs
- $11,250
- Reserves months
- —
- Total cash needed
- —
Loan-product check · same deal, 3 products live
Conventional
25% down · 7.5% · 30yr
- Down + closing
- —
- Monthly P&I
- —
- Monthly cashflow
- —
- DSCR
- —
- Eligible?
- —
Personal DTI + credit; lowest rate.
DSCR
20% down · 8.5% · 30yr
- Down + closing
- —
- Monthly P&I
- —
- Monthly cashflow
- —
- DSCR
- —
- Eligible?
- —
No personal income docs; deal must DSCR.
Hard money
10% down · 12.0% · 12mo
- Down + closing
- —
- Monthly P&I
- —
- Monthly cashflow
- —
- DSCR
- —
- Eligible?
- —
Short-term bridge; refi at stabilization.
Rent comps 14 comps
| Address | Beds | Baths | Sqft | Rent | $/sqft | DOM | Units | Dist |
|---|---|---|---|---|---|---|---|---|
| 1175 Studer Ave Columbus, OH | 1.0 | 1.0 | 2484 | $800 | $0.32 | 23d | 1 | 0.37mi |
| 683 S Champion Ave Unit 683 Columbus, OH | 3.0 | 1.0 | 2728 | $1,700 | $0.62 | 44d | 1 | 0.38mi |
| 698 S 22nd St Columbus, OH | 3.0 | 3.5 | 2400 | $2,500 | $1.04 | 44d | 1 | 0.44mi |
| 890 E Livingston Ave #892 Columbus, OH | 3.0 | 1.0 | 2430 | $1,400 | $0.58 | 12d | 1 | 0.48mi |
| 498 S Ohio Ave Unit A Columbus, OH | 2.0 | 1.0 | 2582 | $1,500 | $0.58 | 44d | 1 | 0.62mi |
| 484-488 E Columbus St Columbus, OH | 2.0 | 1.5 | 2316 | $1,650 | $0.71 | 44d | 1 | 0.98mi |
| 366 Berkeley Rd Columbus, OH | 2.0 | 1.0 | 2520 | $1,550 | $0.62 | 44d | 1 | 1.02mi |
| 1402 Fair Ave Columbus, OH | 3.0 | 2.5 | 2563 | $2,350 | $0.92 | 16d | 1 | 1.18mi |
| 316 E Deshler Ave Columbus, OH | 3.0 | 1.5 | 3701 | $2,600 | $0.70 | 23d | 1 | 1.24mi |
| 1445 E Broad St Columbus, OH | 1.0–5.0 | 1.0–5.0 | 2164 | $1,504 | $0.70 | 1d | 4 | 1.30mi |
| 47 S Monroe Ave Unit 49 Columbus, OH | 1.0 | 1.0 | 2476 | $1,695 | $0.68 | 44d | 1 | 1.33mi |
| 27 Winner Ave Unit 27B Columbus, OH | 1.0 | 1.0 | 3661 | $900 | $0.25 | 44d | 1 | 1.38mi |
| 172 Reinhard Ave Unit 172 Columbus, OH | 2.0 | 1.0 | 2656 | $1,900 | $0.72 | 44d | 1 | 1.41mi |
| 174 Reinhard Ave Columbus, OH | 2.0 | 1.0 | 2656 | $2,500 | $0.94 | 44d | 1 | 1.42mi |
Listing history 17 events
-
2026-06-15days on market $375,000 Active 132 DOM
-
2026-06-13days on market $375,000 Active 130 DOM
-
2026-06-13days on market $375,000 Active 129 DOM
-
2026-06-09days on market $375,000 Active 126 DOM
-
2026-06-08days on market $375,000 Active 125 DOM
-
2026-06-07days on market $375,000 Active 124 DOM
-
2026-06-05days on market $375,000 Active 121 DOM
-
2026-06-03days on market $375,000 Active 120 DOM
-
2026-06-02days on market $375,000 Active 119 DOM
-
2026-06-01days on market $375,000 Active 118 DOM
-
2026-05-31days on market $375,000 Active 117 DOM
-
2026-02-03$375,000 Active 960-char remark
Show marketing remark (960 chars)
Solid brick duplex in the heart of Southern Orchards with full occupancy & professional management already in place--ideal for a turnkey investor opportunity. Each side offers four- five bedrooms and 2 bathrooms, providing strong rental potential in a high-demand area. Recent updates include all-new HVAC systems in both units, upgraded electric service, and maintenance to the slate roof. Located just minutes from downtown Columbus, Nationwide Children's Hospital, and the revitalized Parsons Avenue corridor, the property is situated near dining, breweries, parks, and public transportation. Residents benefit from nearby attractions like Scioto Audubon Metro Park, Topiary Garden, and a vibrant calendar of community events. Southern Orchards continues to experience targeted redevelopment and institutional investment, making this a strategic long-term hold in one of Columbus's most promising growth zones. * Curb offers at this time- * See A2A *
-
2025-12-01historical
-
2025-11-10price $375,000
-
2025-09-25price $380,000
-
2025-09-09price $385,000
-
2025-07-23$400,000 Active
ⓘ Source: listings_history table (triggers on properties + properties_extension) + one-shot
backfill from property_details.listing_events for pre-trigger history.
Climate risk First Street
- Flood 3/10 Moderate FEMA zone X (unshaded) · 20% chance over 30 yrs
- Wildfire 1/10 Low
- Heat 4/10 Moderate 7 d/yr ≥100°F today · 18 d/yr by 30 yrs out
- Wind 2/10 Low 100% chance of damaging wind over 30 yrs
- Air quality 3/10 Moderate 2 unhealthy d/yr today · 3 by 30 yrs out
Nearby sold comps map
Loading sold comps map…
Walkable amenities ~0.75 mi
Loading nearby amenities…
Taxation est. · year 1
- Rental income
- $54,684
- − Mortgage interest
- −$21,006
- − Property taxes
- −$5,625
- − Insurance
- −$1,875
- − Repairs & maintenance
- −$4,375
- − Management
- −$4,375
- − Depreciation
- −$10,909
- Taxable income
- $6,520
- Est. tax owed @ 24.0%
- −$1,565
- After-tax cash flow
- $10,537/yr
For passive investors: Depreciation is non-cash, so a rental often shows a tax loss while cash-flowing — sheltering income. Rental losses are passive: they offset passive income freely, and up to $25,000/yr can offset ordinary (W-2) income if you actively participate and your MAGI is under $100k (phasing out to $0 by $150k); unused losses carry forward. On sale, claimed depreciation is recaptured at up to 25%, and gains may owe capital-gains tax (a 1031 exchange can defer both). Figures are a year-1 estimate at your 24.0% rate — not tax advice; consult a CPA.
Condition & rehab AI · 12 photos
This two-unit property requires moderate repairs and maintenance to improve its condition and value. Fresh paint, HVAC maintenance, and exterior siding repair would significantly enhance its curb appeal and rental potential.
Repairs flagged
- Major exterior siding — Significant wear and peeling
- Major interior walls — Peeling paint and wear
- Major flooring — Worn carpet and visible wear
Value-add opportunities
- Both paint job — Fresh paint enhances curb appeal and interior aesthetics
- Both HVAC maintenance — Fresh filters and maintenance improve air quality and energy efficiency
- Both exterior siding repair — Repairing peeling siding improves curb appeal and structural integrity
Renovation cost estimate screening
| Repair item | Severity | Est. cost |
|---|---|---|
| exterior siding · Significant wear and peeling | Major | $15,000–50,000 |
| interior walls · Peeling paint and wear | Major | $15,000–50,000 |
| flooring · Worn carpet and visible wear | Major | $15,000–50,000 |
| Total estimated repair cost · 3 items | $45,000–150,000 |
Value-add ROI direction
- Both paint job — Fresh paint enhances curb appeal and interior aesthetics ↑
- Both HVAC maintenance — Fresh filters and maintenance improve air quality and energy efficiency ↑
- Both exterior siding repair — Repairing peeling siding improves curb appeal and structural integrity ↑
ⓘ Cost ranges are severity-bucket heuristics (US national rule-of-thumb). Get contractor quotes + a written scope before underwriting a rehab budget.
Schools (NCES district)
- District
- Columbus City School District
- NCES district ID
- 3904380
- Math proficiency
- 15% ▼ -17.00%
- Reading proficiency
- 26% ▼ -12.00%
- Median HH income
- $38,483
- Composite
- 17.19/100
- National rank
- #9105
- State rank
- #626 of 656 in OH
Livability — Columbus
- Score
- 81/100
- State rank
- #97
- US rank
- #1491
Category grades
Schools grade is shown separately in the Schools card above.
Census & demographics
- Census place
- Columbus, OH
- County
- Franklin County · 1,351,780 people
- City population
- 612,189
- Metro
- Columbus, OH
- Population (ZIP)
- 21,996
- Household income
- $75,806
- Rent vs Own
- Severe rent burden
- 846.0
Population outlook (Franklin County) Hauer SSP2
- Today (2025)
- 1,456,139 people
- By 2030
- 1,556,890 · +6.9%
- By 2040
- 1,757,349 · +20.7%
- By 2050
- 1,950,539 · +34.0%
- By 2075
- 2,376,171 · +63.2%
- By 2100
- 2,636,796 · +81.1%
Race, ethnicity, and origin ACS 2023
- Neighborhood character
- Diverse neighborhood (Simpson 0.59)
- Race & ethnicity
- White 56% Black 31% Two or more races 9% Hispanic / Latino 4% Asian 1% Native American 1%
- Common ancestry
- Romanian 3% Slovak 2% Lithuanian 1%
- Foreign-born
- 4% · Canada
- Languages at home
- 96% English-only · Spanish 2% Other Indo-European 1%
Political lean MEDSL · Franklin
- 2024 margin
- Strong D (+28.4) · D 63.7% · R 35.3% · Other 1.0%
- 2008→2024 swing
- +7.7pp toward D · 2008: 20.7pp · 2024: 28.4pp
- All cycles
- 2024: D+28.4 2020: D+31.4 2016: D+25.9 2012: D+21.7 2008: D+20.7
Not yet ingested
- Civics
- —
Market trends
- HPI YoY
- ▼ -576.73%
- Current HPI
- 173.8569
- Rent YoY
- ▲ 3.51%
- Metro
- Columbus, OH
- State GDP YoY
- ▲ 1.98%
- F500 in state
- 48
Industry mix (Fortune 500 HQ in OH)
| Industry | F500 HQs | Revenue |
|---|---|---|
| Insurance | 3 | $145B |
|
||
| Industrial Machinery | 3 | $49B |
|
||
| Financial Services | 3 | $24B |
|
||
| Consumer Goods | 2 | $93B |
|
||
| Aerospace / Defense | 2 | $47B |
|
||
| Utilities | 2 | $33B |
|
||
Price history
-6.2% since first listed6 events — show timeline
- 2026-02-03 Listed $375,000 CBRMLS
- 2025-12-01 Listing Removed — CBRMLS
- 2025-11-10 Price Changed $375,000 CBRMLS
- 2025-09-25 Price Changed $380,000 CBRMLS
- 2025-09-09 Price Changed $385,000 CBRMLS
- 2025-07-23 Listed $400,000 CBRMLS
Cash-flow waterfall
monthlySold comps — $/sqft
last 12 mo · ≤1 miLoading sold comps…