6631 Rocky Point Rd NW · Roosevelt, MN
Flood risk 1/10 · Minimal
- FEMA flood zone
- X (unshaded)
- Chance of flooding over 30 yrs
- 0.0%
- Est. flood insurance / yr
- $473 – $860
Fire risk 4/10 · Minor
- Est. fire insurance / yr
- $888 – $1,650
Heat risk 1/10 · Minimal
- Hot days now (above 92°F)
- 7 days/yr
- Hot days in 30 yrs
- 13 days/yr
Wind risk 1/10 · Minimal
- Chance of severe wind over 30 yrs
- —
Air-quality risk 4/10 · Minor
- Unhealthy air days now
- 4 days/yr
- Unhealthy air days in 30 yrs
- 4 days/yr
Risk factors via First Street. Map © Google.
Why this score? — see what drove the B+ grade
The composite is a weighted blend of 9 inputs, each scored 0–100. Each bar is that input's sub-score; the figure is the points it added to the 100-point composite (weight × sub-score).
- Cash flow +30.0/30.0
- 1% rule +10.0/10.0
- DSCR +10.0/10.0
- ARV discount +7.5/15.0
- Appreciation +7.5/10.0
- Livability +3.2/5.0
- Schools +3.0/10.0
- Rent growth +2.5/5.0
- Condition / age +2.2/5.0
$59,900
🖨 Deal sheet 📄 Offer letter ✓ Due diligence
Listing remarks MLS
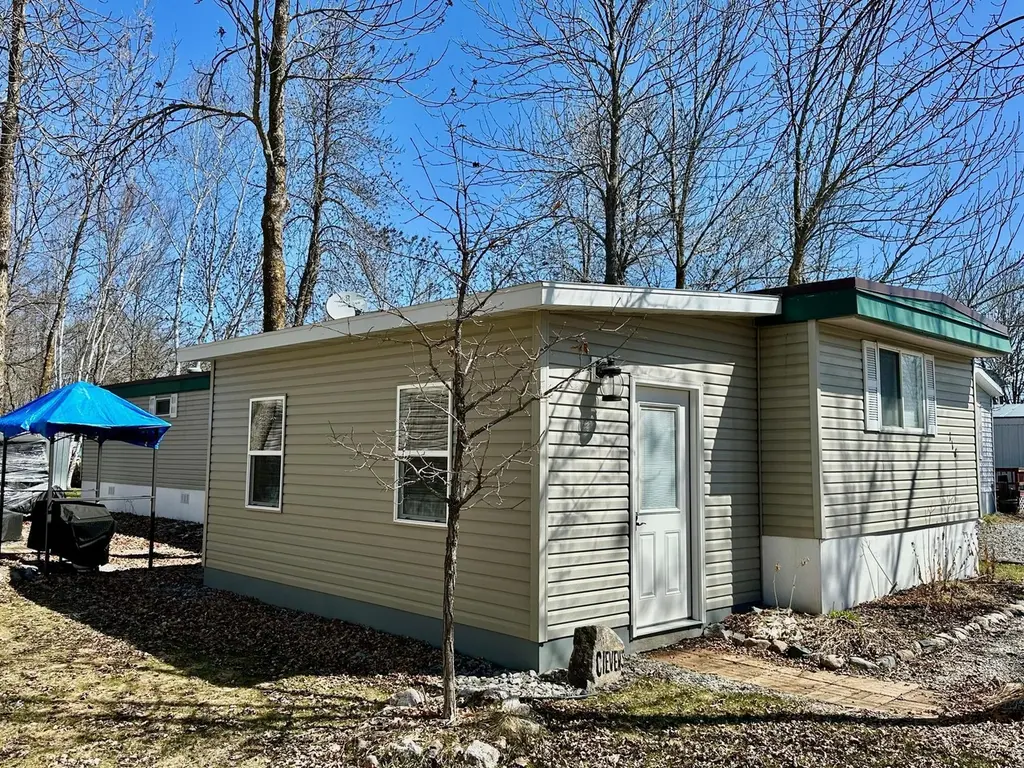
A Fishermans Paradise! Come have a look at this nicely renovated home at Rockey Point! The property offer 3 bedrooms, 1 bath, a spacious addition and a perfect place to tell the stories of the big one that got away! Property is on a rented lot and is ready for a new owner! Give us a call for more information.
Key facts
- Spacious addition
- 8,712 sq ft lot
- Built 1973
Tags
Neighborhood map
What this means for you Summary
Snapshot
- This is a 3-bed/1.0-bath single-family listed at $60k. Condition is rated fair.
Deal economics
- At list price, monthly cash flow is $584 ($7k/yr) — positive.
- The deal already cash-flows at list — no discount required.
- Meets the 1% rule at list price ($1k rent vs $60k).
- Recommended offer: $56k (6.0% below list) — sets the bar for market timing.
Location & tenants
- Location reads 65/100 on livability (#554 in MN) — a middle-class / working-renter tenant base. Strengths: cost of living A+, housing A+; Watch: crime C-, health & safety D+, schools D-.
- Lake Of The Woods School District (rural): math 30% / reading 39% proficiency, ranked #259 of 301 in MN (top 86%) — families likely to look elsewhere, expect single-tenant / working-renter base with shorter leases.
- Market conditions: 9 active listings in the ZIP; 13 units permitted in Lake of the Woods County in 2024 (0 in 5+ unit buildings).
Forward outlook
- In year one you build about $3k of equity ($414 loan paydown + $3k appreciation (5.0% local appreciation)).
- Lake of the Woods County population projected at -20% by 2050 — secular population decline; favor cash flow + early exit over multi-decade hold.
- At projected returns (5.0% appreciation + 3.0% rent growth), your $17k cash investment doubles in ~2 years — after that, you're playing with house money.
- By year 10, paydown + projected appreciation supports a ~$34k cash-out refi (75% LTV) — recoverable capital for the next deal without selling this one.
Negotiation context
- It's been on market 82 days — a 6% lower offer ($56k) is reasonable based on typical stale-listing flexibility.
- 3 sale attempts since 6y ago; this cycle's ask has dropped $5k (8%) from the opening price — seller is motivated, your offer sets the floor, not the list.
Questions for the listing agent
- It's been on market 82 days. Have you received any prior offers? Is the seller open to a 6% concession, seller financing, or rate buy-down credit?
- Have any recent inspections been done? Can we get a copy of the seller's disclosures and any deferred-maintenance estimates?
- Built in 1973 — when were the roof, HVAC, electrical panel, plumbing, and water heater last replaced?
- Why hasn't it sold? Are there any deal-killer items the seller is aware of (foundation, flood, title, zoning, code violations)?
- Is there a deadline driving the sale (1031 exchange, divorce, estate, relocation)? That informs how much negotiation room exists.
- Schools are D-rated, which usually means shorter tenancies and higher turnover. Who's the typical renter profile here, and what's been the actual vacancy rate?
- What's the average days-on-market for RENTAL listings here right now (not sales)? A rising rental-DOM trend means longer vacancies and softer asking-rent achievability than the comps imply.
- What's the recent tenant-quality profile in this submarket — average credit score on applications, eviction rate, late-payment / NSF rate, and stable-employment percentage? A property-management company in the area should have these aggregated.
- How much new for-sale + rental construction is in the pipeline within 1–3 miles? Heavy new supply typically softens prices + rents 12–24 months out; constrained supply supports both.
Investment metrics
- 1% rule
- 2.11% ✓
- Cap rate
- 17.99%
- Cash-on-cash
- 41.79%
- DSCR
- 2.86
- GRM
- 4.0
CMA / ARV
No comps found within radius.
Projected returns pro-forma
4.96% appreciation · 3.0% rent growth · sell at horizon
- IRR
- 49.9%
- Equity multiple
- 4.03×
- Total profit
- $50,891
- Equity at exit
- $33,803
- IRR
- 47.8%
- Equity multiple
- 8.26×
- Total profit
- $121,794
- Equity at exit
- $58,223
Cash invested: $16,772 (down + closing). Projections, not guarantees.
Landlord ↔ Tenant lean methodology
- Overall (STATE)
- 46 Balanced
- State Minnesota
- 46 Balanced · D+2
- County
- — inherits STATE
- City
- — inherits STATE
ZIP-level market 56673
- Home prices YoY
- 3.5%
- Active inventory
- 9
- Price-to-rent
- 4.0×
Monthly cashflow live
- Estimated rent
- $1,263 medium interval (Pro) →
- Mortgage (P&I)
- −$314
- Tax est. 1.5%
- −$75 /mo · $898/yr
- Insurance
- −$25
- HOA
- −$0
- Vacancy / Maint / Mgmt
- −$265
- Net cashflow
- $584
Break-even live
UW: 25.0% down · 7.5% · 30yr · 1.5% tax · 5.0% vac · 8.0% maint · 8.0% mgmt
Financing live
Cash to close
- Down payment
- $14,975
- Closing costs
- $1,797
- Reserves months
- —
- Total cash needed
- —
Loan-product check · same deal, 3 products live
Conventional
25% down · 7.5% · 30yr
- Down + closing
- —
- Monthly P&I
- —
- Monthly cashflow
- —
- DSCR
- —
- Eligible?
- —
Personal DTI + credit; lowest rate.
DSCR
20% down · 8.5% · 30yr
- Down + closing
- —
- Monthly P&I
- —
- Monthly cashflow
- —
- DSCR
- —
- Eligible?
- —
No personal income docs; deal must DSCR.
Hard money
10% down · 12.0% · 12mo
- Down + closing
- —
- Monthly P&I
- —
- Monthly cashflow
- —
- DSCR
- —
- Eligible?
- —
Short-term bridge; refi at stabilization.
Listing history 18 events
-
2026-05-11status Pending 310-char remark
Show marketing remark (310 chars)
A Fishermans Paradise! Come have a look at this nicely renovated home at Rockey Point! The property offer 3 bedrooms, 1 bath, a spacious addition and a perfect place to tell the stories of the big one that got away! Property is on a rented lot and is ready for a new owner! Give us a call for more information.
-
2026-05-02price $59,900 310-char remark
Show marketing remark (310 chars)
A Fishermans Paradise! Come have a look at this nicely renovated home at Rockey Point! The property offer 3 bedrooms, 1 bath, a spacious addition and a perfect place to tell the stories of the big one that got away! Property is on a rented lot and is ready for a new owner! Give us a call for more information.
-
2026-02-18$65,000 Active 310-char remark
Show marketing remark (310 chars)
A Fishermans Paradise! Come have a look at this nicely renovated home at Rockey Point! The property offer 3 bedrooms, 1 bath, a spacious addition and a perfect place to tell the stories of the big one that got away! Property is on a rented lot and is ready for a new owner! Give us a call for more information.
-
2025-11-25historical
-
2025-09-07price $64,900
-
2025-08-26price $69,900
-
2025-08-13price $74,900
-
2025-07-11price $79,900
-
2025-07-02price $82,900
-
2025-05-28price $87,900
-
2025-05-10price $89,900
-
2025-04-29price $94,900
-
2025-04-16price $99,900
-
2025-02-20$105,000 Active
-
2021-02-25price $84,900
-
2020-08-03soldstatus $70,000 Sold
-
2020-06-13historical
-
2020-04-29$90,000 Active
ⓘ Source: listings_history table (triggers on properties + properties_extension) + one-shot
backfill from property_details.listing_events for pre-trigger history.
Climate risk First Street
- Flood 1/10 Low FEMA zone X (unshaded) · 0% chance over 30 yrs
- Wildfire 4/10 Moderate
- Heat 1/10 Low 7 d/yr ≥92°F today · 13 d/yr by 30 yrs out
- Wind 1/10 Low
- Air quality 4/10 Moderate 4 unhealthy d/yr today · 4 by 30 yrs out
Nearby sold comps map
Loading sold comps map…
Walkable amenities ~0.75 mi
Loading nearby amenities…
Taxation est. · year 1
- Rental income
- $15,160
- − Mortgage interest
- −$3,355
- − Property taxes
- −$898
- − Insurance
- −$300
- − Repairs & maintenance
- −$1,213
- − Management
- −$1,213
- − Depreciation
- −$1,743
- Taxable income
- $6,438
- Est. tax owed @ 24.0%
- −$1,545
- After-tax cash flow
- $5,463/yr
For passive investors: Depreciation is non-cash, so a rental often shows a tax loss while cash-flowing — sheltering income. Rental losses are passive: they offset passive income freely, and up to $25,000/yr can offset ordinary (W-2) income if you actively participate and your MAGI is under $100k (phasing out to $0 by $150k); unused losses carry forward. On sale, claimed depreciation is recaptured at up to 25%, and gains may owe capital-gains tax (a 1031 exchange can defer both). Figures are a year-1 estimate at your 24.0% rate — not tax advice; consult a CPA.
Condition & rehab AI · 12 photos
A nicely renovated home with some cosmetic updates needed to enhance its curb appeal and resale value.
Repairs flagged
- Minor Paint — Light wear on interior walls
- Minor Siding — Light wear
Value-add opportunities
- Both Paint interior walls — Enhances curb appeal and interior aesthetics
- Both Paint exterior siding — Enhances curb appeal and exterior aesthetics
- Both Replace carpet with hardwood — Improves resale value and rental appeal
- Both Replace standard appliances with modern ones — Modernizes kitchen and improves resale value
- Both Replace standard windows with energy-efficient ones — Improves energy efficiency and curb appeal
Renovation cost estimate screening
| Repair item | Severity | Est. cost |
|---|---|---|
| Paint · Light wear on interior walls | Minor | $500–3,000 |
| Siding · Light wear | Minor | $500–3,000 |
| Total estimated repair cost · 2 items | $1,000–6,000 |
Value-add ROI direction
- Both Paint interior walls — Enhances curb appeal and interior aesthetics ↑
- Both Paint exterior siding — Enhances curb appeal and exterior aesthetics ↑
- Both Replace carpet with hardwood — Improves resale value and rental appeal ↑
- Both Replace standard appliances with modern ones — Modernizes kitchen and improves resale value ↑
- Both Replace standard windows with energy-efficient ones — Improves energy efficiency and curb appeal ↑
ⓘ Cost ranges are severity-bucket heuristics (US national rule-of-thumb). Get contractor quotes + a written scope before underwriting a rehab budget.
Schools (NCES district)
- District
- Lake Of The Woods School District
- NCES district ID
- 2717570
- Math proficiency
- 30% ▼ -9.00%
- Reading proficiency
- 39% ▼ -9.00%
- Median HH income
- $45,937
- Composite
- 29.52/100
- National rank
- #6498
- State rank
- #259 of 301 in MN
Livability — Roosevelt
- Score
- 65/100
- State rank
- #554
- US rank
- #13317
Category grades
Schools grade is shown separately in the Schools card above.
Census & demographics
- Population (ZIP)
- 608
Population outlook (Lake of the Woods County) Hauer SSP2
- Today (2025)
- 3,706 people
- By 2030
- 3,565 · -3.8%
- By 2040
- 3,224 · -13.0%
- By 2050
- 2,957 · -20.2%
- By 2075
- 2,685 · -27.5%
- By 2100
- 2,544 · -31.4%
Race, ethnicity, and origin ACS 2023
- Neighborhood character
- Predominantly White (94%)
- Race & ethnicity
- White 94% Two or more races 5%
- Common ancestry
- Portuguese 17% Lithuanian 7% Scottish 5%
- Languages at home
- 97% English-only · Russian/Polish/Slavic 3%
Political lean MEDSL · Lake of the Woods
- 2024 margin
- Solid R (+47.1) · D 25.8% · R 72.9% · Other 1.4%
- 2008→2024 swing
- -33.9pp toward R · 2008: -13.3pp · 2024: -47.1pp
- All cycles
- 2024: R+47.1 2020: R+42.9 2016: R+44.3 2012: R+20.1 2008: R+13.3
Not yet ingested
- Civics
- —
Market trends
- HPI YoY
- ▲ 4.96%
- Current HPI
- 146.8293
- Rent YoY
- —
- Metro
- —
- State GDP YoY
- ▲ 2.41%
- F500 in state
- 34
Industry mix (Fortune 500 HQ in MN)
| Industry | F500 HQs | Revenue |
|---|---|---|
| Healthcare | 2 | $407B |
|
||
| Retail | 2 | $150B |
|
||
| Consumer Goods | 2 | $32B |
|
||
| Industrial Machinery | 2 | $6B |
|
||
| Agriculture | 1 | $40B |
|
||
| Healthcare / Medical Devices | 1 | $32B |
|
||
Price history
-33.4% since first listed18 events — show timeline
- 2026-05-11 Pending — NORTHSTARMLS as Distributed by MLS Grid
- 2026-05-02 Price Changed $59,900 NORTHSTARMLS as Distributed by MLS Grid
- 2026-02-18 Listed $65,000 NORTHSTARMLS as Distributed by MLS Grid
- 2025-11-25 Listing Removed — NORTHSTARMLS as Distributed by MLS Grid
- 2025-09-07 Price Changed $64,900 NORTHSTARMLS as Distributed by MLS Grid
- 2025-08-26 Price Changed $69,900 NORTHSTARMLS as Distributed by MLS Grid
- 2025-08-13 Price Changed $74,900 NORTHSTARMLS as Distributed by MLS Grid
- 2025-07-11 Price Changed $79,900 NORTHSTARMLS as Distributed by MLS Grid
- 2025-07-02 Price Changed $82,900 NORTHSTARMLS as Distributed by MLS Grid
- 2025-05-28 Price Changed $87,900 NORTHSTARMLS as Distributed by MLS Grid
- 2025-05-10 Price Changed $89,900 NORTHSTARMLS as Distributed by MLS Grid
- 2025-04-29 Price Changed $94,900 NORTHSTARMLS as Distributed by MLS Grid
- 2025-04-16 Price Changed $99,900 NORTHSTARMLS as Distributed by MLS Grid
- 2025-02-20 Listed $105,000 NORTHSTARMLS as Distributed by MLS Grid
- 2021-02-25 Price Changed $84,900 NORTHSTARMLS as Distributed by MLS Grid
- 2020-08-03 Sold (MLS) $70,000 NORTHSTARMLS as Distributed by MLS Grid
- 2020-06-13 Listing Removed — NORTHSTARMLS as Distributed by MLS Grid
- 2020-04-29 Listed $90,000 NORTHSTARMLS as Distributed by MLS Grid
Cash-flow waterfall
monthlySold comps — $/sqft
last 12 mo · ≤1 miLoading sold comps…