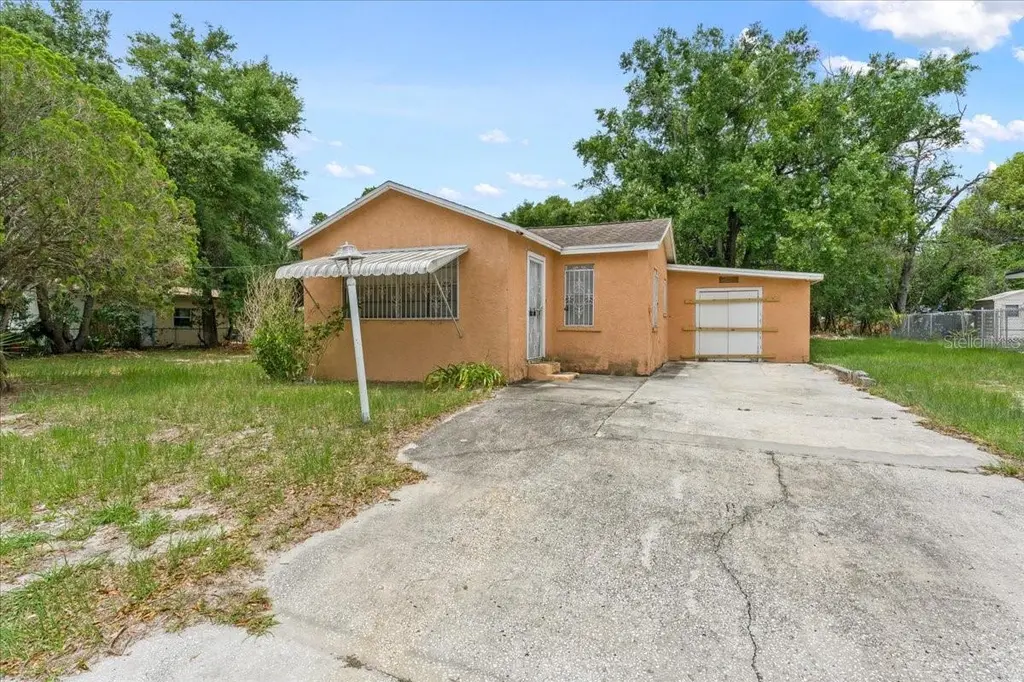
3816 N 52nd St · Tampa, FL
Flood risk 1/10 · Minimal
- FEMA flood zone
- X (unshaded)
- Chance of flooding over 30 yrs
- 0.0%
- Est. flood insurance / yr
- $507 – $1,088
Fire risk 1/10 · Minimal
- Est. fire insurance / yr
- $947 – $1,759
Heat risk 10/10 · Severe
- Hot days now (above 108°F)
- 7 days/yr
- Hot days in 30 yrs
- 27 days/yr
Wind risk 9/10 · Severe
- Chance of severe wind over 30 yrs
- 99.0%
Air-quality risk 3/10 · Minor
- Unhealthy air days now
- 3 days/yr
- Unhealthy air days in 30 yrs
- 4 days/yr
Risk factors via First Street. Map © Google.
Why this score? — see what drove the C- grade
The composite is a weighted blend of 9 inputs, each scored 0–100. Each bar is that input's sub-score; the figure is the points it added to the 100-point composite (weight × sub-score).
- Cash flow +20.7/30.0
- ARV discount +7.5/15.0
- DSCR +6.6/10.0
- 1% rule +5.1/10.0
- Schools +4.2/10.0
- Livability +4.0/5.0
- Condition / age +2.5/5.0
- Rent growth +2.2/5.0
- Appreciation +0.0/10.0
$199,900
🖨 Deal sheet 📄 Offer letter ✓ Due diligence
Listing remarks MLS
Cozy 3 bedroom, 2 bath, 1 car carport frame and stucco home. Just minutes to I-4, I-75, Ybor City, Tampa, shopping, restaraunts and more. This is a Fannie Mae HomePath property. Purchase this property for aslittle as 3% down! This property is approved for Home Path Renovation Mortgage. Close by October 31, 2011 and receive up to 3.5% of the final sales price to be used for closing cost assistance! Ask your agent or our office for more details. Eligibility restrictions apply
Key facts
- Attached residential
- New construction
- Double lot
Tags
Property features AI
Finance
- Other: Property zoned RM-16; Property type: Residential — Single Family Residence; Lot acreage: between 1/4 and less than 1/2 acre; Universal property identifier available; Unfurnished
- Financial info: No lease restrictions; Tax information available separately
- HOA & community: No HOA/association
Exterior
- Parking: No parking information provided
- Security: No security features specified
- Utilities: Public water; Public sewer; Broadband/high-speed internet available; Cable available; Electricity connected; Sewer connected; Water connected
- Home design: Single-family residence; One-story; East-facing
- Construction: Stucco and frame construction; Other roof type; Pillar/post/pier foundation; Built area approximately 1,532 total; living area approximately 1,320
- Exterior features: Paved road access; Lot dimensions approximately 100 x 107 (0.25 acre)
Interior
- Kitchen: No appliances listed
- Bedrooms: 3 bedrooms
- Flooring: Laminate flooring
- Bathrooms: 2 full bathrooms
- Heating & cooling: Central heating; Central air conditioning
- Interior features: No interior features specified
- Laundry & utility: Outdoor laundry
Neighborhood map
What this means for you Summary
Snapshot
- This is a 3-bed/2.0-bath single-family listed at $200k.
Deal economics
- At list price, monthly cash flow is $270 ($3k/yr) — positive.
- The deal already cash-flows at list — no discount required.
- Meets the 1% rule at list price ($2k rent vs $200k).
Location & tenants
- Location reads 79/100 on livability (#142 in FL, #2,135 nationally) — a middle-class / working-renter tenant base. Strengths: commute A+, housing A+, health & safety A+; Watch: schools C-, crime D+.
- Hillsborough (suburban): math 47% / reading 50% proficiency, ranked #41 of 73 in FL (top 56%) — families likely to look elsewhere, expect single-tenant / working-renter base with shorter leases.
- Market conditions: Rents soft (-1.1%/yr); 242 active listings in the ZIP; 22 comparable units currently listed for rent nearby; rentals at typical pace (median 24d on market — plan ~3-4 weeks tenant-placement turnaround); 9,053 units permitted in Hillsborough County in 2024 (4,555 in 5+ unit buildings).
- This rent runs 37% of the median local income ($66k/yr) — at the standard rent-burdened threshold; future hikes will face affordability resistance.
Forward outlook
- Local home prices are declining (-3.0%/yr); year-one equity from $1k of loan paydown is wiped out by about $6k of value loss. Plan a longer hold.
- Hillsborough County population projected at +37% by 2050 — long-run rental-demand tailwind backs the buy-and-hold thesis.
Negotiation context
- Only 7 days on market — expect competitive offers; lowballing is unlikely to land.
- 2 sale attempts since 16y ago with the ask held roughly flat each time — persistent listings suggest the price (not the market) is what's stuck; bring a comps-based counter.
- Current owner paid $27k; list at $200k implies a 640% gain — meaningful room to come down on a strong offer.
Risks & watch-outs
- Watch-outs: built in 1947 — expect roof / HVAC / electrical / plumbing capex.
- Climate carrying-cost: severe wind risk, 99% chance of damaging wind over 30y; extreme-heat days projected 7→27/yr by 2055 (HVAC capex compounding) — expect insurance premiums to compound above CPI over the hold.
Questions for the listing agent
- Built in 1947 — when were the roof, HVAC, electrical panel, plumbing, and water heater last replaced?
- Is there a deadline driving the sale (1031 exchange, divorce, estate, relocation)? That informs how much negotiation room exists.
- Crime grade is D in this area — have there been break-ins, vandalism, or insurance claims at this property in the last 3 years? What carrier currently insures it and at what premium?
- What's the average days-on-market for RENTAL listings here right now (not sales)? A rising rental-DOM trend means longer vacancies and softer asking-rent achievability than the comps imply.
- What's the recent tenant-quality profile in this submarket — average credit score on applications, eviction rate, late-payment / NSF rate, and stable-employment percentage? A property-management company in the area should have these aggregated.
- How much new for-sale + rental construction is in the pipeline within 1–3 miles? Heavy new supply typically softens prices + rents 12–24 months out; constrained supply supports both.
Investment metrics
- 1% rule
- 1.01% ✓
- Cap rate
- 7.91%
- Cash-on-cash
- 5.78%
- DSCR
- 1.26
- GRM
- 8.2
CMA / ARV
No comps found within radius.
Projected returns pro-forma
-3.0% appreciation · 0.0% rent growth · sell at horizon
- IRR
- -10.7%
- Equity multiple
- 0.62×
- Total profit
- $-21,159
- Equity at exit
- $29,806
- IRR
- -6.1%
- Equity multiple
- 0.66×
- Total profit
- $-19,253
- Equity at exit
- $17,284
Cash invested: $55,972 (down + closing). Projections, not guarantees.
Landlord ↔ Tenant lean methodology
- Overall (STATE)
- 87 Strongly Landlord-Friendly
- State Florida
- 87 Strongly Landlord-Friendly · R+3
- County
- — inherits STATE
- City
- — inherits STATE
ZIP-level market 33619
- Home prices YoY
- -30.2%
- Rents YoY
- -1.1%
- Active inventory
- 242
- Price-to-rent
- 8.2×
Monthly cashflow live
- Estimated rent
- $2,025 high interval (Pro) →
- Mortgage (P&I)
- −$1,048
- Tax from tax record
- −$198 /mo · $2,381/yr
- Insurance
- −$83
- HOA
- −$0
- Vacancy / Maint / Mgmt
- −$425
- Net cashflow
- $270
Break-even live
UW: 25.0% down · 7.5% · 30yr · 1.5% tax · 5.0% vac · 8.0% maint · 8.0% mgmt
Financing live
Cash to close
- Down payment
- $49,975
- Closing costs
- $5,997
- Reserves months
- —
- Total cash needed
- —
Loan-product check · same deal, 3 products live
Conventional
25% down · 7.5% · 30yr
- Down + closing
- —
- Monthly P&I
- —
- Monthly cashflow
- —
- DSCR
- —
- Eligible?
- —
Personal DTI + credit; lowest rate.
DSCR
20% down · 8.5% · 30yr
- Down + closing
- —
- Monthly P&I
- —
- Monthly cashflow
- —
- DSCR
- —
- Eligible?
- —
No personal income docs; deal must DSCR.
Hard money
10% down · 12.0% · 12mo
- Down + closing
- —
- Monthly P&I
- —
- Monthly cashflow
- —
- DSCR
- —
- Eligible?
- —
Short-term bridge; refi at stabilization.
Rent comps 22 comps
| Address | Beds | Baths | Sqft | Rent | $/sqft | DOM | Units | Dist |
|---|---|---|---|---|---|---|---|---|
| 3716 N 52nd St Tampa, FL | 3.0 | 1.0 | 1152 | $1,650 | $1.43 | 24d | 1 | 0.14mi |
| 3716 N 52nd St Tampa, FL | 3.0 | 1.0 | 1152 | $1,650 | $1.43 | 5d | 1 | 0.14mi |
| 3716 N 52nd St Tampa, FL | 3.0 | 1.0 | 1152 | $1,650 | $1.43 | 10d | 1 | 0.14mi |
| 3706 N 52nd St #1 Tampa, FL | 3.0 | 2.5 | 1334 | $2,500 | $1.87 | 2d | 1 | 0.19mi |
| 3611 N 54th St Unit 3 Tampa, FL | 3.0 | 2.0 | 1126 | $1,895 | $1.68 | 2d | 1 | 0.34mi |
| 3417 Temple St Unit B Tampa, FL | 3.0 | 2.0 | 975 | $1,600 | $1.64 | 24d | 1 | 0.42mi |
| 3420 N 55th St Unit B Tampa, FL | 3.0 | 1.0 | 1095 | $1,500 | $1.37 | 24d | 1 | 0.43mi |
| 4403 N 48th St Tampa, FL | 4.0 | 2.0 | 1387 | $2,500 | $1.80 | 24d | 1 | 0.46mi |
| 3212 N 50th St Unit B Tampa, FL | 3.0 | 2.0 | 1005 | $2,200 | $2.19 | 14d | 1 | 0.59mi |
| 4481 Rachel Falls Dr Tampa, FL | 3.0 | 2.5 | 1464 | $2,350 | $1.61 | 24d | 1 | 0.74mi |
| 5318 E 18th Ave Tampa, FL | 4.0 | 2.0 | 1270 | $1,955 | $1.54 | 24d | 1 | 0.87mi |
| 2925 N 46th St Unit B Tampa, FL | 2.0 | 1.0 | 1120 | $1,103 | $0.98 | 24d | 1 | 0.88mi |
| 4501 N 39th St Tampa, FL | 4.0 | 1.0 | 1072 | $1,595 | $1.49 | 21d | 1 | 1.16mi |
| 3724 E 38th Ave Tampa, FL | 3.0 | 2.0 | 1188 | $1,895 | $1.60 | 24d | 1 | 1.17mi |
| 3705 E North Bay St Tampa, FL | 3.0 | 2.0 | 969 | $1,850 | $1.91 | 3d | 1 | 1.22mi |
| 3910 E Ellicott St Tampa, FL | 2.0 | 1.0 | 950 | $1,800 | $1.89 | 24d | 1 | 1.26mi |
| 6514 Travis Blvd Tampa, FL | 3.0 | 2.0 | 1200 | $3,200 | $2.67 | 24d | 1 | 1.38mi |
| 3507 E 29th Ave Tampa, FL | 3.0 | 2.0 | 928 | $1,700 | $1.83 | 24d | 1 | 1.38mi |
| 5203 N 39th St Tampa, FL | 4.0 | 2.0 | 1600 | $2,100 | $1.31 | 2d | 1 | 1.40mi |
| 3517 Bishop Eddie Newkirk Way Tampa, FL | 3.0 | 2.0 | 1200 | $2,500 | $2.08 | 24d | 1 | 1.41mi |
| 3511 Bishop Eddie Newkirk Way Tampa, FL | 3.0 | 1.0 | 1056 | $1,800 | $1.70 | 24d | 1 | 1.43mi |
| 3511 Bishop Eddie Newkirk Way Tampa, FL | 3.0 | 1.0 | 1056 | $1,800 | $1.70 | 10d | 1 | 1.43mi |
Listing history 7 events
-
2026-06-13statusdays on market $199,900 Pending 7 DOM
-
2026-06-09days on market $199,900 Active 5 DOM
-
2026-06-08days on market $199,900 Active 4 DOM
-
2026-06-07remarks 692-char remark
-
2026-06-07days on market $199,900 Active 3 DOM
-
2026-06-04remarks 563-char remark
-
2026-06-04$199,900 Active 1 DOM
ⓘ Source: listings_history table (triggers on properties + properties_extension) + one-shot
backfill from property_details.listing_events for pre-trigger history.
Tax reassessment forecast FL · Resets to sale price
- Current annual tax
- $2,381 · $198/mo
- Projected year-2 tax
- $2,381 · $198/mo
- Expected delta
- $0/yr ($0/mo · 0.0%)
ⓘ Screening estimate from a state-policy table — verify with the county assessor before closing.
Climate risk First Street
- Flood 1/10 Low FEMA zone X (unshaded) · 0% chance over 30 yrs
- Wildfire 1/10 Low
- Heat 10/10 Extreme 7 d/yr ≥108°F today · 27 d/yr by 30 yrs out
- Wind 9/10 Extreme 99% chance of damaging wind over 30 yrs
- Air quality 3/10 Moderate 3 unhealthy d/yr today · 4 by 30 yrs out
Nearby sold comps map
Loading sold comps map…
Walkable amenities ~0.75 mi
Loading nearby amenities…
Taxation est. · year 1
- Rental income
- $24,297
- − Mortgage interest
- −$11,198
- − Property taxes
- −$2,381
- − Insurance
- −$1,000
- − Repairs & maintenance
- −$1,944
- − Management
- −$1,944
- − Depreciation
- −$5,815
- Taxable income
- $16
- Est. tax owed @ 24.0%
- −$4
- After-tax cash flow
- $3,231/yr
For passive investors: Depreciation is non-cash, so a rental often shows a tax loss while cash-flowing — sheltering income. Rental losses are passive: they offset passive income freely, and up to $25,000/yr can offset ordinary (W-2) income if you actively participate and your MAGI is under $100k (phasing out to $0 by $150k); unused losses carry forward. On sale, claimed depreciation is recaptured at up to 25%, and gains may owe capital-gains tax (a 1031 exchange can defer both). Figures are a year-1 estimate at your 24.0% rate — not tax advice; consult a CPA.
Schools (NCES district)
- District
- Hillsborough
- NCES district ID
- 1200870
- Math proficiency
- 47% ▼ -8.00%
- Reading proficiency
- 50% ▼ -4.00%
- Median HH income
- $50,622
- Composite
- 41.6/100
- National rank
- #3435
- State rank
- #41 of 73 in FL
Livability — Tampa
- Score
- 79/100
- State rank
- #142
- US rank
- #2135
Category grades
Schools grade is shown separately in the Schools card above.
Census & demographics
- Census place
- Tampa, FL
- County
- Hillsborough County · 1,540,968 people
- City population
- 523,346
- Metro
- Tampa-St. Petersburg-Clearwater, FL
- Population (ZIP)
- 41,396
- Household income
- $66,134
- Rent vs Own
- Severe rent burden
- 2006.0
Population outlook (Hillsborough County) Hauer SSP2
- Today (2025)
- 1,607,022 people
- By 2030
- 1,733,968 · +7.9%
- By 2040
- 1,979,565 · +23.2%
- By 2050
- 2,203,427 · +37.1%
- By 2075
- 2,667,893 · +66.0%
- By 2100
- 2,891,558 · +79.9%
Race, ethnicity, and origin ACS 2023
- Neighborhood character
- Highly diverse neighborhood (Simpson 0.72)
- Race & ethnicity
- Hispanic / Latino 36% Black 28% White 27% Two or more races 21% Asian 3%
- Hispanic origin (detail)
- Mexican 5% Puerto Rican 13% Cuban 11% Dominican 1%
- Common ancestry
- Hispanic 2% Iranian 1% Italian 1%
- Foreign-born
- 22% · Canada, Jamaica, Vietnam
- Languages at home
- 64% English-only · Spanish 28% Other Indo-European 1% French/Haitian/Cajun 1%
Political lean MEDSL · Hillsborough
- 2024 margin
- Toss-up / Even · D 47.8% · R 50.9% · Other 1.3%
- 2008→2024 swing
- -10.2pp toward R · 2008: 7.1pp · 2024: -3.1pp
- All cycles
- 2024: R+3.1 2020: D+6.9 2016: D+6.8 2012: D+6.7 2008: D+7.1
Not yet ingested
- Civics
- —
Market trends
- HPI YoY
- ▼ -162.52%
- Current HPI
- 375.4923
- Rent YoY
- ▼ -1.14%
- Metro
- Tampa-St. Petersburg-Clearwater, FL
- State GDP YoY
- ▲ 3.28%
- F500 in state
- 36
Industry mix (Fortune 500 HQ in FL)
| Industry | F500 HQs | Revenue |
|---|---|---|
| Industrial Technology | 2 | $29B |
|
||
| Insurance | 2 | $17B |
|
||
| Retail | 1 | $60B |
|
||
| Technology Distribution | 1 | $58B |
|
||
| Homebuilding | 1 | $35B |
|
||
| Technology Manufacturing | 1 | $35B |
|
||
Price history
+1380.7% since first listed5 events — show timeline
- 2026-06-04 Listed $199,900 Stellar MLS as Distributed by MLS Grid
- 2011-06-30 Sold (MLS) $27,000 Stellar MLS as Distributed by MLS Grid
- 2010-10-04 Listed $31,900 Stellar MLS as Distributed by MLS Grid
- 1981-01-01 Sold (Public Records) $13,500 Public Records
- 1975-01-01 Sold (Public Records) $13,500 Public Records
Property tax history
+9.7%/yrLatest (2025): $2,381 · +11.0% YoY. Source: county tax records.
Cash-flow waterfall
monthlySold comps — $/sqft
last 12 mo · ≤1 miLoading sold comps…