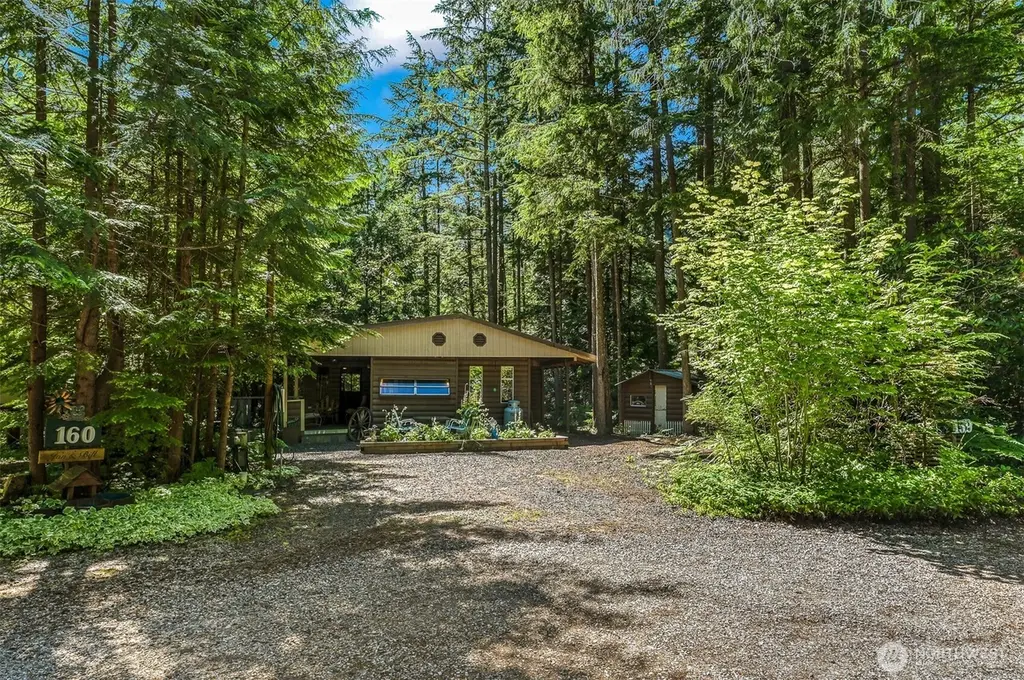
1159 Alder Ln · Peaceful Valley, WA
Flood risk 5/10 · Moderate
- FEMA flood zone
- X (unshaded)
- Chance of flooding over 30 yrs
- 0.66%
- Est. flood insurance / yr
- $507 – $1,088
Fire risk 4/10 · Minor
- Est. fire insurance / yr
- $604 – $1,122
Heat risk 2/10 · Minimal
- Hot days now (above 87°F)
- 8 days/yr
- Hot days in 30 yrs
- 18 days/yr
Wind risk 1/10 · Minimal
- Chance of severe wind over 30 yrs
- —
Air-quality risk 7/10 · Major
- Unhealthy air days now
- 12 days/yr
- Unhealthy air days in 30 yrs
- 12 days/yr
Risk factors via First Street. Map © Google.
Why this score? — see what drove the B- grade
The composite is a weighted blend of 9 inputs, each scored 0–100. Each bar is that input's sub-score; the figure is the points it added to the 100-point composite (weight × sub-score).
- Cash flow +30.0/30.0
- 1% rule +10.0/10.0
- DSCR +10.0/10.0
- ARV discount +7.5/15.0
- Schools +4.2/10.0
- Livability +3.0/5.0
- Rent growth +2.5/5.0
- Condition / age +2.5/5.0
- Appreciation +0.0/10.0
$50,000
🖨 Deal sheet (PDF) 📄 Offer letter ✓ Due diligence
Listing remarks
Escape to your own private woodland retreat! This charming cabin is filled with warmth and character, featuring stunning handcrafted yellow and red cedar interiors that create the perfect cozy getaway atmosphere. Designed for gathering and relaxation, the home offers a spacious dining area, an inviting living room, and two additional rooms, with plenty of space for guests to spread out comfortably. Start your mornings with coffee in the sunny kitchen nook or unwind on the front porch surrounded by peaceful forest views. Nestled on a private corner lot in a quiet cul-de-sac, the property invites you to enjoy evenings around the fire under the stars. With sleeping space for 6+ guests and furn
Key facts
- Quiet cul-de-sac
- Front porch
- Inviting living room
Tags
Property features AI
Finance
- Other: Located in Paradise Lakes Country Club (directions: Hwy 542 to 547, left into Paradise Lakes Country Club); Bus service nearby (route 72x)
- Financial info: Listing terms: Cash
- HOA & community: Has HOA with quarterly fee (fee covers common area maintenance, internet, road maintenance, security, sewer, snow removal, trash); Community features include CCRs, club house, playground, and trails; Association contact: Melonie
Exterior
- Parking: Driveway; RV parking
- Security: Gated community; Security gate and security service
- Utilities: Electric energy source; Community water; Septic tank sewer; Xfinity cable; Xfinity internet; Power billed through HOA (PSE)
- Home design: Single-family residence, one story; Built on lot / manufactured home; Main level entry; Has a view; Facing level topography
- Construction: Built about 2000 (effective year); Wood construction; Metal roof; Pillar/post/pier foundation
- Exterior features: Wood products siding; Garden space; Outbuildings; Located on a cul-de-sac; RV parking; Cable TV available; High-speed internet available; Propane available
Interior
- Kitchen: Refrigerator; Stove/Range; Kitchen with eating space
- Bedrooms: 4 bedrooms (all on the main level); Primary bedroom (main level)
- Flooring: Hardwood floors
- Bathrooms: 1 full bathroom (main level) with bathtub and shower
- Heating & cooling: Forced air heating; No central cooling
- Interior features: Dining room; Fireplace (electric)
Neighborhood map
What this means for you Summary
Snapshot
- This is a 1-bed/1.0-bath other listed at $50k.
Deal economics
- At list price, monthly cash flow is $743 ($9k/yr) — positive.
- The deal already cash-flows at list — no discount required.
- Meets the 1% rule at list price ($2k rent vs $50k).
- Recommended offer: $48k (3.0% below list) — sets the bar for market timing.
- Cap rate 24.1% vs local median 4.3% in Peaceful Valley — top-decile yield for the area; either an underpriced asset or a hidden risk that comps aren't pricing in. Stress-test before assuming the spread holds.
Location & tenants
- Location reads 60/100 on livability (#453 in WA) — a middle-class / working-renter tenant base. Strengths: cost of living A, housing A-; Watch: commute C-, health & safety D, amenities F.
- Mount Baker School District (rural): math 40% / reading 53% proficiency, ranked #165 of 291 in WA (top 57%) — families likely to look elsewhere, expect single-tenant / working-renter base with shorter leases.
- Zoned schools: Kendall Elementary (327 students, 79% FRL); Mount Baker Junior High (278 students, 58% FRL); Mount Baker Senior High (517 students, 47% FRL).
- Market conditions: 63 active listings in the ZIP; 1,190 units permitted in Whatcom County in 2024 (327 in 5+ unit buildings).
Forward outlook
- Local home prices are declining (-3.0%/yr); year-one equity from $346 of loan paydown is wiped out by about $2k of value loss. Plan a longer hold.
- Whatcom County population projected at +28% by 2050 — long-run rental-demand tailwind backs the buy-and-hold thesis.
- At projected returns (-3.0% appreciation + 3.0% rent growth), your $14k cash investment doubles in ~2 years — after that, you're playing with house money.
Negotiation context
- It's been on market 31 days — a 3% lower offer ($48k) is reasonable based on typical stale-listing flexibility.
- 2 sale attempts since 4y ago with the ask held roughly flat each time — persistent listings suggest the price (not the market) is what's stuck; bring a comps-based counter.
Risks & watch-outs
- Climate carrying-cost: moderate flood risk — expect insurance premiums to compound above CPI over the hold.
Questions for the listing agent
- It's been on market 31 days. Have you received any prior offers? Is the seller open to a 3% concession, seller financing, or rate buy-down credit?
- What does the HOA fee cover, when was the last increase, and are there any pending special assessments or reserve-fund shortfalls?
- Is there a deadline driving the sale (1031 exchange, divorce, estate, relocation)? That informs how much negotiation room exists.
- Schools are F-rated, which usually means shorter tenancies and higher turnover. Who's the typical renter profile here, and what's been the actual vacancy rate?
- What's the average days-on-market for RENTAL listings here right now (not sales)? A rising rental-DOM trend means longer vacancies and softer asking-rent achievability than the comps imply.
- What's the recent tenant-quality profile in this submarket — average credit score on applications, eviction rate, late-payment / NSF rate, and stable-employment percentage? A property-management company in the area should have these aggregated.
- How much new for-sale + rental construction is in the pipeline within 1–3 miles? Heavy new supply typically softens prices + rents 12–24 months out; constrained supply supports both.
Investment metrics
- 1% rule
- 3.10% ✓
- Cap rate
- 24.13%
- Cash-on-cash
- 63.70%
- DSCR
- 3.83
- GRM
- 2.7
CMA / ARV
No comps found within radius.
Projected returns pro-forma
-3.0% appreciation · 3.0% rent growth · sell at horizon
- IRR
- 62.8%
- Equity multiple
- 3.81×
- Total profit
- $39,335
- Equity at exit
- $7,455
- IRR
- 67.3%
- Equity multiple
- 7.83×
- Total profit
- $95,630
- Equity at exit
- $4,323
Cash invested: $14,000 (down + closing). Projections, not guarantees.
Landlord ↔ Tenant lean methodology
- Overall (STATE)
- 28 Tenant-Leaning
- State Washington
- 28 Tenant-Leaning · D+8
- County
- — inherits STATE
- City
- — inherits STATE
ZIP-level market 98266
- Home prices YoY
- -14.9%
- Active inventory
- 63
- Price-to-rent
- 2.7×
Monthly cashflow live
- Estimated rent
- $1,549 medium interval (Pro) →
- Mortgage (P&I)
- −$262
- Tax from tax record
- −$31 /mo · $369/yr
- Insurance
- −$21
- HOA
- −$167
- Vacancy / Maint / Mgmt
- −$325
- Net cashflow
- $743
Break-even live
Sensitivity live
| Price | -10% $771 | -5% $757 | +0% $743 | +5% $729 | +10% $715 |
|---|---|---|---|---|---|
| Rent | -10% $621 | -5% $682 | +0% $743 | +5% $804 | +10% $866 |
| Rate | -1.0pp $768 | -0.5pp $756 | base $743 | +0.5pp $730 | +1.0pp $717 |
UW: 25.0% down · 7.5% · 30yr · 1.5% tax · 5.0% vac · 8.0% maint · 8.0% mgmt
Financing live
Cash to close
- Down payment
- $12,500
- Closing costs
- $1,500
- Reserves months
- —
- Total cash needed
- —
Loan-product check · same deal, 3 products live
Conventional
25% down · 7.5% · 30yr
- Down + closing
- —
- Monthly P&I
- —
- Monthly cashflow
- —
- DSCR
- —
- Eligible?
- —
Personal DTI + credit; lowest rate.
DSCR
20% down · 8.5% · 30yr
- Down + closing
- —
- Monthly P&I
- —
- Monthly cashflow
- —
- DSCR
- —
- Eligible?
- —
No personal income docs; deal must DSCR.
Hard money
10% down · 12.0% · 12mo
- Down + closing
- —
- Monthly P&I
- —
- Monthly cashflow
- —
- DSCR
- —
- Eligible?
- —
Short-term bridge; refi at stabilization.
HOA detail
- Monthly dues
- $167 · $2,004/yr
Listing history 20 events
-
2026-06-22days on market $50,000 Active 31 DOM
-
2026-06-18days on market $50,000 Active 28 DOM
-
2026-06-17days on market $50,000 Active 27 DOM
-
2026-06-16days on market $50,000 Active 26 DOM
-
2026-06-15days on market $50,000 Active 25 DOM
-
2026-06-14days on market $50,000 Active 23 DOM
-
2026-06-13days on market $50,000 Active 22 DOM
-
2026-06-10days on market $50,000 Active 20 DOM
-
2026-06-09days on market $50,000 Active 19 DOM
-
2026-06-08days on market $50,000 Active 18 DOM
-
2026-06-07days on market $50,000 Active 17 DOM
-
2026-06-05days on market $50,000 Active 14 DOM
-
2026-06-02days on market $50,000 Active 12 DOM
-
2026-06-01days on market $50,000 Active 11 DOM
-
2026-05-31days on market $50,000 Active 10 DOM
-
2026-05-30days on market $50,000 Active 9 DOM
-
2026-05-21$50,000 Active
-
2022-08-03soldstatus $47,000 Closed
-
2022-07-17status Pending
-
2022-07-14$45,000 Active
ⓘ Source: listings_history table (triggers on properties + properties_extension) + one-shot
backfill from property_details.listing_events for pre-trigger history.
Tax reassessment forecast WA · Resets to sale price
- Current annual tax
- $369 · $31/mo
- Projected year-2 tax
- $490 · $41/mo
- Expected delta
- +$121/yr (+$10/mo · 32.9%)
ⓘ Screening estimate from a state-policy table — verify with the county assessor before closing.
Climate risk First Street
- Flood 5/10 Major FEMA zone X (unshaded) · 66% chance over 30 yrs
- Wildfire 4/10 Moderate
- Heat 2/10 Low 8 d/yr ≥87°F today · 18 d/yr by 30 yrs out
- Wind 1/10 Low
- Air quality 7/10 Severe 12 unhealthy d/yr today · 12 by 30 yrs out
Nearby sold comps map
Loading sold comps map…
Walkable amenities ~0.75 mi
Loading nearby amenities…
Taxation est. · year 1
- Rental income
- $18,591
- − Mortgage interest
- −$2,801
- − Property taxes
- −$369
- − Insurance
- −$250
- − Repairs & maintenance
- −$1,487
- − Management
- −$1,487
- − HOA
- −$2,004
- − Depreciation
- −$1,455
- Taxable income
- $8,738
- Est. tax owed @ 24.0%
- −$2,097
- After-tax cash flow
- $6,820/yr
For passive investors: Depreciation is non-cash, so a rental often shows a tax loss while cash-flowing — sheltering income. Rental losses are passive: they offset passive income freely, and up to $25,000/yr can offset ordinary (W-2) income if you actively participate and your MAGI is under $100k (phasing out to $0 by $150k); unused losses carry forward. On sale, claimed depreciation is recaptured at up to 25%, and gains may owe capital-gains tax (a 1031 exchange can defer both). Figures are a year-1 estimate at your 24.0% rate — not tax advice; consult a CPA.
Schools (NCES district)
- District
- Mount Baker School District
- NCES district ID
- 5305310
- Math proficiency
- 40% ▲ 3.00%
- Reading proficiency
- 53% ▼ -1.00%
- Median HH income
- $53,695
- Composite
- 42.37/100
- National rank
- #6931
- State rank
- #165 of 291 in WA
Livability — Peaceful Valley
- Score
- 60/100
- State rank
- #453
- US rank
- #18635
Category grades
Schools grade is shown separately in the Schools card above.
Census & demographics
- Census place
- Peaceful Valley, WA
- Population (ZIP)
- 4,198
Population outlook (Whatcom County) Hauer SSP2
- Today (2025)
- 240,408 people
- By 2030
- 254,667 · +5.9%
- By 2040
- 281,365 · +17.0%
- By 2050
- 307,592 · +27.9%
- By 2075
- 375,576 · +56.2%
- By 2100
- 421,637 · +75.4%
Race, ethnicity, and origin ACS 2023
- Neighborhood character
- Predominantly White (83%)
- Race & ethnicity
- White 83% Hispanic / Latino 7% Two or more races 6% Asian 3% Native American 2%
- Hispanic origin (detail)
- Mexican 5%
- Common ancestry
- Slovak 5% Iranian 4% Subsaharan African 3%
- Foreign-born
- 9% · Canada, Philippines, Vietnam
- Languages at home
- 93% English-only · Russian/Polish/Slavic 3% Other Indo-European 2% Vietnamese 2%
Political lean MEDSL · Whatcom
- 2024 margin
- Strong D (+24.9) · D 60.8% · R 35.9% · Other 3.3%
- 2008→2024 swing
- +6.9pp toward D · 2008: 18.0pp · 2024: 24.9pp
- All cycles
- 2024: D+24.9 2020: D+23.9 2016: D+17.7 2012: D+12.1 2008: D+18.0
Not yet ingested
- Civics
- —
Market trends
- HPI YoY
- ▼ -57.36%
- Current HPI
- 327.9087
- Rent YoY
- —
- Metro
- —
- State GDP YoY
- ▲ 4.65%
- F500 in state
- 22
Industry mix (Fortune 500 HQ in WA)
| Industry | F500 HQs | Revenue |
|---|---|---|
| Retail | 2 | $269B |
|
||
| Technology / Retail | 1 | $638B |
|
||
| Technology | 1 | $245B |
|
||
| Telecommunications | 1 | $38B |
|
||
| Food / Beverage | 1 | $36B |
|
||
| Automotive / Trucks | 1 | $34B |
|
||
Price history
+11.1% since first listed4 events — show timeline
- 2026-05-21 Listed $50,000 NWMLS as Distributed by MLS Grid
- 2022-08-03 Sold (MLS) $47,000 NWMLS as Distributed by MLS Grid
- 2022-07-17 Pending — NWMLS as Distributed by MLS Grid
- 2022-07-14 Listed $45,000 NWMLS as Distributed by MLS Grid
Property tax history
+10.6%/yrLatest (2026): $369 · +7.6% YoY. Source: county tax records.
Cash-flow waterfall
monthlySold comps — $/sqft
last 12 mo · ≤1 miLoading sold comps…