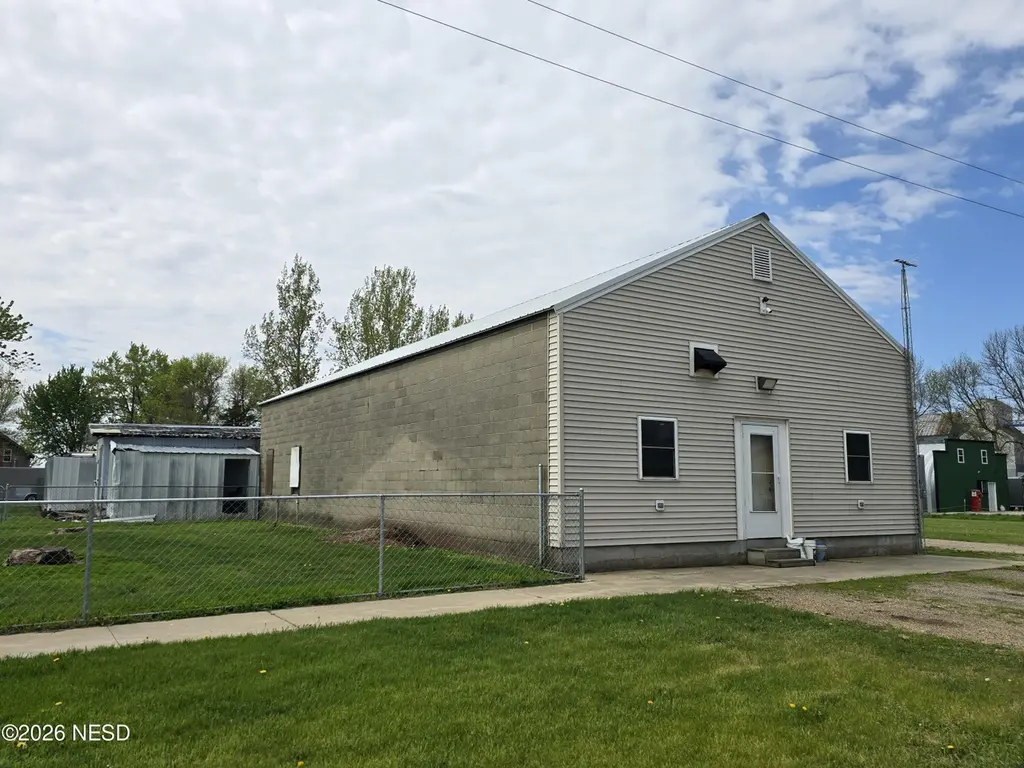
138 1st Ave · Watertown, SD
Flood risk No data
- FEMA flood zone
- —
- Chance of flooding over 30 yrs
- —
- Est. flood insurance / yr
- —
Fire risk No data
- Est. fire insurance / yr
- —
Heat risk No data
- Hot days now (above threshold)
- —
- Hot days in 30 yrs
- —
Wind risk No data
- Chance of severe wind over 30 yrs
- —
Air-quality risk No data
- Unhealthy air days now
- —
- Unhealthy air days in 30 yrs
- —
Risk factors via First Street. Map © Google.
Why this score? — see what drove the C+ grade
The composite is a weighted blend of 9 inputs, each scored 0–100. Each bar is that input's sub-score; the figure is the points it added to the 100-point composite (weight × sub-score).
- Cash flow +23.5/30.0
- ARV discount +15.0/15.0
- DSCR +7.6/10.0
- 1% rule +4.8/10.0
- Schools +4.3/10.0
- Livability +3.9/5.0
- Rent growth +2.5/5.0
- Condition / age +2.5/5.0
- Appreciation +0.0/10.0
$150,000
🖨 Deal sheet 📄 Offer letter ✓ Due diligence
Key facts
- Heated shop
- Fenced yard
- New steel roof
Tags
Property features AI
Exterior
- Parking: Attached garage with 4 spaces
- Home design: Single-family residence; One and one-half story
- Exterior features: Metal roof; Lot approximately 0.76 acres (about 200 x 165)
Interior
- Kitchen: Dishwasher; Refrigerator; Microwave
- Bathrooms: 1 full bathroom
- Interior features: Dishwasher; Refrigerator; Microwave
- Laundry & utility: Washer; Dryer
Neighborhood map
What this means for you Summary
Snapshot
- This is a 3-bed/1.0-bath single-family listed at $150k.
Deal economics
- At list price, monthly cash flow is $280 ($3k/yr) — positive.
- The deal already cash-flows at list — no discount required.
- To meet the 1% rule (rent ≥ 1% of price), the offer needs to be $147k (2.0% below list).
- Recommended offer: $147k (2.0% below list) — sets the bar for 1% rule.
- Cap rate 8.5% vs local median 2.3% in Watertown — top-decile yield for the area; either an underpriced asset or a hidden risk that comps aren't pricing in. Stress-test before assuming the spread holds.
Location & tenants
- Location reads 78/100 on livability (#11 in SD, #2,681 nationally) — a middle-class / working-renter tenant base. Strengths: cost of living A+, housing A+, health & safety A+; Watch: commute F.
- Watertown School District 14-4 (town): math 45% / reading 57% proficiency, ranked #28 of 59 in SD (top 48%) — acceptable for families but not a draw, mixed tenant base, ~2y average lease.
- Market conditions: 228 active listings in the ZIP; 160 units permitted in Codington County in 2024 (63 in 5+ unit buildings).
Forward outlook
- Local home prices are declining (-3.0%/yr); year-one equity from $1k of loan paydown is wiped out by about $4k of value loss. Plan a longer hold.
- Codington County population projected at +14% by 2050 — modest demand growth; plan on rents tracking national, not racing it.
Negotiation context
- It's been on market 23 days — a 2% lower offer ($148k) is reasonable based on typical stale-listing flexibility.
Risks & watch-outs
- Watch-outs: built in 1889 — expect roof / HVAC / electrical / plumbing capex.
Questions for the listing agent
- Built in 1889 — when were the roof, HVAC, electrical panel, plumbing, and water heater last replaced?
- Is there a deadline driving the sale (1031 exchange, divorce, estate, relocation)? That informs how much negotiation room exists.
- Schools are B-rated — typically a magnet for longer-tenancy family renters. What's the average tenant stay here, and is there a school-zone premium baked into asking?
- What's the average days-on-market for RENTAL listings here right now (not sales)? A rising rental-DOM trend means longer vacancies and softer asking-rent achievability than the comps imply.
- What's the recent tenant-quality profile in this submarket — average credit score on applications, eviction rate, late-payment / NSF rate, and stable-employment percentage? A property-management company in the area should have these aggregated.
- How much new for-sale + rental construction is in the pipeline within 1–3 miles? Heavy new supply typically softens prices + rents 12–24 months out; constrained supply supports both.
Investment metrics
- 1% rule
- 0.98% ✗
- Cap rate
- 8.53%
- Cash-on-cash
- 7.99%
- DSCR
- 1.36
- GRM
- 8.5
CMA / ARV
- ARV (on-the-fly)
- $187,880
- Comps found
- 12
Show comp detail 12 sales within ~0.75 mi
| Address | Dist | Beds/Ba | Sqft | Sold | Price | $/sf | Match |
|---|---|---|---|---|---|---|---|
| 208 1st St SW | 0.33mi | 3/1.5 | 1,760 (+3%) | 3mo | $267,800 | $152 | 75 |
| 161 6th St NE | 0.36mi | 4/2.0 (+1) | 1,696 (-1%) | 0mo | $257,500 | $152 | 73 |
| 327 N Broadway St | 0.33mi | 3/1.0 | 1,560 (-9%) | 2mo | $189,900 | $122 | 69 |
| 320 2nd St NE | 0.33mi | 3/1.0 | 1,544 (-10%) | 3mo | $245,000 | $159 | 66 |
| 305 3rd Ave NE | 0.33mi | 2/2.0 (-1) | 1,640 (-4%) | 4mo | $175,000 | $107 | 66 |
| 8 6th Ave SE | 0.59mi | 3/1.0 | 1,786 (+5%) | 4mo | $173,000 | $97 | 62 |
| 605 1st Ave NE | 0.38mi | 2/2.0 (-1) | 1,635 (-4%) | 6mo | $180,000 | $110 | 61 |
| 606 S Maple -- | 0.59mi | 2/1.0 (-1) | 1,731 (+1%) | 6mo | $160,000 | $92 | 60 |
| 508 4th St NE | 0.51mi | 2/2.0 (-1) | 1,824 (+7%) | 4mo | $170,000 | $93 | 52 |
| 514 4th Ave SE | 0.54mi | 2/1.0 (-1) | 1,915 (+12%) | 5mo | $150,000 | $78 | 46 |
| 519 6th Ave NE | 0.59mi | 2/1.0 (-1) | 1,495 (-12%) | 4mo | $167,000 | $112 | 43 |
| 509 5th St SE | 0.59mi | 3/1.5 | 1,956 (+14%) | 6mo | $180,500 | $92 | 41 |
Match score weights: distance 35% · size 25% · config 20% · recency 20%. Top-matched comps best support the ARV.
Projected returns pro-forma
-3.0% appreciation · 3.0% rent growth · sell at horizon
- IRR
- -4.2%
- Equity multiple
- 0.84×
- Total profit
- $-6,575
- Equity at exit
- $22,365
- IRR
- 5.5%
- Equity multiple
- 1.40×
- Total profit
- $16,903
- Equity at exit
- $12,969
Cash invested: $42,000 (down + closing). Projections, not guarantees.
Landlord ↔ Tenant lean methodology
- Overall (STATE)
- 83 Strongly Landlord-Friendly
- State South Dakota
- 83 Strongly Landlord-Friendly · R+16
- County
- — inherits STATE
- City
- — inherits STATE
ZIP-level market 57201
- Active inventory
- 228
- Price-to-rent
- 8.5×
Monthly cashflow live
- Estimated rent
- $1,470 medium interval (Pro) →
- Mortgage (P&I)
- −$787
- Tax from tax record
- −$32 /mo · $388/yr
- Insurance
- −$62
- HOA
- −$0
- Vacancy / Maint / Mgmt
- −$309
- Net cashflow
- $280
Break-even live
UW: 25.0% down · 7.5% · 30yr · 1.5% tax · 5.0% vac · 8.0% maint · 8.0% mgmt
Financing live
Cash to close
- Down payment
- $37,500
- Closing costs
- $4,500
- Reserves months
- —
- Total cash needed
- —
Loan-product check · same deal, 3 products live
Conventional
25% down · 7.5% · 30yr
- Down + closing
- —
- Monthly P&I
- —
- Monthly cashflow
- —
- DSCR
- —
- Eligible?
- —
Personal DTI + credit; lowest rate.
DSCR
20% down · 8.5% · 30yr
- Down + closing
- —
- Monthly P&I
- —
- Monthly cashflow
- —
- DSCR
- —
- Eligible?
- —
No personal income docs; deal must DSCR.
Hard money
10% down · 12.0% · 12mo
- Down + closing
- —
- Monthly P&I
- —
- Monthly cashflow
- —
- DSCR
- —
- Eligible?
- —
Short-term bridge; refi at stabilization.
Listing history 17 events
-
2026-06-19days on market $150,000 Active 23 DOM
-
2026-06-18days on market $150,000 Active 22 DOM
-
2026-06-17days on market $150,000 Active 21 DOM
-
2026-06-16days on market $150,000 Active 20 DOM
-
2026-06-15days on market $150,000 Active 19 DOM
-
2026-06-14days on market $150,000 Active 17 DOM
-
2026-06-12days on market $150,000 Active 16 DOM
-
2026-06-09days on market $150,000 Active 13 DOM
-
2026-06-08days on market $150,000 Active 12 DOM
-
2026-06-07days on market $150,000 Active 11 DOM
-
2026-06-05days on market $150,000 Active 9 DOM
-
2026-06-03days on market $150,000 Active 7 DOM
-
2026-06-02days on market $150,000 Active 6 DOM
-
2026-06-01days on market $150,000 Active 5 DOM
-
2026-05-31days on market $150,000 Active 4 DOM
-
2026-05-30days on market $150,000 Active 3 DOM
-
2026-05-27$150,000 Active
ⓘ Source: listings_history table (triggers on properties + properties_extension) + one-shot
backfill from property_details.listing_events for pre-trigger history.
Tax reassessment forecast SD · Resets to sale price
- Current annual tax
- $388 · $32/mo
- Projected year-2 tax
- $1,965 · $164/mo
- Expected delta
- +$1,577/yr (+$131/mo · 406.8%)
ⓘ Screening estimate from a state-policy table — verify with the county assessor before closing.
Nearby sold comps map
Loading sold comps map…
Walkable amenities ~0.75 mi
Loading nearby amenities…
Taxation est. · year 1
- Rental income
- $17,635
- − Mortgage interest
- −$8,402
- − Property taxes
- −$388
- − Insurance
- −$750
- − Repairs & maintenance
- −$1,411
- − Management
- −$1,411
- − Depreciation
- −$4,364
- Taxable income
- $910
- Est. tax owed @ 24.0%
- −$218
- After-tax cash flow
- $3,136/yr
For passive investors: Depreciation is non-cash, so a rental often shows a tax loss while cash-flowing — sheltering income. Rental losses are passive: they offset passive income freely, and up to $25,000/yr can offset ordinary (W-2) income if you actively participate and your MAGI is under $100k (phasing out to $0 by $150k); unused losses carry forward. On sale, claimed depreciation is recaptured at up to 25%, and gains may owe capital-gains tax (a 1031 exchange can defer both). Figures are a year-1 estimate at your 24.0% rate — not tax advice; consult a CPA.
Schools (NCES district)
- District
- Watertown School District 14-4
- NCES district ID
- 4676620
- Math proficiency
- 45% ▼ -10.00%
- Reading proficiency
- 57% ▼ -7.00%
- Median HH income
- $46,575
- Composite
- 43.24/100
- National rank
- #3057
- State rank
- #28 of 59 in SD
Livability — Watertown
- Score
- 78/100
- State rank
- #11
- US rank
- #2681
Category grades
Schools grade is shown separately in the Schools card above.
Census & demographics
- Census place
- Watertown, SD
- County
- Codington County · 26,781 people
- City population
- 26,781
- Metro
- Watertown, SD
- Population (ZIP)
- 26,781
- Household income
- $72,878
- Rent vs Own
- Severe rent burden
- 613.0
Population outlook (Codington County) Hauer SSP2
- Today (2025)
- 29,752 people
- By 2030
- 30,627 · +2.9%
- By 2040
- 32,285 · +8.5%
- By 2050
- 33,812 · +13.6%
- By 2075
- 39,184 · +31.7%
- By 2100
- 46,673 · +56.9%
Race, ethnicity, and origin ACS 2023
- Neighborhood character
- Predominantly White (91%)
- Race & ethnicity
- White 91% Two or more races 5% Hispanic / Latino 3% Native American 2%
- Common ancestry
- Portuguese 15% Romanian 3% Iranian 3%
- Foreign-born
- 1% · Canada
- Languages at home
- 97% English-only · Spanish 2% German/W. Germanic 1%
Political lean MEDSL · Codington
- 2024 margin
- Solid R (+40.8) · D 28.4% · R 69.2% · Other 2.4%
- 2008→2024 swing
- -34.4pp toward R · 2008: -6.4pp · 2024: -40.8pp
- All cycles
- 2024: R+40.8 2020: R+38.9 2016: R+39.3 2012: R+18.3 2008: R+6.4
Not yet ingested
- Civics
- —
Market trends
- HPI YoY
- ▼ -161.04%
- Current HPI
- 165.8449
- Rent YoY
- —
- Metro
- Watertown, SD
- State GDP YoY
- ▲ 0.70%
- F500 in state
- 2
Industry mix (Fortune 500 HQ in SD)
| Industry | F500 HQs | Revenue |
|---|---|---|
| Utilities | 1 | $1B |
|
||
Price history
1 event — show timeline
- 2026-05-27 Listed $150,000 NESD
Property tax history
-2.4%/yrLatest (2025): $388 · -43.8% YoY. Source: county tax records.
Cash-flow waterfall
monthlySold comps — $/sqft
last 12 mo · ≤1 miLoading sold comps…