 Multi-family
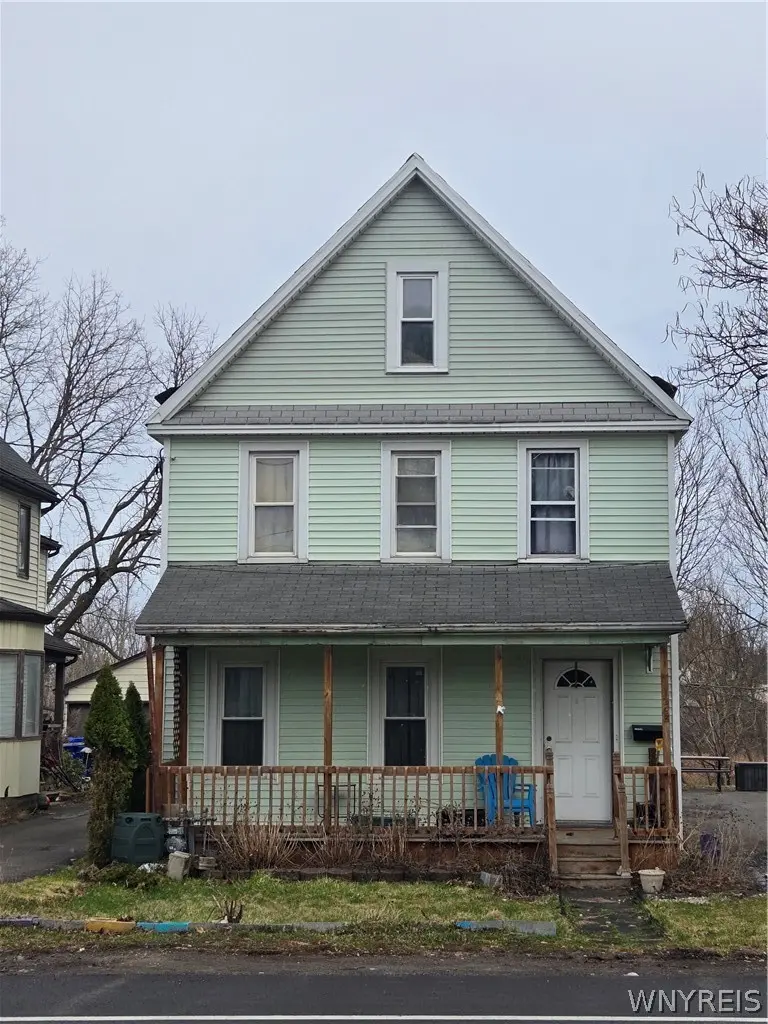
1268 Indian Church Rd · West Seneca, NY
Flood risk 1/10 · Minimal
- FEMA flood zone
- X (unshaded)
- Chance of flooding over 30 yrs
- 0.0%
- Est. flood insurance / yr
- $507 – $1,088
Fire risk 3/10 · Minor
- Est. fire insurance / yr
- $691 – $1,283
Heat risk 2/10 · Minimal
- Hot days now (above 92°F)
- 7 days/yr
- Hot days in 30 yrs
- 14 days/yr
Wind risk 1/10 · Minimal
- Chance of severe wind over 30 yrs
- —
Air-quality risk 3/10 · Minor
- Unhealthy air days now
- 2 days/yr
- Unhealthy air days in 30 yrs
- 3 days/yr
Risk factors via First Street. Map © Google.
Why this score? — see what drove the B- grade
The composite is a weighted blend of 9 inputs, each scored 0–100. Each bar is that input's sub-score; the figure is the points it added to the 100-point composite (weight × sub-score).
- Cash flow +28.0/30.0
- DSCR +9.9/10.0
- 1% rule +8.8/10.0
- ARV discount +7.5/15.0
- Schools +4.5/10.0
- Livability +4.0/5.0
- Rent growth +2.5/5.0
- Condition / age +2.5/5.0
- Appreciation +0.0/10.0
$144,000
🖨 Deal sheet 📄 Offer letter ✓ Due diligence
Multi-family units
County records classify this as Multi-Family (2-4 Unit). Listing-text estimate: 1 unit. estimate disagrees with records
Listing remarks
NEW PRICE. .. . Historic Charm Meets Untapped Potential in West Seneca Step into the possibilities with this spacious 5-bedroom, 2-bathroom home nestled in the heart of West Seneca. Built in 1880, this property offers a rare blend of original character and modern updates, waiting for the right owner to bring it to full glory. Inside, you'll find generous living spaces including a formal dining room and a cozy living room perfect for gatherings. The updated kitchen and renovated lower-level full bath provide a solid foundation for further improvements, while the upstairs bath and bedrooms offer ample room for customization. Original woodwork throughout the home adds warmth and timeless ap
Key facts
- Cozy living room
- Formal dining room
- Updated kitchen
Tags
Neighborhood map
What this means for you Summary
Snapshot
- This is a 5-bed/2.0-bath multifamily listed at $144k.
Deal economics
- At list price, monthly cash flow is $447 ($5k/yr) — positive.
- The deal already cash-flows at list — no discount required.
- Meets the 1% rule at list price ($2k rent vs $144k).
- Recommended offer: $142k (1.5% below list) — sets the bar for market timing.
- Cap rate 10.0% vs local median 3.7% in West Seneca — top-decile yield for the area; either an underpriced asset or a hidden risk that comps aren't pricing in. Stress-test before assuming the spread holds.
Location & tenants
- Location reads 79/100 on livability (#130 in NY, #2,089 nationally) — a middle-class / working-renter tenant base. Strengths: housing A+, health & safety A+, crime A-; Watch: amenities D, commute F.
- West Seneca Central School District (suburban): math 49% / reading 55% proficiency, ranked #336 of 590 in NY (top 57%) — acceptable for families but not a draw, mixed tenant base, ~2y average lease.
- Market conditions: 201 active listings in the ZIP; 1,244 units permitted in Erie County in 2024 (563 in 5+ unit buildings).
Forward outlook
- Local home prices are declining (-3.0%/yr); year-one equity from $996 of loan paydown is wiped out by about $4k of value loss. Plan a longer hold.
- At projected returns (-3.0% appreciation + 3.0% rent growth), your $40k cash investment doubles in ~9 years — after that, you're playing with house money.
Negotiation context
- It's been on market 25 days — a 2% lower offer ($142k) is reasonable based on typical stale-listing flexibility.
- 2 sale attempts with the ask held roughly flat each time — persistent listings suggest the price (not the market) is what's stuck; bring a comps-based counter.
- Current owner paid $42k; list at $144k implies a 240% gain — meaningful room to come down on a strong offer.
Risks & watch-outs
- Watch-outs: property tax is 2.6% of price; built in 1880 — expect roof / HVAC / electrical / plumbing capex.
Questions for the listing agent
- Built in 1880 — when were the roof, HVAC, electrical panel, plumbing, and water heater last replaced?
- Property tax is high relative to price — has the assessment been appealed recently, and will the sale trigger a re-assessment?
- Is there a deadline driving the sale (1031 exchange, divorce, estate, relocation)? That informs how much negotiation room exists.
- Schools are B-rated — typically a magnet for longer-tenancy family renters. What's the average tenant stay here, and is there a school-zone premium baked into asking?
- What's the average days-on-market for RENTAL listings here right now (not sales)? A rising rental-DOM trend means longer vacancies and softer asking-rent achievability than the comps imply.
- What's the recent tenant-quality profile in this submarket — average credit score on applications, eviction rate, late-payment / NSF rate, and stable-employment percentage? A property-management company in the area should have these aggregated.
- How much new apartment / multifamily construction is in the pipeline within 1–3 miles? Heavy new supply (>2% of stock underway) typically softens rents 12–24 months out; light construction supports rent growth.
Investment metrics
- 1% rule
- 1.38% ✓
- Cap rate
- 10.02%
- Cash-on-cash
- 13.31%
- DSCR
- 1.59
- GRM
- 6.0
CMA / ARV
No comps found within radius.
Projected returns pro-forma
-3.0% appreciation · 3.0% rent growth · sell at horizon
- IRR
- 3.4%
- Equity multiple
- 1.13×
- Total profit
- $5,248
- Equity at exit
- $21,471
- IRR
- 13.0%
- Equity multiple
- 2.03×
- Total profit
- $41,672
- Equity at exit
- $12,450
Cash invested: $40,320 (down + closing). Projections, not guarantees.
Landlord ↔ Tenant lean methodology
- Overall (STATE)
- 15 Strongly Tenant-Friendly
- State New York
- 15 Strongly Tenant-Friendly · D+10
- County
- — inherits STATE
- City
- — inherits STATE
ZIP-level market 14224
- Active inventory
- 201
- Price-to-rent
- 6.0×
Monthly cashflow live
- Estimated rent
- $1,986 medium interval (Pro) →
- Mortgage (P&I)
- −$755
- Tax from tax record
- −$307 /mo · $3,679/yr
- Insurance
- −$60
- HOA
- −$0
- Vacancy / Maint / Mgmt
- −$417
- Net cashflow
- $447
Break-even live
UW: 25.0% down · 7.5% · 30yr · 1.5% tax · 5.0% vac · 8.0% maint · 8.0% mgmt
Financing live
Cash to close
- Down payment
- $36,000
- Closing costs
- $4,320
- Reserves months
- —
- Total cash needed
- —
Loan-product check · same deal, 3 products live
Conventional
25% down · 7.5% · 30yr
- Down + closing
- —
- Monthly P&I
- —
- Monthly cashflow
- —
- DSCR
- —
- Eligible?
- —
Personal DTI + credit; lowest rate.
DSCR
20% down · 8.5% · 30yr
- Down + closing
- —
- Monthly P&I
- —
- Monthly cashflow
- —
- DSCR
- —
- Eligible?
- —
No personal income docs; deal must DSCR.
Hard money
10% down · 12.0% · 12mo
- Down + closing
- —
- Monthly P&I
- —
- Monthly cashflow
- —
- DSCR
- —
- Eligible?
- —
Short-term bridge; refi at stabilization.
Listing history 5 events
-
2026-04-27status Pending
-
2026-04-02$144,000 Active
-
2026-04-01historical
-
2025-10-01$159,999 Active
-
2003-07-25soldstatus $42,400
ⓘ Source: listings_history table (triggers on properties + properties_extension) + one-shot
backfill from property_details.listing_events for pre-trigger history.
Tax reassessment forecast NY · Partial reset (capped growth)
- Current annual tax
- $3,679 · $307/mo
- Projected year-2 tax
- $3,679 · $307/mo
- Expected delta
- $0/yr ($0/mo · 0.0%)
ⓘ Screening estimate from a state-policy table — verify with the county assessor before closing.
Climate risk First Street
- Flood 1/10 Low FEMA zone X (unshaded) · 0% chance over 30 yrs
- Wildfire 3/10 Moderate
- Heat 2/10 Low 7 d/yr ≥92°F today · 14 d/yr by 30 yrs out
- Wind 1/10 Low
- Air quality 3/10 Moderate 2 unhealthy d/yr today · 3 by 30 yrs out
Nearby sold comps map
Loading sold comps map…
Walkable amenities ~0.75 mi
Loading nearby amenities…
Taxation est. · year 1
- Rental income
- $23,829
- − Mortgage interest
- −$8,066
- − Property taxes
- −$3,679
- − Insurance
- −$720
- − Repairs & maintenance
- −$1,906
- − Management
- −$1,906
- − Depreciation
- −$4,189
- Taxable income
- $3,363
- Est. tax owed @ 24.0%
- −$807
- After-tax cash flow
- $4,558/yr
For passive investors: Depreciation is non-cash, so a rental often shows a tax loss while cash-flowing — sheltering income. Rental losses are passive: they offset passive income freely, and up to $25,000/yr can offset ordinary (W-2) income if you actively participate and your MAGI is under $100k (phasing out to $0 by $150k); unused losses carry forward. On sale, claimed depreciation is recaptured at up to 25%, and gains may owe capital-gains tax (a 1031 exchange can defer both). Figures are a year-1 estimate at your 24.0% rate — not tax advice; consult a CPA.
Schools (NCES district)
- District
- West Seneca Central School District
- NCES district ID
- 3630780
- Math proficiency
- 49% ▼ -15.00%
- Reading proficiency
- 55% ▼ -4.00%
- Median HH income
- $54,231
- Composite
- 44.83/100
- National rank
- #2735
- State rank
- #336 of 590 in NY
Livability — West Seneca
- Score
- 79/100
- State rank
- #130
- US rank
- #2089
Category grades
Schools grade is shown separately in the Schools card above.
Census & demographics
- Census place
- West Seneca, NY
- City population
- 41,101
- Population (ZIP)
- 41,101
Population outlook (Erie County) Hauer SSP2
- Today (2025)
- 933,037 people
- By 2030
- 935,181 · +0.2%
- By 2040
- 928,531 · -0.5%
- By 2050
- 905,725 · -2.9%
- By 2075
- 834,037 · -10.6%
- By 2100
- 708,033 · -24.1%
Race, ethnicity, and origin ACS 2023
- Neighborhood character
- Predominantly White (91%)
- Race & ethnicity
- White 91% Hispanic / Latino 4% Two or more races 3% Black 2%
- Common ancestry
- Romanian 22% Lithuanian 2% Iranian 1%
- Foreign-born
- 2% · Canada
- Languages at home
- 95% English-only · Spanish 2% Russian/Polish/Slavic 1% Arabic 1%
Political lean MEDSL · Erie
- 2024 margin
- Lean D (+9.7) · D 54.8% · R 45.2%
- 2008→2024 swing
- -7.9pp toward R · 2008: 17.5pp · 2024: 9.7pp
- All cycles
- 2024: D+9.7 2020: D+14.7 2016: D+4.8 2012: D+15.6 2008: D+17.5
Not yet ingested
- Civics
- —
Market trends
- HPI YoY
- ▼ -211.03%
- Current HPI
- 303.7523
- Rent YoY
- —
- Metro
- —
- State GDP YoY
- ▲ 2.60%
- F500 in state
- 92
Industry mix (Fortune 500 HQ in NY)
| Industry | F500 HQs | Revenue |
|---|---|---|
| Financial Services | 10 | $950B |
|
||
| Consumer Goods | 9 | $162B |
|
||
| Insurance | 4 | $225B |
|
||
| Telecommunications | 2 | $144B |
|
||
| Pharmaceuticals | 2 | $112B |
|
||
| Media / Entertainment | 2 | $69B |
|
||
Price history
+239.6% since first listed5 events — show timeline
- 2026-04-27 Pending — WNYREIS
- 2026-04-02 Listed $144,000 WNYREIS
- 2026-04-01 Listing Removed — WNYREIS
- 2025-10-01 Listed $159,999 WNYREIS
- 2003-07-25 Sold (Public Records) $42,400 Public Records
Property tax history
+3.6%/yrLatest (2025): $3,679 · +0.7% YoY. Source: county tax records.
Cash-flow waterfall
monthlySold comps — $/sqft
last 12 mo · ≤1 miLoading sold comps…