1042 Evans Rd #4 · Wofford Heights, CA
Flood risk 1/10 · Minimal
- FEMA flood zone
- X (unshaded)
- Chance of flooding over 30 yrs
- 0.0%
- Est. flood insurance / yr
- $507 – $1,088
Fire risk 8/10 · Major
- Est. fire insurance / yr
- $659 – $1,223
Heat risk 6/10 · Moderate
- Hot days now (above 101°F)
- 7 days/yr
- Hot days in 30 yrs
- 19 days/yr
Wind risk 1/10 · Minimal
- Chance of severe wind over 30 yrs
- —
Air-quality risk 10/10 · Severe
- Unhealthy air days now
- 26 days/yr
- Unhealthy air days in 30 yrs
- 33 days/yr
Risk factors via First Street. Map © Google.
Why this score? — see what drove the A- grade
The composite is a weighted blend of 9 inputs, each scored 0–100. Each bar is that input's sub-score; the figure is the points it added to the 100-point composite (weight × sub-score).
- Cash flow +30.0/30.0
- ARV discount +15.0/15.0
- 1% rule +10.0/10.0
- DSCR +10.0/10.0
- Appreciation +10.0/10.0
- Schools +2.6/10.0
- Rent growth +2.5/5.0
- Livability +2.2/5.0
- Condition / age +2.2/5.0
$36,900
🖨 Deal sheet 📄 Offer letter ✓ Due diligence
Listing remarks
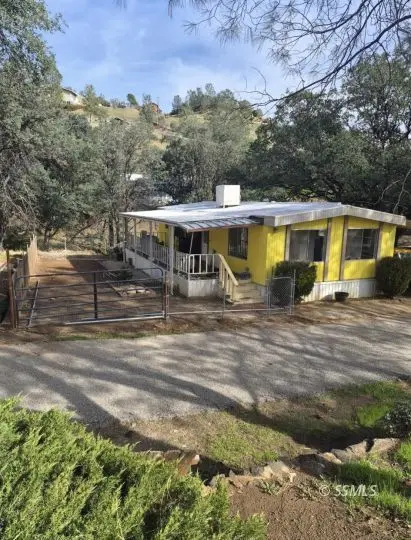
Very affordable rent currently at $350 a month (trash included) for this space in the Royal Oaks Mobile Home Park! Excellent location! This is a well-managed park and families are welcome! The covered porch is great to enjoy the surrounding nature and wildlife! Community clubhouse located next door with plenty of spacing between via a horseshoe pitching area. Clubhouse includes an outdoor BBQ area, games and book room, leave a book take a book! Monthly summer BBQ's and great vibes. Some upgrades have been completed. The rest is ready for your finishing touches. Priced low for a quick sale. Property is within minutes of Isabella Lake and Alta Sierra Ski Resort!
Key facts
- Covered porch
- Isabella lake
- Community clubhouse
Tags
Property features AI
Exterior
- Utilities: Propane; Septic tank
- Home design: Residential mobile home (double-wide)
- Exterior features: Covered patio; Partial fencing; Shed(s); Landscaped grounds
Interior
- Flooring: Carpet; Linoleum
- Bathrooms: 1 full bathroom; 1 three-quarter bathroom
- Heating & cooling: Evaporative cooling
- Interior features: Gas water heater
Neighborhood map
What this means for you Summary
Snapshot
- This is a 2-bed/2.0-bath manufactured listed at $37k. Condition is rated fair.
Deal economics
- At list price, monthly cash flow is $539 ($6k/yr) — positive.
- The deal already cash-flows at list — no discount required.
- Meets the 1% rule at list price ($1k rent vs $37k).
- Recommended offer: $36k (1.5% below list) — sets the bar for market timing.
- Cap rate 23.8% vs local median 3.8% in Wofford Heights — top-decile yield for the area; either an underpriced asset or a hidden risk that comps aren't pricing in. Stress-test before assuming the spread holds.
Location & tenants
- Location reads 45/100 on livability (#1,317 in CA) — a working-class tenant base; expect higher turnover. Strengths: crime B, cost of living B; Watch: schools F, amenities F, commute F.
- Kernville Union Elementary (rural): math 20% / reading 37% proficiency, ranked #1,128 of 1,400 in CA (top 81%) — low school quality limits family demand, transient renter base, plan for 1-2y turnover; 65% free/reduced lunch — lower-income household profile, screen leases tightly.
- Market conditions: 94 active listings in the ZIP; 3,244 units permitted in Kern County in 2024 (73 in 5+ unit buildings).
Forward outlook
- In year one you build about $4k of equity ($255 loan paydown + $4k appreciation (10.0% local appreciation)).
- Kern County population projected at +17% by 2050 — long-run rental-demand tailwind backs the buy-and-hold thesis.
- At projected returns (10.0% appreciation + 3.0% rent growth), your $10k cash investment doubles in ~1 year — after that, you're playing with house money.
- By year 8, paydown + projected appreciation supports a ~$34k cash-out refi (75% LTV) — recoverable capital for the next deal without selling this one.
Negotiation context
- It's been on market 19 days — a 2% lower offer ($36k) is reasonable based on typical stale-listing flexibility.
Risks & watch-outs
- Climate carrying-cost: severe wildfire risk; extreme-heat days projected 7→19/yr by 2055 (HVAC capex compounding) — expect insurance premiums to compound above CPI over the hold.
Questions for the listing agent
- Have any recent inspections been done? Can we get a copy of the seller's disclosures and any deferred-maintenance estimates?
- Built in 1976 — when were the roof, HVAC, electrical panel, plumbing, and water heater last replaced?
- Is there a deadline driving the sale (1031 exchange, divorce, estate, relocation)? That informs how much negotiation room exists.
- Schools are F-rated, which usually means shorter tenancies and higher turnover. Who's the typical renter profile here, and what's been the actual vacancy rate?
- What's the average days-on-market for RENTAL listings here right now (not sales)? A rising rental-DOM trend means longer vacancies and softer asking-rent achievability than the comps imply.
- What's the recent tenant-quality profile in this submarket — average credit score on applications, eviction rate, late-payment / NSF rate, and stable-employment percentage? A property-management company in the area should have these aggregated.
- How much new for-sale + rental construction is in the pipeline within 1–3 miles? Heavy new supply typically softens prices + rents 12–24 months out; constrained supply supports both.
Investment metrics
- 1% rule
- 2.72% ✓
- Cap rate
- 23.81%
- Cash-on-cash
- 62.58%
- DSCR
- 3.78
- GRM
- 3.1
CMA / ARV
- ARV (on-the-fly)
- $52,800
- Comps found
- 4
Show comp detail 4 sales within ~0.75 mi
| Address | Dist | Beds/Ba | Sqft | Sold | Price | $/sf | Match |
|---|---|---|---|---|---|---|---|
| 1040 Evans Rd Unit B2 | 0.09mi | 2/1.0 | 840 (-4%) | 21mo | $28,500 | $34 | 67 |
| 1042 Evans Rd #2 | 0.00mi | 2/1.0 | 992 (+13%) | 16mo | $46,900 | $47 | 61 |
| 5 Patricia Ln | 0.55mi | 2/2.0 | 960 (+9%) | 7mo | $57,500 | $60 | 54 |
| 168 Merrill Rd | 0.42mi | 1/1.0 (-1) | 776 (-12%) | 9mo | $92,500 | $119 | 44 |
Match score weights: distance 35% · size 25% · config 20% · recency 20%. Top-matched comps best support the ARV.
Projected returns pro-forma
10.0% appreciation · 3.0% rent growth · sell at horizon
- IRR
- 74.4%
- Equity multiple
- 6.27×
- Total profit
- $54,427
- Equity at exit
- $33,242
- IRR
- 68.4%
- Equity multiple
- 13.90×
- Total profit
- $133,323
- Equity at exit
- $71,689
Cash invested: $10,332 (down + closing). Projections, not guarantees.
Landlord ↔ Tenant lean methodology
- Overall (STATE)
- 18 Strongly Tenant-Friendly
- State California
- 18 Strongly Tenant-Friendly · D+13
- County
- — inherits STATE
- City
- — inherits STATE
ZIP-level market 93285
- Home prices YoY
- 4.8%
- Active inventory
- 94
- Price-to-rent
- 3.1×
Monthly cashflow live
- Estimated rent
- $1,005 medium interval (Pro) →
- Mortgage (P&I)
- −$194
- Tax est. 1.5%
- −$46 /mo · $554/yr
- Insurance
- −$15
- HOA
- −$0
- Vacancy / Maint / Mgmt
- −$211
- Net cashflow
- $539
Break-even live
UW: 25.0% down · 7.5% · 30yr · 1.5% tax · 5.0% vac · 8.0% maint · 8.0% mgmt
Financing live
Cash to close
- Down payment
- $9,225
- Closing costs
- $1,107
- Reserves months
- —
- Total cash needed
- —
Loan-product check · same deal, 3 products live
Conventional
25% down · 7.5% · 30yr
- Down + closing
- —
- Monthly P&I
- —
- Monthly cashflow
- —
- DSCR
- —
- Eligible?
- —
Personal DTI + credit; lowest rate.
DSCR
20% down · 8.5% · 30yr
- Down + closing
- —
- Monthly P&I
- —
- Monthly cashflow
- —
- DSCR
- —
- Eligible?
- —
No personal income docs; deal must DSCR.
Hard money
10% down · 12.0% · 12mo
- Down + closing
- —
- Monthly P&I
- —
- Monthly cashflow
- —
- DSCR
- —
- Eligible?
- —
Short-term bridge; refi at stabilization.
Listing history 16 events
-
2026-06-18days on market $36,900 Active 19 DOM
-
2026-06-17days on market $36,900 Active 18 DOM
-
2026-06-16days on market $36,900 Active 17 DOM
-
2026-06-15days on market $36,900 Active 16 DOM
-
2026-06-14days on market $36,900 Active 14 DOM
-
2026-06-13days on market $36,900 Active 13 DOM
-
2026-06-10days on market $36,900 Active 11 DOM
-
2026-06-09days on market $36,900 Active 10 DOM
-
2026-06-08days on market $36,900 Active 9 DOM
-
2026-06-07days on market $36,900 Active 8 DOM
-
2026-06-05days on market $36,900 Active 5 DOM
-
2026-06-03days on market $36,900 Active 4 DOM
-
2026-06-03days on market $36,900 Active 3 DOM
-
2026-06-01days on market $36,900 Active 2 DOM
-
2026-05-31remarks 668-char remark
-
2026-05-31$36,900 Active 1 DOM
ⓘ Source: listings_history table (triggers on properties + properties_extension) + one-shot
backfill from property_details.listing_events for pre-trigger history.
Climate risk First Street
- Flood 1/10 Low FEMA zone X (unshaded) · 0% chance over 30 yrs
- Wildfire 8/10 Severe
- Heat 6/10 Major 7 d/yr ≥101°F today · 19 d/yr by 30 yrs out
- Wind 1/10 Low
- Air quality 10/10 Extreme 26 unhealthy d/yr today · 33 by 30 yrs out
Nearby sold comps map
Loading sold comps map…
Walkable amenities ~0.75 mi
Loading nearby amenities…
Taxation est. · year 1
- Rental income
- $12,057
- − Mortgage interest
- −$2,067
- − Property taxes
- −$554
- − Insurance
- −$184
- − Repairs & maintenance
- −$965
- − Management
- −$965
- − Depreciation
- −$1,073
- Taxable income
- $6,250
- Est. tax owed @ 24.0%
- −$1,500
- After-tax cash flow
- $4,965/yr
For passive investors: Depreciation is non-cash, so a rental often shows a tax loss while cash-flowing — sheltering income. Rental losses are passive: they offset passive income freely, and up to $25,000/yr can offset ordinary (W-2) income if you actively participate and your MAGI is under $100k (phasing out to $0 by $150k); unused losses carry forward. On sale, claimed depreciation is recaptured at up to 25%, and gains may owe capital-gains tax (a 1031 exchange can defer both). Figures are a year-1 estimate at your 24.0% rate — not tax advice; consult a CPA.
Condition & rehab AI · 2 photos
This manufactured home requires extensive repairs and updates to its exterior and interior, significantly impacting its value. Immediate attention to the roof and siding is critical to prevent further damage and improve its condition score.
Repairs flagged
- Major siding — Significant wear and tear
- Major roof — Rusty metal roof
- Major flooring — Worn carpet with visible stains
- Major interior walls — Painted walls with peeling areas
- Major bathrooms — Visible wear and tear
- Major kitchen — Worn countertops, outdated appliances
Value-add opportunities
- Both Paint interior walls — Enhances curb appeal and interior aesthetics
- Both Replace carpet — Improves comfort and reduces maintenance
- Both Upgrade appliances — Modernizes the kitchen and improves functionality
Renovation cost estimate screening
| Repair item | Severity | Est. cost |
|---|---|---|
| siding · Significant wear and tear | Major | $15,000–50,000 |
| roof · Rusty metal roof | Major | $15,000–50,000 |
| flooring · Worn carpet with visible stains | Major | $15,000–50,000 |
| interior walls · Painted walls with peeling areas | Major | $15,000–50,000 |
| bathrooms · Visible wear and tear | Major | $15,000–50,000 |
| kitchen · Worn countertops, outdated appliances | Major | $15,000–50,000 |
| Total estimated repair cost · 6 items | $90,000–300,000 |
Value-add ROI direction
- Both Paint interior walls — Enhances curb appeal and interior aesthetics ↑
- Both Replace carpet — Improves comfort and reduces maintenance ↑
- Both Upgrade appliances — Modernizes the kitchen and improves functionality ↑
ⓘ Cost ranges are severity-bucket heuristics (US national rule-of-thumb). Get contractor quotes + a written scope before underwriting a rehab budget.
Schools (NCES district)
- District
- Kernville Union Elementary
- NCES district ID
- 0619590
- Math proficiency
- 20% ▲ 4.00%
- Reading proficiency
- 37% ▲ 11.00%
- Median HH income
- $29,896
- Composite
- 25.91/100
- National rank
- #12766
- State rank
- #1128 of 1400 in CA
Livability — Wofford Heights
- Score
- 45/100
- State rank
- #1317
- US rank
- #26674
Category grades
Schools grade is shown separately in the Schools card above.
Census & demographics
- Census place
- Wofford Heights, CA
- Population (ZIP)
- 2,415
Population outlook (Kern County) Hauer SSP2
- Today (2025)
- 947,286 people
- By 2030
- 978,984 · +3.3%
- By 2040
- 1,045,018 · +10.3%
- By 2050
- 1,105,232 · +16.7%
- By 2075
- 1,229,538 · +29.8%
- By 2100
- 1,238,059 · +30.7%
Race, ethnicity, and origin ACS 2023
- Neighborhood character
- Predominantly White (80%)
- Race & ethnicity
- White 80% Hispanic / Latino 19% Two or more races 6%
- Hispanic origin (detail)
- Mexican 17%
- Common ancestry
- Romanian 4% Subsaharan African 4% Iranian 2%
- Foreign-born
- 8% · Canada
- Languages at home
- 78% English-only · Spanish 15% Russian/Polish/Slavic 8%
Political lean MEDSL · Kern
- 2024 margin
- Strong R (+21.1) · D 38.2% · R 59.3% · Other 2.5%
- 2008→2024 swing
- -3.3pp toward R · 2008: -17.8pp · 2024: -21.1pp
- All cycles
- 2024: R+21.1 2020: R+10.2 2016: R+15.0 2012: R+20.9 2008: R+17.8
Not yet ingested
- Civics
- —
Market trends
- HPI YoY
- ▲ 12.11%
- Current HPI
- 264.1726
- Rent YoY
- —
- Metro
- —
- State GDP YoY
- ▲ 3.21%
- F500 in state
- 116
Industry mix (Fortune 500 HQ in CA)
| Industry | F500 HQs | Revenue |
|---|---|---|
| Technology | 27 | $1,492B |
|
||
| Financial Services | 3 | $174B |
|
||
| Retail | 3 | $44B |
|
||
| Insurance | 3 | $26B |
|
||
| Media / Entertainment | 2 | $115B |
|
||
| Pharmaceuticals / Biotech | 2 | $62B |
|
||
Price history
1 event — show timeline
- 2026-05-30 Listed $36,900 SSMLS
Cash-flow waterfall
monthlySold comps — $/sqft
last 12 mo · ≤1 miLoading sold comps…