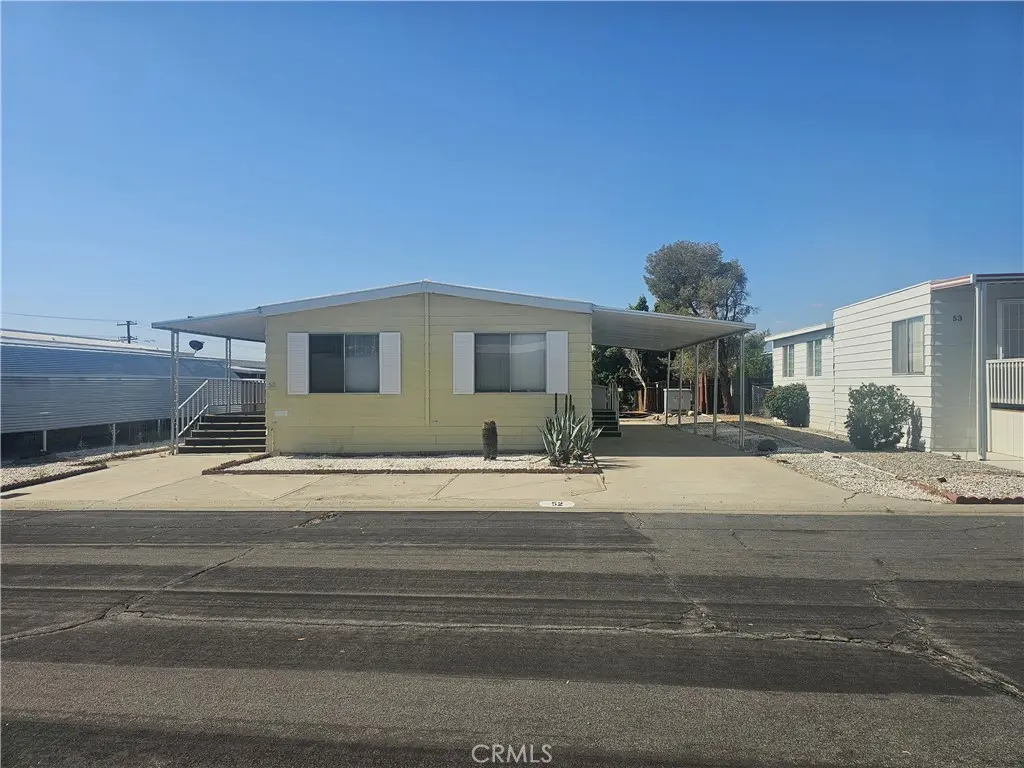
14777 Palm #52 · Desert Hot Springs, CA
Flood risk 1/10 · Minimal
- FEMA flood zone
- X (shaded)
- Chance of flooding over 30 yrs
- 0.0%
- Est. flood insurance / yr
- $507 – $1,088
Fire risk 6/10 · Moderate
- Est. fire insurance / yr
- $659 – $1,223
Heat risk 8/10 · Major
- Hot days now (above 109°F)
- 4 days/yr
- Hot days in 30 yrs
- 12 days/yr
Wind risk 1/10 · Minimal
- Chance of severe wind over 30 yrs
- —
Air-quality risk 5/10 · Moderate
- Unhealthy air days now
- 8 days/yr
- Unhealthy air days in 30 yrs
- 11 days/yr
Risk factors via First Street. Map © Google.
Why this score? — see what drove the C grade
The composite is a weighted blend of 9 inputs, each scored 0–100. Each bar is that input's sub-score; the figure is the points it added to the 100-point composite (weight × sub-score).
- Cash flow +27.2/30.0
- DSCR +9.5/10.0
- 1% rule +8.5/10.0
- Rent growth +3.4/5.0
- Schools +2.7/10.0
- Livability +2.5/5.0
- Condition / age +2.5/5.0
- ARV discount +0.0/15.0
- Appreciation +0.0/10.0
$135,000
🖨 Deal sheet 📄 Offer letter ✓ Due diligence
Listing remarks
Welcome to Sky's Haven, a gated 55+ community where you own the land—no space rent! This 2-bedroom, 2-bath home offers great potential with major updates already completed, including a York HVAC and heating system installed approximately two years ago and a roof resealed approximately one year ago. The home features a covered carport, a spacious covered patio measuring approximately 27' x 8', and a concrete walkway surrounding the property. Inside, you'll find a functional kitchen with abundant cabinet space, a Hotpoint refrigerator, GE stove, dining area with built-in hutch, generously sized bedrooms, and an indoor laundry room. Conveniently located near shopping, dining, and just mi
Key facts
- Gated community
- Three spas
- Covered carport
Tags
Property features AI
Finance
- Other: Park entrance is on the west side of Palm Drive
- HOA & community: Part of Sky's Haven association; Monthly association fee of $215; Association amenities: gym/exercise room, sauna, pool, barbecue, clubhouse, spa, security; Senior community; Street lighting
Exterior
- Parking: Carport; Has parking (park name: Skys Haven)
- Security: Community security
- Utilities: Public/district water; Public sewer; Natural gas connected; Electricity connected
- Home design: Single-story; Entry on main level; Mobile home remains (24 ft. x 40 ft.); Lot is level/flat
- Construction: Year built per assessor; Mobile/manufactured construction
- Exterior features: Community pool
Interior
- Kitchen: Gas range; Formica counters
- Bedrooms: Primary bedroom; All bedrooms on one level
- Flooring: Vinyl flooring; Carpet flooring
- Bathrooms: 2 full bathrooms; Bathtub and shower
- Heating & cooling: Central furnace heating; Central cooling
- Interior features: Ceiling fan; Community spa
- Laundry & utility: Inside laundry
Neighborhood map
What this means for you Summary
Snapshot
- This is a 2-bed/2.0-bath manufactured listed at $135k.
Deal economics
- At list price, monthly cash flow is $386 ($5k/yr) — positive.
- The deal already cash-flows at list — no discount required.
- Meets the 1% rule at list price ($2k rent vs $135k).
- Cap rate 9.7% vs local median 4.0% in Desert Hot Springs — top-decile yield for the area; either an underpriced asset or a hidden risk that comps aren't pricing in. Stress-test before assuming the spread holds.
Location & tenants
- Location reads 49/100 on livability (#1,149 in CA) — a working-class tenant base; expect higher turnover. Strengths: housing B+; Watch: crime D+, schools F, amenities F.
- Palm Springs Unified (suburban): math 21% / reading 42% proficiency, ranked #328 of 517 in CA (top 63%) — families likely to look elsewhere, expect single-tenant / working-renter base with shorter leases; 73% free/reduced lunch — lower-income household profile, screen leases tightly.
- Market conditions: Rents rising (+3.7%/yr); 515 active listings in the ZIP; 17 comparable units currently listed for rent nearby; rentals lingering (median 44d on market — plan ~5-8 weeks vacancy on turnover, expect pricing pressure); 59% of comp listings sitting > 30 days — soft ceiling on asking rent; 9,195 units permitted in Riverside County in 2024 (1,512 in 5+ unit buildings).
- This rent runs 40% of the median local income ($54k/yr) — at the standard rent-burdened threshold; future hikes will face affordability resistance.
Forward outlook
- Local home prices are declining (-3.0%/yr); year-one equity from $933 of loan paydown is wiped out by about $4k of value loss. Plan a longer hold.
- Riverside County population projected at +22% by 2050 — long-run rental-demand tailwind backs the buy-and-hold thesis.
- At projected returns (-3.0% appreciation + 3.7% rent growth), your $38k cash investment doubles in ~9 years — after that, you're playing with house money.
Negotiation context
- Only 9 days on market — expect competitive offers; lowballing is unlikely to land.
- Current owner paid $20k; list at $135k implies a 575% gain — meaningful room to come down on a strong offer.
Risks & watch-outs
- Climate carrying-cost: major wildfire risk; extreme-heat days projected 4→12/yr by 2055 (HVAC capex compounding) — expect insurance premiums to compound above CPI over the hold.
Questions for the listing agent
- What does the HOA fee cover, when was the last increase, and are there any pending special assessments or reserve-fund shortfalls?
- Is there a deadline driving the sale (1031 exchange, divorce, estate, relocation)? That informs how much negotiation room exists.
- Schools are F-rated, which usually means shorter tenancies and higher turnover. Who's the typical renter profile here, and what's been the actual vacancy rate?
- Crime grade is D in this area — have there been break-ins, vandalism, or insurance claims at this property in the last 3 years? What carrier currently insures it and at what premium?
- What's the average days-on-market for RENTAL listings here right now (not sales)? A rising rental-DOM trend means longer vacancies and softer asking-rent achievability than the comps imply.
- What's the recent tenant-quality profile in this submarket — average credit score on applications, eviction rate, late-payment / NSF rate, and stable-employment percentage? A property-management company in the area should have these aggregated.
- How much new for-sale + rental construction is in the pipeline within 1–3 miles? Heavy new supply typically softens prices + rents 12–24 months out; constrained supply supports both.
Investment metrics
- 1% rule
- 1.35% ✓
- Cap rate
- 9.72%
- Cash-on-cash
- 12.25%
- DSCR
- 1.55
- GRM
- 6.2
CMA / ARV
- ARV (on-the-fly)
- $91,200
- Comps found
- 6
Show comp detail 6 sales within ~0.75 mi
| Address | Dist | Beds/Ba | Sqft | Sold | Price | $/sf | Match |
|---|---|---|---|---|---|---|---|
| 14777 Palm Dr #95 | 0.11mi | 2/1.0 | 960 (0%) | 0mo | $91,000 | $95 | 90 |
| 14777 Palm #35 | 0.11mi | 2/2.0 | 1,000 (+4%) | 2mo | $90,000 | $90 | 86 |
| 14777 Palm Dr #30 | 0.05mi | 2/2.0 | 1,000 (+4%) | 16mo | $140,000 | $140 | 77 |
| 14881 Palm Dr Unit D-08 | 0.14mi | 2/2.0 | 1,050 (+9%) | 17mo | $42,500 | $40 | 64 |
| 14777 Palm Dr #146 | 0.24mi | 2/2.0 | 1,070 (+12%) | 8mo | $122,000 | $114 | 63 |
| 15225 Palm Dr #8 | 0.26mi | 2/2.0 | 1,040 (+8%) | 21mo | $63,000 | $61 | 56 |
Match score weights: distance 35% · size 25% · config 20% · recency 20%. Top-matched comps best support the ARV.
Projected returns pro-forma
-3.0% appreciation · 3.66% rent growth · sell at horizon
- IRR
- 2.7%
- Equity multiple
- 1.11×
- Total profit
- $4,022
- Equity at exit
- $20,129
- IRR
- 13.0%
- Equity multiple
- 2.07×
- Total profit
- $40,625
- Equity at exit
- $11,672
Cash invested: $37,800 (down + closing). Projections, not guarantees.
Landlord ↔ Tenant lean methodology
- Overall (STATE)
- 18 Strongly Tenant-Friendly
- State California
- 18 Strongly Tenant-Friendly · D+13
- County
- — inherits STATE
- City
- — inherits STATE
ZIP-level market 92240
- Home prices YoY
- -19.6%
- Rents YoY
- 3.7%
- Active inventory
- 515
- Price-to-rent
- 6.2×
Monthly cashflow live
- Estimated rent
- $1,821 high interval (Pro) →
- Mortgage (P&I)
- −$708
- Tax from tax record
- −$73 /mo · $878/yr
- Insurance
- −$56
- HOA
- −$215
- Vacancy / Maint / Mgmt
- −$382
- Net cashflow
- $386
Break-even live
UW: 25.0% down · 7.5% · 30yr · 1.5% tax · 5.0% vac · 8.0% maint · 8.0% mgmt
Financing live
Cash to close
- Down payment
- $33,750
- Closing costs
- $4,050
- Reserves months
- —
- Total cash needed
- —
Loan-product check · same deal, 3 products live
Conventional
25% down · 7.5% · 30yr
- Down + closing
- —
- Monthly P&I
- —
- Monthly cashflow
- —
- DSCR
- —
- Eligible?
- —
Personal DTI + credit; lowest rate.
DSCR
20% down · 8.5% · 30yr
- Down + closing
- —
- Monthly P&I
- —
- Monthly cashflow
- —
- DSCR
- —
- Eligible?
- —
No personal income docs; deal must DSCR.
Hard money
10% down · 12.0% · 12mo
- Down + closing
- —
- Monthly P&I
- —
- Monthly cashflow
- —
- DSCR
- —
- Eligible?
- —
Short-term bridge; refi at stabilization.
Rent comps 17 comps
| Address | Beds | Baths | Sqft | Rent | $/sqft | DOM | Units | Dist |
|---|---|---|---|---|---|---|---|---|
| 13950 West Dr Unit B Desert Hot Springs, CA | 2.0 | 2.0 | 1008 | $1,600 | $1.59 | 1d | 1 | 0.53mi |
| 66590 Joseph Way Unit B Desert Hot Springs, CA | 2.0 | 1.0 | 785 | $2,295 | $2.92 | 24d | 1 | 0.58mi |
| 13895 Luis Dr Desert Hot Springs, CA | 2.0 | 1.0 | 814 | $1,800 | $2.21 | 43d | 1 | 0.64mi |
| 13405 Ocotillo Rd Desert Hot Springs, CA | 2.0 | 1.0 | 864 | $1,750 | $2.03 | 2d | 1 | 0.67mi |
| 66434 Estrella Ave Desert Hot Springs, CA | 2.0 | 2.0 | 850 | $1,800 | $2.12 | 43d | 1 | 1.04mi |
| 66309 Desert View Ave Unit 1 Desert Hot Springs, CA | 2.0 | 1.0 | 800 | $1,650 | $2.06 | 43d | 1 | 1.07mi |
| 66299 Desert View Ave Desert Hot Springs, CA | 2.0 | 1.0 | 800 | $1,650 | $2.06 | 43d | 1 | 1.07mi |
| 15490 Avenida Rambla Desert Hot Springs, CA | 3.0 | 2.0 | 1088 | $2,600 | $2.39 | 43d | 1 | 1.11mi |
| 15490 Avenue Rambla Unit NA Desert Hot Springs, CA | 3.0 | 2.0 | 1088 | $2,600 | $2.39 | 24d | 1 | 1.11mi |
| 66369 Buena Vista Ave Apt A Desert Hot Springs, CA | 3.0 | 2.0 | 931 | $1,499 | $1.61 | 43d | 1 | 1.19mi |
| 66435 Acoma Ave Apt 2 Desert Hot Springs, CA | 2.0 | 1.5 | 775 | $1,525 | $1.97 | 43d | 1 | 1.26mi |
| 66351 First St Unit 2 Desert Hot Springs, CA | 1.0 | 1.0 | 800 | $1,295 | $1.62 | 43d | 1 | 1.39mi |
| 13079 Eliseo Rd Unit 2 Desert Hot Springs, CA | 2.0 | 1.0 | 648 | $1,495 | $2.31 | 22d | 1 | 1.39mi |
| 13079 Eliseo Rd Apt 4 Desert Hot Springs, CA | 2.0 | 1.0 | 648 | $1,500 | $2.31 | 22d | 1 | 1.40mi |
| 66800 Pierson Blvd Desert Hot Springs, CA | 2.0 | 2.0 | 900 | $1,500 | $1.67 | 43d | 1 | 1.42mi |
| 66635 2nd St Unit 2 Desert Hot Springs, CA | 1.0 | 1.0 | 565 | $1,425 | $2.52 | 24d | 1 | 1.47mi |
| 66212 2nd St Desert Hot Springs, CA | 2.0 | 1.0 | 960 | $2,000 | $2.08 | 43d | 1 | 1.50mi |
HOA detail
- Monthly dues
- $215 · $2,580/yr
- Likely covers
- security
Listing history 8 events
-
2026-06-18days on market $135,000 Active 9 DOM
-
2026-06-17days on market $135,000 Active 8 DOM
-
2026-06-16days on market $135,000 Active 7 DOM
-
2026-06-15days on market $135,000 Active 6 DOM
-
2026-06-13days on market $135,000 Active 4 DOM
-
2026-06-13days on market $135,000 Active 3 DOM
-
2026-06-10remarks 693-char remark
-
2026-06-10$135,000 Active 1 DOM
ⓘ Source: listings_history table (triggers on properties + properties_extension) + one-shot
backfill from property_details.listing_events for pre-trigger history.
Tax reassessment forecast CA · Resets to sale price
- Current annual tax
- $878 · $73/mo
- Projected year-2 tax
- $1,026 · $86/mo
- Expected delta
- +$148/yr (+$12/mo · 16.8%)
ⓘ Screening estimate from a state-policy table — verify with the county assessor before closing.
Climate risk First Street
- Flood 1/10 Low FEMA zone X (shaded) · 0% chance over 30 yrs
- Wildfire 6/10 Major
- Heat 8/10 Severe 4 d/yr ≥109°F today · 12 d/yr by 30 yrs out
- Wind 1/10 Low
- Air quality 5/10 Major 8 unhealthy d/yr today · 11 by 30 yrs out
Nearby sold comps map
Loading sold comps map…
Walkable amenities ~0.75 mi
Loading nearby amenities…
Taxation est. · year 1
- Rental income
- $21,848
- − Mortgage interest
- −$7,562
- − Property taxes
- −$878
- − Insurance
- −$675
- − Repairs & maintenance
- −$1,748
- − Management
- −$1,748
- − HOA
- −$2,580
- − Depreciation
- −$3,927
- Taxable income
- $2,730
- Est. tax owed @ 24.0%
- −$655
- After-tax cash flow
- $3,976/yr
For passive investors: Depreciation is non-cash, so a rental often shows a tax loss while cash-flowing — sheltering income. Rental losses are passive: they offset passive income freely, and up to $25,000/yr can offset ordinary (W-2) income if you actively participate and your MAGI is under $100k (phasing out to $0 by $150k); unused losses carry forward. On sale, claimed depreciation is recaptured at up to 25%, and gains may owe capital-gains tax (a 1031 exchange can defer both). Figures are a year-1 estimate at your 24.0% rate — not tax advice; consult a CPA.
Schools (NCES district)
- District
- Palm Springs Unified
- NCES district ID
- 0629550
- Math proficiency
- 21% ▼ -7.00%
- Reading proficiency
- 42% ▬ 0.00%
- Median HH income
- $43,638
- Composite
- 26.76/100
- National rank
- #7131
- State rank
- #328 of 517 in CA
Livability — Desert Hot Springs
- Score
- 49/100
- State rank
- #1149
- US rank
- #25774
Category grades
Schools grade is shown separately in the Schools card above.
Census & demographics
- Census place
- Desert Hot Springs, CA
- County
- Riverside County · 2,287,001 people
- City population
- 41,615
- Metro
- Riverside-San Bernardino-Ontario, CA
- Population (ZIP)
- 41,615
- Household income
- $54,023
- Rent vs Own
- Severe rent burden
- 2095.0
Population outlook (Riverside County) Hauer SSP2
- Today (2025)
- 2,664,475 people
- By 2030
- 2,802,692 · +5.2%
- By 2040
- 3,050,904 · +14.5%
- By 2050
- 3,256,783 · +22.2%
- By 2075
- 3,655,058 · +37.2%
- By 2100
- 3,766,594 · +41.4%
Race, ethnicity, and origin ACS 2023
- Neighborhood character
- Majority Hispanic (64%)
- Race & ethnicity
- Hispanic / Latino 64% Two or more races 27% White 23% Black 7% Native American 2% Asian 2%
- Hispanic origin (detail)
- Mexican 53%
- Common ancestry
- Lithuanian 1% Romanian 1% Italian 1%
- Foreign-born
- 27% · Canada, Vietnam
- Languages at home
- 47% English-only · Spanish 50% Russian/Polish/Slavic 1%
Political lean MEDSL · Riverside
- 2024 margin
- Toss-up / Even · D 48.0% · R 49.3% · Other 2.6%
- 2008→2024 swing
- -3.6pp toward R · 2008: 2.3pp · 2024: -1.3pp
- All cycles
- 2024: R+1.3 2020: D+8.0 2016: D+4.3 2012: R+0.4 2008: D+2.3
Not yet ingested
- Civics
- —
Market trends
- HPI YoY
- ▼ -102.10%
- Current HPI
- 418.4691
- Rent YoY
- ▲ 3.66%
- Metro
- Riverside-San Bernardino-Ontario, CA
- State GDP YoY
- ▲ 3.21%
- F500 in state
- 116
Industry mix (Fortune 500 HQ in CA)
| Industry | F500 HQs | Revenue |
|---|---|---|
| Technology | 27 | $1,492B |
|
||
| Financial Services | 3 | $174B |
|
||
| Retail | 3 | $44B |
|
||
| Insurance | 3 | $26B |
|
||
| Media / Entertainment | 2 | $115B |
|
||
| Pharmaceuticals / Biotech | 2 | $62B |
|
||
Price history
+575.0% since first listed2 events — show timeline
- 2026-06-09 Listed $135,000 CRMLS
- 1990-05-02 Sold (Public Records) $20,000 Public Records
Property tax history
+6.9%/yrLatest (2025): $878 · +137.3% YoY. Source: county tax records.
Cash-flow waterfall
monthlySold comps — $/sqft
last 12 mo · ≤1 miLoading sold comps…