529 Oaks Rd · Greensburg, KY
Flood risk 1/10 · Minimal
- FEMA flood zone
- X (unshaded)
- Chance of flooding over 30 yrs
- 0.0%
- Est. flood insurance / yr
- $507 – $1,088
Fire risk 5/10 · Moderate
- Est. fire insurance / yr
- $839 – $1,559
Heat risk 5/10 · Moderate
- Hot days now (above 105°F)
- 7 days/yr
- Hot days in 30 yrs
- 20 days/yr
Wind risk 2/10 · Minimal
- Chance of severe wind over 30 yrs
- 3.0%
Air-quality risk 1/10 · Minimal
- Unhealthy air days now
- 0 days/yr
- Unhealthy air days in 30 yrs
- 0 days/yr
Risk factors via First Street. Map © Google.
Why this score? — see what drove the D grade
The composite is a weighted blend of 9 inputs, each scored 0–100. Each bar is that input's sub-score; the figure is the points it added to the 100-point composite (weight × sub-score).
- Cash flow +11.8/30.0
- ARV discount +7.5/15.0
- Appreciation +7.5/10.0
- Livability +3.6/5.0
- DSCR +3.5/10.0
- Schools +3.4/10.0
- Rent growth +2.5/5.0
- Condition / age +2.5/5.0
- 1% rule +2.1/10.0
$120,000
🖨 Deal sheet (PDF) 📄 Offer letter ✓ Due diligence
Listing remarks
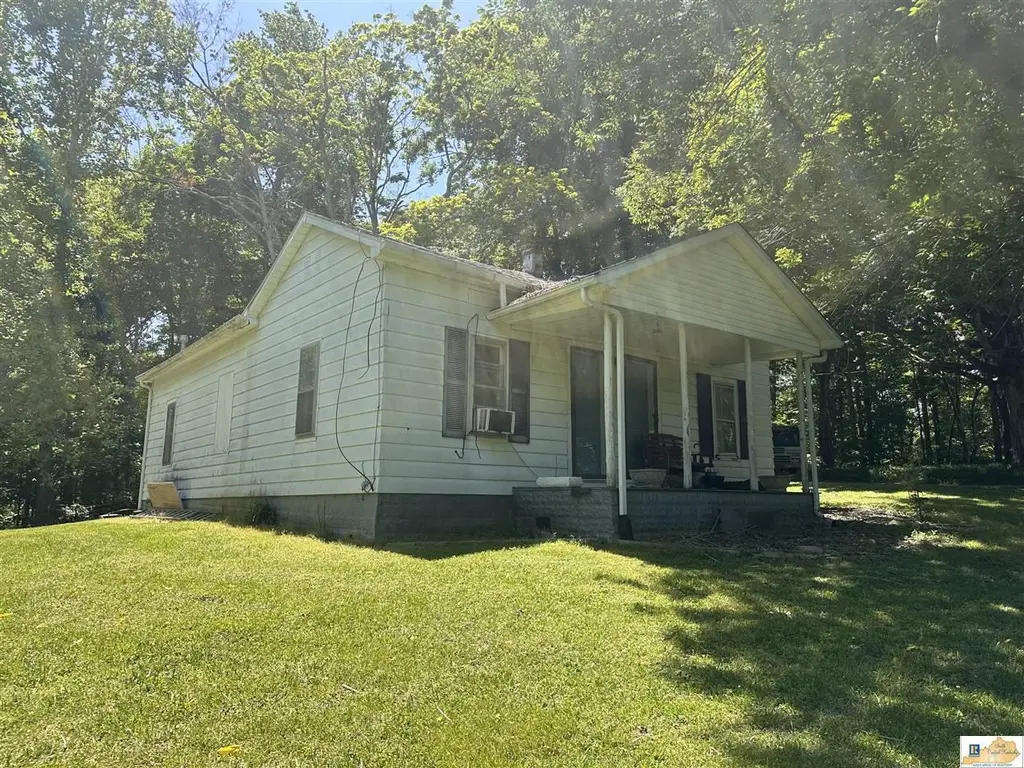
If your looking for that home in the country with some acreage, then check out this property.
Key facts
- 11 acre lot
- Built 1910
- Listed 34 days
Property features AI
Finance
- Other: Lot size: 11 acres
- Financial info: No financial or investor details provided
- HOA & community: No HOA or community information provided
Exterior
- Parking: Gravel parking
- Security: No security features provided
- Utilities: Septic tank sewer
- Home design: Single-family residence (Residential); Property faces unspecified direction
- Construction: Frame construction; Year built not provided
- Exterior features: Front porch; Shingle roof
Interior
- Kitchen: No kitchen appliance details provided
- Bedrooms: Details not provided
- Flooring: Hardwood; Vinyl
- Bathrooms: 1 full bathroom (main level)
- Heating & cooling: Space heater
- Interior features: Electric water heater
- Laundry & utility: No laundry appliance details provided
Neighborhood map
What this means for you Summary
Snapshot
- This is a 2-bed/1.0-bath single-family listed at $120k.
Deal economics
- At list price, monthly cash flow is $-34 ($-404/yr) — negative.
- To cash-flow at today's rent, offer at most $114k (5.0% below list).
- To meet the 1% rule (rent ≥ 1% of price), the offer needs to be $85k (29.1% below list).
- Recommended offer: $85k (29.1% below list) — sets the bar for 1% rule.
Location & tenants
- Location reads 71/100 on livability (#146 in KY) — a middle-class / working-renter tenant base. Strengths: cost of living A+, housing A+, health & safety A+; Watch: amenities F, commute F, employment F.
- Green County (rural): math 39% / reading 43% proficiency, ranked #30 of 165 in KY (top 18%) — families likely to look elsewhere, expect single-tenant / working-renter base with shorter leases.
- Zoned schools: Green County Primary School (448 students, 64% FRL); Green County Middle School (math 39% / reading 47%, grade D-, #43 of 217 statewide, top 21%, 377 students, 63% FRL).
- Market conditions: 56 active listings in the ZIP; 3 units permitted in Green County in 2024 (0 in 5+ unit buildings).
Forward outlook
- In year one you build about $7k of equity ($830 loan paydown + $6k appreciation (5.0% local appreciation)).
- Green County population projected at -23% by 2050 — secular population decline; favor cash flow + early exit over multi-decade hold.
- At projected returns (5.0% appreciation + 3.0% rent growth), your $34k cash investment doubles in ~5 years — after that, you're playing with house money.
- By year 6, paydown + projected appreciation supports a ~$37k cash-out refi (75% LTV) — recoverable capital for the next deal without selling this one.
Negotiation context
- It's been on market 35 days — a 3% lower offer ($116k) is reasonable based on typical stale-listing flexibility.
Risks & watch-outs
- Watch-outs: built in 1910 — expect roof / HVAC / electrical / plumbing capex.
- Climate carrying-cost: moderate wildfire risk; extreme-heat days projected 7→20/yr by 2055 (HVAC capex compounding) — expect insurance premiums to compound above CPI over the hold.
Questions for the listing agent
- What do current leases actually rent for vs. the listed asking? Can we see a recent rent roll and the last 12 months of T-12 income?
- It's been on market 35 days. Have you received any prior offers? Is the seller open to a 29% concession, seller financing, or rate buy-down credit?
- Built in 1910 — when were the roof, HVAC, electrical panel, plumbing, and water heater last replaced?
- Is there a deadline driving the sale (1031 exchange, divorce, estate, relocation)? That informs how much negotiation room exists.
- The area grade is low — what's the realistic commute time and amenity access for the typical tenant pool here? Any planned neighborhood developments (good or bad) we should know about?
- What's the average days-on-market for RENTAL listings here right now (not sales)? A rising rental-DOM trend means longer vacancies and softer asking-rent achievability than the comps imply.
- What's the recent tenant-quality profile in this submarket — average credit score on applications, eviction rate, late-payment / NSF rate, and stable-employment percentage? A property-management company in the area should have these aggregated.
- How much new for-sale + rental construction is in the pipeline within 1–3 miles? Heavy new supply typically softens prices + rents 12–24 months out; constrained supply supports both.
Investment metrics
- 1% rule
- 0.71% ✗
- Cap rate
- 5.96%
- Cash-on-cash
- -1.20%
- DSCR
- 0.95
- GRM
- 11.8
CMA / ARV
No comps found within radius.
Projected returns pro-forma
5.0% appreciation · 3.0% rent growth · sell at horizon
- IRR
- 11.8%
- Equity multiple
- 1.76×
- Total profit
- $25,451
- Equity at exit
- $68,002
- IRR
- 12.9%
- Equity multiple
- 3.34×
- Total profit
- $78,697
- Equity at exit
- $117,363
Cash invested: $33,600 (down + closing). Projections, not guarantees.
Landlord ↔ Tenant lean methodology
- Overall (STATE)
- 83 Strongly Landlord-Friendly
- State Kentucky
- 83 Strongly Landlord-Friendly · R+16
- County
- — inherits STATE
- City
- — inherits STATE
ZIP-level market 42743
- Home prices YoY
- 1.9%
- Active inventory
- 56
- Price-to-rent
- 11.8×
Monthly cashflow live
- Estimated rent
- $851 medium interval (Pro) →
- Mortgage (P&I)
- −$629
- Tax from tax record
- −$27 /mo · $318/yr
- Insurance
- −$50
- HOA
- −$0
- Vacancy / Maint / Mgmt
- −$179
- Net cashflow
- $-34
Break-even live
Sensitivity live
| Price | -10% $34 | -5% $0 | +0% $-34 | +5% $-68 | +10% $-102 |
|---|---|---|---|---|---|
| Rent | -10% $-101 | -5% $-67 | +0% $-34 | +5% $0 | +10% $34 |
| Rate | -1.0pp $27 | -0.5pp $-3 | base $-34 | +0.5pp $-65 | +1.0pp $-96 |
UW: 25.0% down · 7.5% · 30yr · 1.5% tax · 5.0% vac · 8.0% maint · 8.0% mgmt
Financing live
Cash to close
- Down payment
- $30,000
- Closing costs
- $3,600
- Reserves months
- —
- Total cash needed
- —
Loan-product check · same deal, 3 products live
Conventional
25% down · 7.5% · 30yr
- Down + closing
- —
- Monthly P&I
- —
- Monthly cashflow
- —
- DSCR
- —
- Eligible?
- —
Personal DTI + credit; lowest rate.
DSCR
20% down · 8.5% · 30yr
- Down + closing
- —
- Monthly P&I
- —
- Monthly cashflow
- —
- DSCR
- —
- Eligible?
- —
No personal income docs; deal must DSCR.
Hard money
10% down · 12.0% · 12mo
- Down + closing
- —
- Monthly P&I
- —
- Monthly cashflow
- —
- DSCR
- —
- Eligible?
- —
Short-term bridge; refi at stabilization.
Listing history 19 events
-
2026-06-22days on market $120,000 Active 35 DOM
-
2026-06-21days on market $120,000 Active 34 DOM
-
2026-06-21days on market $120,000 Active 33 DOM
-
2026-06-18days on market $120,000 Active 31 DOM
-
2026-06-17days on market $120,000 Active 30 DOM
-
2026-06-16days on market $120,000 Active 29 DOM
-
2026-06-15days on market $120,000 Active 28 DOM
-
2026-06-13days on market $120,000 Active 26 DOM
-
2026-06-12days on market $120,000 Active 25 DOM
-
2026-06-09days on market $120,000 Active 22 DOM
-
2026-06-08days on market $120,000 Active 21 DOM
-
2026-06-07days on market $120,000 Active 20 DOM
-
2026-06-07days on market $120,000 Active 19 DOM
-
2026-06-04days on market $120,000 Active 16 DOM
-
2026-06-02days on market $120,000 Active 15 DOM
-
2026-06-01days on market $120,000 Active 14 DOM
-
2026-05-31days on market $120,000 Active 13 DOM
-
2026-05-31days on market $120,000 Active 12 DOM
-
2026-05-12$120,000 Active
ⓘ Source: listings_history table (triggers on properties + properties_extension) + one-shot
backfill from property_details.listing_events for pre-trigger history.
Tax reassessment forecast KY · Resets to sale price
- Current annual tax
- $318 · $27/mo
- Projected year-2 tax
- $1,032 · $86/mo
- Expected delta
- +$714/yr (+$59/mo · 224.1%)
ⓘ Screening estimate from a state-policy table — verify with the county assessor before closing.
Climate risk First Street
- Flood 1/10 Low FEMA zone X (unshaded) · 0% chance over 30 yrs
- Wildfire 5/10 Major
- Heat 5/10 Major 7 d/yr ≥105°F today · 20 d/yr by 30 yrs out
- Wind 2/10 Low 3% chance of damaging wind over 30 yrs
- Air quality 1/10 Low 0 unhealthy d/yr today · 0 by 30 yrs out
Nearby sold comps map
Loading sold comps map…
Walkable amenities ~0.75 mi
Loading nearby amenities…
Taxation est. · year 1
- Rental income
- $10,210
- − Mortgage interest
- −$6,722
- − Property taxes
- −$318
- − Insurance
- −$600
- − Repairs & maintenance
- −$817
- − Management
- −$817
- − Depreciation
- −$3,491
- Taxable loss
- −$2,555
- Est. tax savings @ 24.0%
- +$613
- After-tax cash flow
- $209/yr
For passive investors: Depreciation is non-cash, so a rental often shows a tax loss while cash-flowing — sheltering income. Rental losses are passive: they offset passive income freely, and up to $25,000/yr can offset ordinary (W-2) income if you actively participate and your MAGI is under $100k (phasing out to $0 by $150k); unused losses carry forward. On sale, claimed depreciation is recaptured at up to 25%, and gains may owe capital-gains tax (a 1031 exchange can defer both). Figures are a year-1 estimate at your 24.0% rate — not tax advice; consult a CPA.
Schools (NCES district)
- District
- Green County
- NCES district ID
- 2102340
- Math proficiency
- 39% ▼ -14.00%
- Reading proficiency
- 43% ▼ -16.00%
- Median HH income
- $35,616
- Composite
- 33.94/100
- National rank
- #5332
- State rank
- #30 of 165 in KY
Livability — Greensburg
- Score
- 71/100
- State rank
- #146
- US rank
- #6845
Category grades
Schools grade is shown separately in the Schools card above.
Census & demographics
- Population (ZIP)
- 9,008
Population outlook (Green County) Hauer SSP2
- Today (2025)
- 10,576 people
- By 2030
- 10,191 · -3.6%
- By 2040
- 9,263 · -12.4%
- By 2050
- 8,189 · -22.6%
- By 2075
- 5,849 · -44.7%
- By 2100
- 3,833 · -63.8%
Race, ethnicity, and origin ACS 2023
- Neighborhood character
- Predominantly White (92%)
- Race & ethnicity
- White 92% Two or more races 3% Hispanic / Latino 3% Black 2%
- Common ancestry
- Slovak 2% Lithuanian 1% Serbian 1%
- Foreign-born
- 0%
- Languages at home
- 97% English-only · German/W. Germanic 2%
Political lean MEDSL · Green
- 2024 margin
- Solid R (+72.6) · D 13.3% · R 85.9%
- 2008→2024 swing
- -21.8pp toward R · 2008: -50.8pp · 2024: -72.6pp
- All cycles
- 2024: R+72.6 2020: R+67.4 2016: R+66.4 2012: R+50.9 2008: R+50.8
Not yet ingested
- Civics
- —
Market trends
- HPI YoY
- ▲ 5.00%
- Current HPI
- 265.9882
- Rent YoY
- —
- Metro
- —
- State GDP YoY
- ▲ 1.81%
- F500 in state
- 4
Industry mix (Fortune 500 HQ in KY)
| Industry | F500 HQs | Revenue |
|---|---|---|
| Healthcare | 1 | $118B |
|
||
| Food / Beverage | 1 | $7B |
|
||
Price history
1 event — show timeline
- 2026-05-12 Listed $120,000 SCKMLSKY
Property tax history
+0.4%/yrLatest (2025): $318 · -2.1% YoY. Source: county tax records.
Cash-flow waterfall
monthlySold comps — $/sqft
last 12 mo · ≤1 miLoading sold comps…