 Multi-family
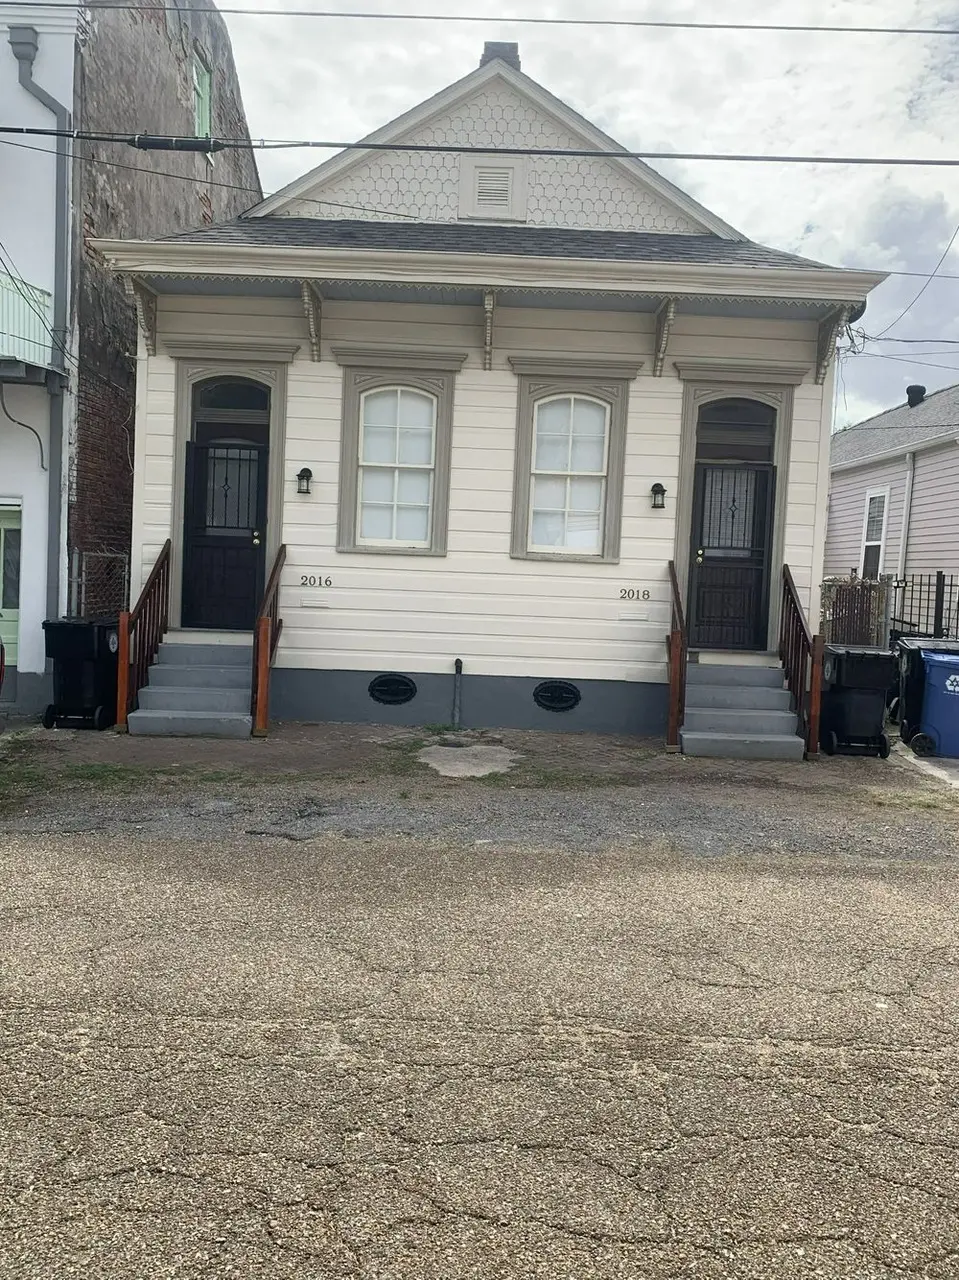
2016 Barracks St · New Orleans, LA
Flood risk 7/10 · Major
- FEMA flood zone
- X
- Chance of flooding over 30 yrs
- 0.6%
- Est. flood insurance / yr
- $507 – $1,088
Fire risk 1/10 · Minimal
- Est. fire insurance / yr
- $1,269 – $2,357
Heat risk 10/10 · Severe
- Hot days now (above 108°F)
- 7 days/yr
- Hot days in 30 yrs
- 21 days/yr
Wind risk 10/10 · Severe
- Chance of severe wind over 30 yrs
- 99.0%
Air-quality risk 4/10 · Minor
- Unhealthy air days now
- 4 days/yr
- Unhealthy air days in 30 yrs
- 4 days/yr
Risk factors via First Street. Map © Google.
Why this score? — see what drove the D+ grade
The composite is a weighted blend of 9 inputs, each scored 0–100. Each bar is that input's sub-score; the figure is the points it added to the 100-point composite (weight × sub-score).
- Cash flow +22.2/30.0
- DSCR +7.1/10.0
- 1% rule +5.5/10.0
- Livability +4.0/5.0
- Rent growth +2.5/5.0
- Condition / age +2.5/5.0
- Schools +1.6/10.0
- ARV discount +1.3/15.0
- Appreciation +0.0/10.0
$295,000
🖨 Deal sheet 📄 Offer letter ✓ Due diligence
Multi-family units
County records classify this as Multi-Family (2-4 Unit). Listing-text estimate: 1 unit. estimate disagrees with records
Listing remarks
Investor or owner-occupant opportunity in the desirable Esplanade Ridge area. This classic New Orleans shotgun double offers strong income potential with both units ready for occupancy. Each side features 2 bedrooms, 1 bathroom with clawfoot tub, a living area, full kitchen with stove and refrigerator, and a utility room with washer and dryer. Both units also include screened-in porches, making this a functional and appealing setup for tenants or an owner living in one side while renting the other. The property sits on a 3,000 sq ft lot with approximately 2,400 sq ft under roof. Each unit has its own backyard space with secure fencing. The 2016 side includes 12 ft ceilings, original mantels
Key facts
- Original mantels
- 12 ft ceilings
- Clawfoot tub
Tags
Property features AI
Exterior
- Home design: Multi-family property
- Exterior features: Lot of approximately 3,000 sq ft
Neighborhood map
What this means for you Summary
Snapshot
- This is a 4-bed/2.0-bath multifamily listed at $295k.
Deal economics
- At list price, monthly cash flow is $417 ($5k/yr) — positive.
- The deal already cash-flows at list — no discount required.
- Meets the 1% rule at list price ($3k rent vs $295k).
- Cap rate 8.3% vs local median 4.4% in New Orleans — top-decile yield for the area; either an underpriced asset or a hidden risk that comps aren't pricing in. Stress-test before assuming the spread holds.
Location & tenants
- Location reads 81/100 on livability (#3 in LA, #1,383 nationally) — a professional / high-income tenant draw. Strengths: amenities A+, commute A+, health & safety A+; Watch: crime C-, employment D.
- Orleans Parish (urban): math 11% / reading 27% proficiency, ranked #69 of 98 in LA (top 70%) — low school quality limits family demand, transient renter base, plan for 1-2y turnover; 68% free/reduced lunch — lower-income household profile, screen leases tightly.
- Market conditions: Rents flat; 350 active listings in the ZIP; 40 comparable units currently listed for rent nearby; rentals at typical pace (median 24d on market — plan ~3-4 weeks tenant-placement turnaround); 710 units permitted in Orleans Parish in 2024 (244 in 5+ unit buildings).
- At $3,085/mo this rent would consume 71% of the median local household income ($52k/yr) (locally 1001% of renters already pay >50% of income on rent) — very limited rent-growth headroom before tenants either downsize or default.
Forward outlook
- Local home prices are declining (-3.0%/yr); year-one equity from $2k of loan paydown is wiped out by about $9k of value loss. Plan a longer hold.
- Orleans County population projected at +61% by 2050 — long-run rental-demand tailwind backs the buy-and-hold thesis.
Negotiation context
- Only 14 days on market — expect competitive offers; lowballing is unlikely to land.
- 3 sale attempts since 28y ago with the ask held roughly flat each time — persistent listings suggest the price (not the market) is what's stuck; bring a comps-based counter.
- Current owner paid $30k; list at $295k implies a 900% gain — meaningful room to come down on a strong offer.
Risks & watch-outs
- Watch-outs: flood insurance adds $66/mo; built in 1920 — expect roof / HVAC / electrical / plumbing capex.
- Climate carrying-cost: major flood risk; severe wind risk, 99% chance of damaging wind over 30y; extreme-heat days projected 7→21/yr by 2055 (HVAC capex compounding) — expect insurance premiums to compound above CPI over the hold.
Questions for the listing agent
- Built in 1920 — when were the roof, HVAC, electrical panel, plumbing, and water heater last replaced?
- What's the actual annual flood-insurance premium (NFIP or private), and is the property in a SFHA with mandatory coverage?
- Is there a deadline driving the sale (1031 exchange, divorce, estate, relocation)? That informs how much negotiation room exists.
- The area grade is low — what's the realistic commute time and amenity access for the typical tenant pool here? Any planned neighborhood developments (good or bad) we should know about?
- What's the average days-on-market for RENTAL listings here right now (not sales)? A rising rental-DOM trend means longer vacancies and softer asking-rent achievability than the comps imply.
- What's the recent tenant-quality profile in this submarket — average credit score on applications, eviction rate, late-payment / NSF rate, and stable-employment percentage? A property-management company in the area should have these aggregated.
- How much new apartment / multifamily construction is in the pipeline within 1–3 miles? Heavy new supply (>2% of stock underway) typically softens rents 12–24 months out; light construction supports rent growth.
Investment metrics
- 1% rule
- 1.05% ✓
- Cap rate
- 8.26%
- Cash-on-cash
- 7.02%
- DSCR
- 1.31
- GRM
- 8.0
CMA / ARV
- ARV (on-the-fly)
- $259,500
- Comps found
- 12
Show comp detail 12 sales within ~0.75 mi
| Address | Dist | Beds/Ba | Sqft | Sold | Price | $/sf | Match |
|---|---|---|---|---|---|---|---|
| 2118 20 Onzaga St | 0.44mi | 4/2.0 | 1,526 (+2%) | 1mo | $182,000 | $119 | 76 |
| 2612-2614 St. Philip St | 0.46mi | 4/2.0 | 1,517 (+1%) | 3mo | $299,000 | $197 | 74 |
| 2643 45 Dumaine St | 0.52mi | 4/2.0 | 1,479 (-1%) | 3mo | $298,000 | $201 | 71 |
| 917 N Prieur St | 0.24mi | 4/2.0 | 1,700 (+13%) | 4mo | $315,000 | $185 | 64 |
| 1552 54 N Derbigny St | 0.35mi | 4/3.0 | 1,681 (+12%) | 5mo | $330,000 | $196 | 56 |
| 2013-15 Conti St | 0.60mi | 4/2.0 | 1,610 (+7%) | 5mo | $65,000 | $40 | 56 |
| 1627 - 1629 Urquhart St | 0.54mi | 4/2.0 | 1,366 (-9%) | 7mo | $192,500 | $141 | 54 |
| 2828 30 St Ann St | 0.74mi | 4/3.5 | 1,534 (+2%) | 5mo | $265,000 | $173 | 52 |
| 2216-18 Saint Louis St | 0.58mi | 4/2.0 | 1,689 (+13%) | 1mo | $335,000 | $198 | 52 |
| 2520 22 D'abadie St | 0.70mi | 4/2.0 | 1,632 (+9%) | 3mo | $278,600 | $171 | 50 |
| 1353 - 55 Annette St | 0.58mi | 4/2.0 | 1,300 (-13%) | 1mo | $151,000 | $116 | 50 |
| 2025 Conti St | 0.61mi | 4/2.0 | 1,680 (+12%) | 7mo | $285,000 | $170 | 46 |
Match score weights: distance 35% · size 25% · config 20% · recency 20%. Top-matched comps best support the ARV.
Projected returns pro-forma
-3.0% appreciation · 0.18% rent growth · sell at horizon
- IRR
- -10.2%
- Equity multiple
- 0.64×
- Total profit
- $-29,750
- Equity at exit
- $43,985
- IRR
- -5.2%
- Equity multiple
- 0.70×
- Total profit
- $-24,617
- Equity at exit
- $25,506
Cash invested: $82,600 (down + closing). Projections, not guarantees.
Landlord ↔ Tenant lean methodology
- Overall (STATE)
- 90 Strongly Landlord-Friendly
- State Louisiana
- 90 Strongly Landlord-Friendly · R+12
- County
- — inherits STATE
- City
- — inherits STATE
ZIP-level market 70116
- Home prices YoY
- -34.5%
- Rents YoY
- 0.2%
- Active inventory
- 350
- Price-to-rent
- 15.9×
Monthly cashflow live
- Estimated rent
- $3,085 high interval (Pro) →
- Mortgage (P&I)
- −$1,547
- Tax from tax record
- −$284 /mo · $3,410/yr
- Insurance
- −$123
- Flood insurance flood zone
- −$66 /mo · $798/yr
- HOA
- −$0
- Vacancy / Maint / Mgmt
- −$648
- Net cashflow
- $417
Break-even live
2-unit breakdown (identical units grouped — click to expand)
| Units | Beds | Baths | Est. rent |
|---|---|---|---|
| 2× units | 2 | 1 | $3,086 |
| #1 | 2 | 1 | $1,543 |
| #2 | 2 | 1 | $1,543 |
| Total (2 units) | $3,085 | ||
UW: 25.0% down · 7.5% · 30yr · 1.5% tax · 5.0% vac · 8.0% maint · 8.0% mgmt
Financing live
Cash to close
- Down payment
- $73,750
- Closing costs
- $8,850
- Reserves months
- —
- Total cash needed
- —
Loan-product check · same deal, 3 products live
Conventional
25% down · 7.5% · 30yr
- Down + closing
- —
- Monthly P&I
- —
- Monthly cashflow
- —
- DSCR
- —
- Eligible?
- —
Personal DTI + credit; lowest rate.
DSCR
20% down · 8.5% · 30yr
- Down + closing
- —
- Monthly P&I
- —
- Monthly cashflow
- —
- DSCR
- —
- Eligible?
- —
No personal income docs; deal must DSCR.
Hard money
10% down · 12.0% · 12mo
- Down + closing
- —
- Monthly P&I
- —
- Monthly cashflow
- —
- DSCR
- —
- Eligible?
- —
Short-term bridge; refi at stabilization.
Rent comps 40 comps
| Address | Beds | Baths | Sqft | Rent | $/sqft | DOM | Units | Dist |
|---|---|---|---|---|---|---|---|---|
| 1035 N Derbigny St New Orleans, LA | 3.0 | 1.0 | 1075 | $1,399 | $1.30 | 23d | 1 | 0.22mi |
| 1929 Dumaine St New Orleans, LA | 3.0 | 1.0 | 1293 | $1,500 | $1.16 | 3d | 1 | 0.28mi |
| 2129 Dumaine St New Orleans, LA | 3.0 | 2.0 | 1226 | $1,850 | $1.51 | 3d | 1 | 0.30mi |
| 1472 N Claiborne Ave New Orleans, LA | 3.0 | 1.0 | 1312 | $1,900 | $1.45 | 16d | 1 | 0.30mi |
| 2331 Columbus St New Orleans, LA | 3.0 | 1.0 | 1976 | $1,850 | $0.94 | 23d | 1 | 0.35mi |
| 2517 Ursulines Ave New Orleans, LA | 3.0 | 2.0 | 1136 | $1,950 | $1.72 | 23d | 1 | 0.36mi |
| 2329 Laharpe St New Orleans, LA | 3.0 | 1.0 | 1250 | $1,000 | $0.80 | 19d | 1 | 0.39mi |
| 1247 Kerlerec St New Orleans, LA | 3.0 | 2.0 | 1500 | $2,500 | $1.67 | 43d | 1 | 0.49mi |
| 1245 Kerlerec St New Orleans, LA | 3.0 | 2.0 | 1500 | $2,500 | $1.67 | 43d | 1 | 0.49mi |
| 1217 Kerlerec St Unit B New Orleans, LA | 3.0 | 1.0 | 1300 | $2,100 | $1.62 | 3d | 1 | 0.53mi |
| 1021 Henriette Delille St New Orleans, LA | 3.0 | 2.0 | 2012 | $2,250 | $1.12 | 17d | 1 | 0.56mi |
| 1525 N Broad St New Orleans, LA | 3.0 | 1.0 | 1100 | $1,600 | $1.45 | 23d | 1 | 0.58mi |
| 1735 N Tonti St New Orleans, LA | 3.0 | 1.0 | 1197 | $1,650 | $1.38 | 23d | 1 | 0.58mi |
| 1908 Saint Louis St New Orleans, LA | 3.0 | 3.0 | 1234 | $2,300 | $1.86 | 23d | 1 | 0.60mi |
| 2731 Saint Philip St Unit 2733 New Orleans, LA | 4.0 | 2.0 | 2000 | $2,600 | $1.30 | 23d | 1 | 0.60mi |
| 2664 Lepage St New Orleans, LA | 3.0 | 2.0 | 1750 | $2,725 | $1.56 | 43d | 1 | 0.62mi |
| 2033 Conti St New Orleans, LA | 3.0 | 3.0 | 1249 | $2,250 | $1.80 | 14d | 1 | 0.64mi |
| 1831 N Miro St New Orleans, LA | 3.0 | 2.0 | 1882 | $2,500 | $1.33 | 43d | 1 | 0.67mi |
| 324 N Roman St New Orleans, LA | 3.0 | 3.0 | 2100 | $2,500 | $1.19 | 43d | 1 | 0.68mi |
| 2320 Conti St New Orleans, LA | 3.0 | 2.0 | 1125 | $2,500 | $2.22 | 23d | 1 | 0.69mi |
| 2105 Bienville St New Orleans, LA | 3.0 | 3.0 | 1231 | $2,350 | $1.91 | 17d | 1 | 0.69mi |
| 315 N Miro St New Orleans, LA | 3.0 | 3.0 | 1276 | $2,300 | $1.80 | 20d | 1 | 0.71mi |
| 315 N Miro St New Orleans, LA | 3.0 | 3.0 | 1276 | $2,500 | $1.96 | 23d | 1 | 0.71mi |
| 1936 N Johnson St Unit 36 New Orleans, LA | 3.0 | 2.0 | 1844 | $2,400 | $1.30 | 23d | 1 | 0.71mi |
| 1938 N Johnson St Unit 38 New Orleans, LA | 3.0 | 2.0 | 1844 | $2,400 | $1.30 | 23d | 1 | 0.72mi |
| 928 Kerlerec St New Orleans, LA | 3.0 | 3.5 | 1684 | $2,750 | $1.63 | 3d | 1 | 0.72mi |
| 928 Kerlerec St New Orleans, LA | 3.0 | 3.5 | 1684 | $2,750 | $1.63 | 3d | 1 | 0.72mi |
| 1923 N Robertson St New Orleans, LA | 3.0 | 2.0 | 1051 | $1,950 | $1.86 | 3d | 1 | 0.72mi |
| 2024 Bienville St New Orleans, LA | 3.0 | 2.0 | 1314 | $2,100 | $1.60 | 23d | 1 | 0.72mi |
| 1466 N White St New Orleans, LA | 3.0 | 1.5 | 1500 | $2,250 | $1.50 | 3d | 1 | 0.73mi |
| 824 N Dupre St New Orleans, LA | 3.0 | 2.0 | 1315 | $2,250 | $1.71 | 17d | 1 | 0.74mi |
| 811 Burgundy St New Orleans, LA | 4.0 | 2.5 | 2059 | $5,000 | $2.43 | 43d | 1 | 0.76mi |
| 618 N Rampart St #204 New Orleans, LA | 3.0 | 2.5 | 1904 | $4,500 | $2.36 | 43d | 1 | 0.79mi |
| 1837 Touro St New Orleans, LA | 3.0 | 1.0 | 1994 | $2,000 | $1.00 | 23d | 1 | 0.83mi |
| 734 Ursulines Ave New Orleans, LA | 3.0 | 2.0 | 1340 | $2,800 | $2.09 | 43d | 1 | 0.85mi |
| 2338 Annette St Unit 1 New Orleans, LA | 3.0 | 1.0 | 1150 | $1,400 | $1.22 | 19d | 1 | 0.85mi |
| 1818 Paul Morphy St Unit B New Orleans, LA | 3.0 | 2.0 | 1065 | $1,800 | $1.69 | 23d | 1 | 0.86mi |
| 2920 Pauger St New Orleans, LA | 4.0 | 2.0 | 1882 | $1,995 | $1.06 | 23d | 1 | 0.88mi |
| 1418 Royal St Unit 1418 New Orleans, LA | 4.0 | 2.0 | 1300 | $2,450 | $1.88 | 23d | 1 | 0.91mi |
| 2738 Bienville St New Orleans, LA | 4.0 | 3.0 | 1671 | $2,200 | $1.32 | 23d | 1 | 0.92mi |
Listing history 11 events
-
2026-06-18days on market $295,000 Active 14 DOM
-
2026-06-17days on market $295,000 Active 13 DOM
-
2026-06-16days on market $295,000 Active 12 DOM
-
2026-06-15days on market $295,000 Active 11 DOM
-
2026-06-13days on market $295,000 Active 9 DOM
-
2026-06-10days on market $295,000 Active 6 DOM
-
2026-06-09days on market $295,000 Active 5 DOM
-
2026-06-08days on market $295,000 Active 4 DOM
-
2026-06-07pricedays on market $295,000 Active 3 DOM
-
2026-06-05remarks 699-char remark
-
2026-06-05$309,500 Active 1 DOM
ⓘ Source: listings_history table (triggers on properties + properties_extension) + one-shot
backfill from property_details.listing_events for pre-trigger history.
Tax reassessment forecast LA · Resets to sale price
- Current annual tax
- $3,410 · $284/mo
- Projected year-2 tax
- $3,410 · $284/mo
- Expected delta
- $0/yr ($0/mo · 0.0%)
ⓘ Screening estimate from a state-policy table — verify with the county assessor before closing.
Climate risk First Street
- Flood 7/10 Severe FEMA zone X · 60% chance over 30 yrs
- Wildfire 1/10 Low
- Heat 10/10 Extreme 7 d/yr ≥108°F today · 21 d/yr by 30 yrs out
- Wind 10/10 Extreme 99% chance of damaging wind over 30 yrs
- Air quality 4/10 Moderate 4 unhealthy d/yr today · 4 by 30 yrs out
Nearby sold comps map
Loading sold comps map…
Walkable amenities ~0.75 mi
Loading nearby amenities…
Taxation est. · year 1
- Rental income
- $37,020
- − Mortgage interest
- −$16,525
- − Property taxes
- −$3,410
- − Insurance
- −$2,272
- − Repairs & maintenance
- −$2,962
- − Management
- −$2,962
- − Depreciation
- −$8,582
- Taxable income
- $307
- Est. tax owed @ 24.0%
- −$74
- After-tax cash flow
- $4,925/yr
For passive investors: Depreciation is non-cash, so a rental often shows a tax loss while cash-flowing — sheltering income. Rental losses are passive: they offset passive income freely, and up to $25,000/yr can offset ordinary (W-2) income if you actively participate and your MAGI is under $100k (phasing out to $0 by $150k); unused losses carry forward. On sale, claimed depreciation is recaptured at up to 25%, and gains may owe capital-gains tax (a 1031 exchange can defer both). Figures are a year-1 estimate at your 24.0% rate — not tax advice; consult a CPA.
Schools (NCES district)
- District
- Orleans Parish
- NCES district ID
- 2201170
- Math proficiency
- 11% ▼ -52.00%
- Reading proficiency
- 27% ▼ -46.00%
- Median HH income
- $37,011
- Composite
- 15.78/100
- National rank
- #9271
- State rank
- #69 of 98 in LA
Livability — New Orleans
- Score
- 81/100
- State rank
- #3
- US rank
- #1383
Category grades
Schools grade is shown separately in the Schools card above.
Census & demographics
- Census place
- New Orleans, LA
- County
- Orleans Parish · 338,817 people
- City population
- 338,817
- Metro
- New Orleans-Metairie, LA
- Population (ZIP)
- 10,404
- Household income
- $52,306
- Rent vs Own
- Severe rent burden
- 1001.0
Population outlook (Orleans County) Hauer SSP2
- Today (2025)
- 513,025 people
- By 2030
- 575,781 · +12.2%
- By 2040
- 700,174 · +36.5%
- By 2050
- 826,541 · +61.1%
- By 2075
- 1,123,374 · +119.0%
- By 2100
- 1,355,609 · +164.2%
Race, ethnicity, and origin ACS 2023
- Neighborhood character
- Diverse neighborhood (Simpson 0.63)
- Race & ethnicity
- White 45% Black 40% Hispanic / Latino 10% Two or more races 8%
- Hispanic origin (detail)
- Mexican 1% Cuban 3%
- Common ancestry
- Lithuanian 6% Slovak 3% Romanian 3%
- Foreign-born
- 5% · Canada
- Languages at home
- 90% English-only · Spanish 6% French/Haitian/Cajun 2%
Political lean MEDSL · Orleans
- 2024 margin
- Solid D (+67.0) · D 82.2% · R 15.2% · Other 2.7%
- 2008→2024 swing
- +6.7pp toward D · 2008: 60.3pp · 2024: 67.0pp
- All cycles
- 2024: D+67.0 2020: D+68.2 2016: D+66.2 2012: D+62.5 2008: D+60.3
Not yet ingested
- Civics
- —
Market trends
- HPI YoY
- ▼ -144.83%
- Current HPI
- 275.5453
- Rent YoY
- ▲ 0.18%
- Metro
- New Orleans-Metairie, LA
- State GDP YoY
- ▲ 3.29%
- F500 in state
- 10
Industry mix (Fortune 500 HQ in LA)
| Industry | F500 HQs | Revenue |
|---|---|---|
| Telecommunications | 2 | $23B |
|
||
| Utilities | 1 | $12B |
|
||
| Wholesale / Distribution | 1 | $5B |
|
||
| Advertising | 1 | $2B |
|
||
Price history
+867.2% since first listed4 events — show timeline
- 2026-06-04 Listed $309,500 ForSaleByOwner.com
- 1998-05-01 Sold (MLS) $29,500 GSREIN
- 1998-03-02 Listed $32,000 AcadianaMLS
- 1998-03-02 Listed $32,000 GSREIN
Property tax history
+11.8%/yrLatest (2026): $3,410 · +1.1% YoY. Source: county tax records.
Cash-flow waterfall
monthlySold comps — $/sqft
last 12 mo · ≤1 miLoading sold comps…