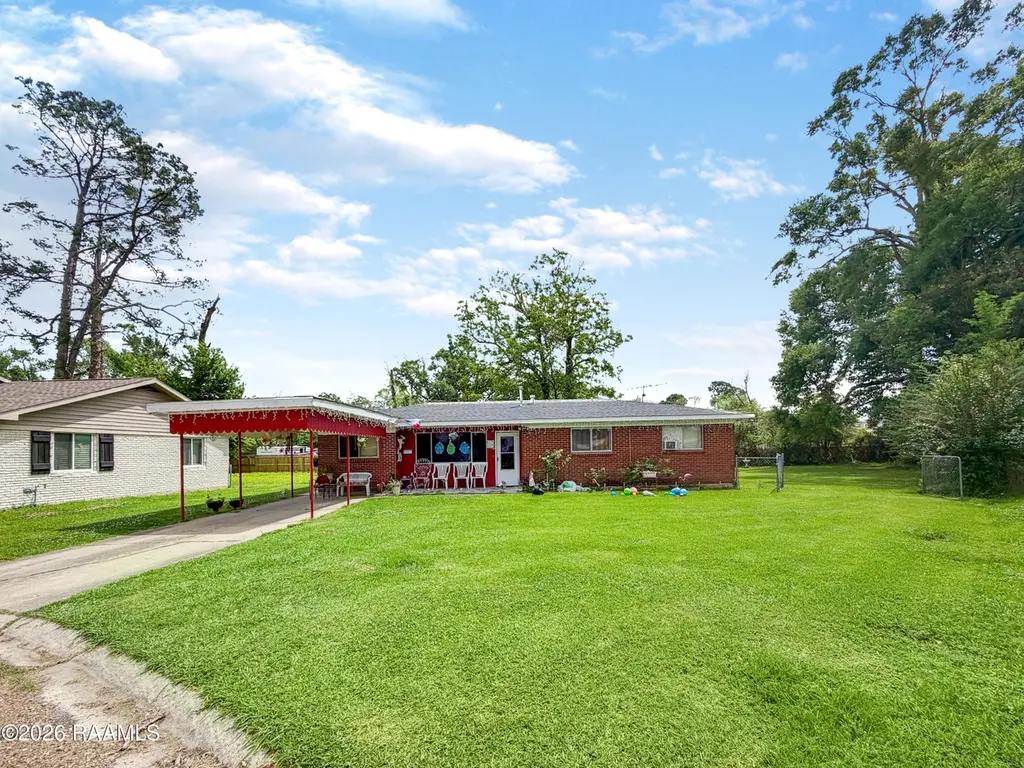
200 Oleander St · Opelousas, LA
Flood risk 1/10 · Minimal
- FEMA flood zone
- X (unshaded)
- Chance of flooding over 30 yrs
- 0.0%
- Est. flood insurance / yr
- $507 – $1,088
Fire risk 2/10 · Minimal
- Est. fire insurance / yr
- $1,269 – $2,357
Heat risk 8/10 · Major
- Hot days now (above 110°F)
- 7 days/yr
- Hot days in 30 yrs
- 20 days/yr
Wind risk 9/10 · Severe
- Chance of severe wind over 30 yrs
- 99.0%
Air-quality risk 1/10 · Minimal
- Unhealthy air days now
- 0 days/yr
- Unhealthy air days in 30 yrs
- 0 days/yr
Risk factors via First Street. Map © Google.
Why this score? — see what drove the B- grade
The composite is a weighted blend of 9 inputs, each scored 0–100. Each bar is that input's sub-score; the figure is the points it added to the 100-point composite (weight × sub-score).
- Cash flow +30.0/30.0
- DSCR +10.0/10.0
- ARV discount +8.2/15.0
- 1% rule +7.5/10.0
- Livability +3.2/5.0
- Rent growth +2.5/5.0
- Condition / age +2.5/5.0
- Schools +2.2/10.0
- Appreciation +0.0/10.0
$75,000
🖨 Deal sheet (PDF) 📄 Offer letter ✓ Due diligence
Listing remarks
Turnkey investment property with long-term tenants and optional built-in management services if needed, but not required. This 3 bed 2 bath home is bringing in $750 per month and $9,000 per year in rental income. Home has been very well maintained and would make a great addition to your rental portfolio and future residual income plan. Full financials including lease copies, insurance cost estimates, property taxes and expenses are available by request. This home is a part of a large portfolio of investment rental properties that are currently listed for sale with more homes will be coming available soon. Properties can be purchased individually or as a package. Please reach out for further
Key facts
- 6,969 sq ft lot
- Parking
- Listed 45 days
Property features AI
Exterior
- Parking: Carport (1 covered space, total parking for 1 vehicle)
- Utilities: Public sewer
- Home design: Single-family residence
- Construction: Brick veneer construction
- Exterior features: Brick veneer exterior; Public sewer
Interior
- Bathrooms: Two full bathrooms
- Heating & cooling: Has heating; Has cooling
- Interior features: Cooling and heating present (system type not specified)
Neighborhood map
What this means for you Summary
Snapshot
- This is a 3-bed/2.0-bath other listed at $75k.
Deal economics
- At list price, monthly cash flow is $293 ($4k/yr) — positive.
- The deal already cash-flows at list — no discount required.
- Meets the 1% rule at list price ($939 rent vs $75k).
- Recommended offer: $73k (3.0% below list) — sets the bar for market timing.
- Cap rate 11.0% vs local median 4.0% in Opelousas — top-decile yield for the area; either an underpriced asset or a hidden risk that comps aren't pricing in. Stress-test before assuming the spread holds.
Location & tenants
- Location reads 63/100 on livability (#187 in LA) — a middle-class / working-renter tenant base. Strengths: cost of living A+, housing A+, health & safety A+; Watch: crime F, amenities F, commute F.
- St. Landry Parish (town): math 20% / reading 33% proficiency, ranked #54 of 98 in LA (top 55%) — low school quality limits family demand, transient renter base, plan for 1-2y turnover; 73% free/reduced lunch — lower-income household profile, screen leases tightly.
- Zoned schools: Grolee Elementary School (math 5% / reading 12%, grade F, #616 of 646 statewide, top 96%, 474 students, 89% FRL); Opelousas Middle School (math 5% / reading 16%, grade F, #197 of 218 statewide, top 91%, 246 students, 92% FRL); Northwest High School (math 12% / reading 22%, grade F, #203 of 265 statewide, top 80%, 582 students, 68% FRL).
- Zoned-school proficiency averages 12% at this address vs 26% district-wide (-14 pts) — the specific schools serving this property underperform the St. Landry Parish average; the district grade overstates school quality for this exact location.
- Market conditions: 312 active listings in the ZIP; 2 comparable units currently listed for rent nearby; 142 units permitted in St. Landry Parish in 2024 (0 in 5+ unit buildings).
Forward outlook
- Local home prices are declining (-3.0%/yr); year-one equity from $519 of loan paydown is wiped out by about $2k of value loss. Plan a longer hold.
- St. Landry County population projected to shrink 9% by 2050 — rents likely to lag national; underwrite the cash flow, not the appreciation.
- At projected returns (-3.0% appreciation + 3.0% rent growth), your $21k cash investment doubles in ~8 years — after that, you're playing with house money.
Negotiation context
- It's been on market 45 days — a 3% lower offer ($73k) is reasonable based on typical stale-listing flexibility.
Risks & watch-outs
- Climate carrying-cost: severe wind risk, 99% chance of damaging wind over 30y; extreme-heat days projected 7→20/yr by 2055 (HVAC capex compounding) — expect insurance premiums to compound above CPI over the hold.
Questions for the listing agent
- It's been on market 45 days. Have you received any prior offers? Is the seller open to a 3% concession, seller financing, or rate buy-down credit?
- Is there a deadline driving the sale (1031 exchange, divorce, estate, relocation)? That informs how much negotiation room exists.
- Crime grade is F in this area — have there been break-ins, vandalism, or insurance claims at this property in the last 3 years? What carrier currently insures it and at what premium?
- What's the average days-on-market for RENTAL listings here right now (not sales)? A rising rental-DOM trend means longer vacancies and softer asking-rent achievability than the comps imply.
- What's the recent tenant-quality profile in this submarket — average credit score on applications, eviction rate, late-payment / NSF rate, and stable-employment percentage? A property-management company in the area should have these aggregated.
- How much new for-sale + rental construction is in the pipeline within 1–3 miles? Heavy new supply typically softens prices + rents 12–24 months out; constrained supply supports both.
Investment metrics
- 1% rule
- 1.25% ✓
- Cap rate
- 10.99%
- Cash-on-cash
- 16.76%
- DSCR
- 1.75
- GRM
- 6.7
CMA / ARV
- ARV (median comp)
- $76,169
- List price
- $75,000
- Delta
- -1.53%
- Verdict
- FAIR
- Comps
- 20 within 1.0 mi
Projected returns pro-forma
-3.0% appreciation · 3.0% rent growth · sell at horizon
- IRR
- 7.9%
- Equity multiple
- 1.31×
- Total profit
- $6,502
- Equity at exit
- $11,183
- IRR
- 17.1%
- Equity multiple
- 2.41×
- Total profit
- $29,603
- Equity at exit
- $6,485
Cash invested: $21,000 (down + closing). Projections, not guarantees.
Landlord ↔ Tenant lean methodology
- Overall (STATE)
- 90 Strongly Landlord-Friendly
- State Louisiana
- 90 Strongly Landlord-Friendly · R+12
- County
- — inherits STATE
- City
- — inherits STATE
ZIP-level market 70570
- Home prices YoY
- -34.7%
- Active inventory
- 312
- Price-to-rent
- 6.7×
Monthly cashflow live
- Estimated rent
- $939 medium interval (Pro) →
- Mortgage (P&I)
- −$393
- Tax from tax record
- −$24 /mo · $288/yr
- Insurance
- −$31
- HOA
- −$0
- Vacancy / Maint / Mgmt
- −$197
- Net cashflow
- $293
Break-even live
Sensitivity live
| Price | -10% $336 | -5% $315 | +0% $293 | +5% $272 | +10% $251 |
|---|---|---|---|---|---|
| Rent | -10% $219 | -5% $256 | +0% $293 | +5% $330 | +10% $368 |
| Rate | -1.0pp $331 | -0.5pp $312 | base $293 | +0.5pp $274 | +1.0pp $254 |
UW: 25.0% down · 7.5% · 30yr · 1.5% tax · 5.0% vac · 8.0% maint · 8.0% mgmt
Financing live
Cash to close
- Down payment
- $18,750
- Closing costs
- $2,250
- Reserves months
- —
- Total cash needed
- —
Loan-product check · same deal, 3 products live
Conventional
25% down · 7.5% · 30yr
- Down + closing
- —
- Monthly P&I
- —
- Monthly cashflow
- —
- DSCR
- —
- Eligible?
- —
Personal DTI + credit; lowest rate.
DSCR
20% down · 8.5% · 30yr
- Down + closing
- —
- Monthly P&I
- —
- Monthly cashflow
- —
- DSCR
- —
- Eligible?
- —
No personal income docs; deal must DSCR.
Hard money
10% down · 12.0% · 12mo
- Down + closing
- —
- Monthly P&I
- —
- Monthly cashflow
- —
- DSCR
- —
- Eligible?
- —
Short-term bridge; refi at stabilization.
Rent comps 2 comps
| Address | Beds | Baths | Sqft | Rent | $/sqft | DOM | Units | Dist |
|---|---|---|---|---|---|---|---|---|
| 2238 Ledoux Cir Opelousas, LA | 3.0 | 1.0 | 1000 | $950 | $0.95 | 44d | 1 | 0.28mi |
| 1032 N Railroad Ave Opelousas, LA | 3.0 | 1.0 | 1013 | $900 | $0.89 | 44d | 1 | 1.03mi |
Listing history 19 events
-
2026-06-21days on market $75,000 Active 45 DOM
-
2026-06-18days on market $75,000 Active 43 DOM
-
2026-06-17days on market $75,000 Active 42 DOM
-
2026-06-16days on market $75,000 Active 41 DOM
-
2026-06-15days on market $75,000 Active 40 DOM
-
2026-06-13days on market $75,000 Active 38 DOM
-
2026-06-12days on market $75,000 Active 37 DOM
-
2026-06-09days on market $75,000 Active 34 DOM
-
2026-06-08days on market $75,000 Active 33 DOM
-
2026-06-07days on market $75,000 Active 32 DOM
-
2026-06-07days on market $75,000 Active 31 DOM
-
2026-06-04days on market $75,000 Active 28 DOM
-
2026-06-02days on market $75,000 Active 27 DOM
-
2026-06-01days on market $75,000 Active 26 DOM
-
2026-05-31days on market $75,000 Active 25 DOM
-
2026-05-31days on market $75,000 Active 24 DOM
-
2026-05-06$75,000 Active 764-char remark
-
2021-07-21soldstatus $187,500
-
2017-08-02soldstatus $32,000
ⓘ Source: listings_history table (triggers on properties + properties_extension) + one-shot
backfill from property_details.listing_events for pre-trigger history.
Tax reassessment forecast LA · Resets to sale price
- Current annual tax
- $288 · $24/mo
- Projected year-2 tax
- $412 · $34/mo
- Expected delta
- +$124/yr (+$10/mo · 43.1%)
ⓘ Screening estimate from a state-policy table — verify with the county assessor before closing.
Climate risk First Street
- Flood 1/10 Low FEMA zone X (unshaded) · 0% chance over 30 yrs
- Wildfire 2/10 Low
- Heat 8/10 Severe 7 d/yr ≥110°F today · 20 d/yr by 30 yrs out
- Wind 9/10 Extreme 99% chance of damaging wind over 30 yrs
- Air quality 1/10 Low 0 unhealthy d/yr today · 0 by 30 yrs out
Nearby sold comps map
Loading sold comps map…
Walkable amenities ~0.75 mi
Loading nearby amenities…
Taxation est. · year 1
- Rental income
- $11,270
- − Mortgage interest
- −$4,201
- − Property taxes
- −$288
- − Insurance
- −$375
- − Repairs & maintenance
- −$902
- − Management
- −$902
- − Depreciation
- −$2,182
- Taxable income
- $2,420
- Est. tax owed @ 24.0%
- −$581
- After-tax cash flow
- $2,939/yr
For passive investors: Depreciation is non-cash, so a rental often shows a tax loss while cash-flowing — sheltering income. Rental losses are passive: they offset passive income freely, and up to $25,000/yr can offset ordinary (W-2) income if you actively participate and your MAGI is under $100k (phasing out to $0 by $150k); unused losses carry forward. On sale, claimed depreciation is recaptured at up to 25%, and gains may owe capital-gains tax (a 1031 exchange can defer both). Figures are a year-1 estimate at your 24.0% rate — not tax advice; consult a CPA.
Schools (NCES district)
- District
- St. Landry Parish
- NCES district ID
- 2201560
- Math proficiency
- 20% ▼ -43.00%
- Reading proficiency
- 33% ▼ -35.00%
- Median HH income
- $32,635
- Composite
- 21.59/100
- National rank
- #8303
- State rank
- #54 of 98 in LA
Livability — Opelousas
- Score
- 63/100
- State rank
- #187
- US rank
- #14928
Category grades
Schools grade is shown separately in the Schools card above.
Census & demographics
- Census place
- Opelousas, LA
- Population (ZIP)
- 37,188
Population outlook (St. Landry County) Hauer SSP2
- Today (2025)
- 83,114 people
- By 2030
- 82,110 · -1.2%
- By 2040
- 79,445 · -4.4%
- By 2050
- 75,855 · -8.7%
- By 2075
- 65,684 · -21.0%
- By 2100
- 51,739 · -37.7%
Race, ethnicity, and origin ACS 2023
- Neighborhood character
- Diverse neighborhood (Simpson 0.56)
- Race & ethnicity
- Black 55% White 37% Two or more races 4% Hispanic / Latino 4%
- Common ancestry
- Lithuanian 8%
- Foreign-born
- 1% · Canada
- Languages at home
- 92% English-only · French/Haitian/Cajun 5% Spanish 3%
Political lean MEDSL · St. Landry
- 2024 margin
- R (+18.8) · D 40.0% · R 58.9% · Other 1.1%
- 2008→2024 swing
- -15.6pp toward R · 2008: -3.2pp · 2024: -18.8pp
- All cycles
- 2024: R+18.8 2020: R+14.1 2016: R+11.9 2012: R+4.3 2008: R+3.2
Not yet ingested
- Civics
- —
Market trends
- HPI YoY
- ▼ -52.38%
- Current HPI
- 98.4256
- Rent YoY
- —
- Metro
- —
- State GDP YoY
- ▲ 3.29%
- F500 in state
- 10
Industry mix (Fortune 500 HQ in LA)
| Industry | F500 HQs | Revenue |
|---|---|---|
| Telecommunications | 2 | $23B |
|
||
| Utilities | 1 | $12B |
|
||
| Wholesale / Distribution | 1 | $5B |
|
||
| Advertising | 1 | $2B |
|
||
Price history
+134.4% since first listed3 events — show timeline
- 2026-05-06 Listed $75,000 AcadianaMLS
- 2021-07-21 Sold (Public Records) $187,500 Public Records
- 2017-08-02 Sold (Public Records) $32,000 Public Records
Property tax history
+0.3%/yrLatest (2025): $288 · +0.0% YoY. Source: county tax records.
Cash-flow waterfall
monthlySold comps — $/sqft
last 12 mo · ≤1 miLoading sold comps…