 5-Plex
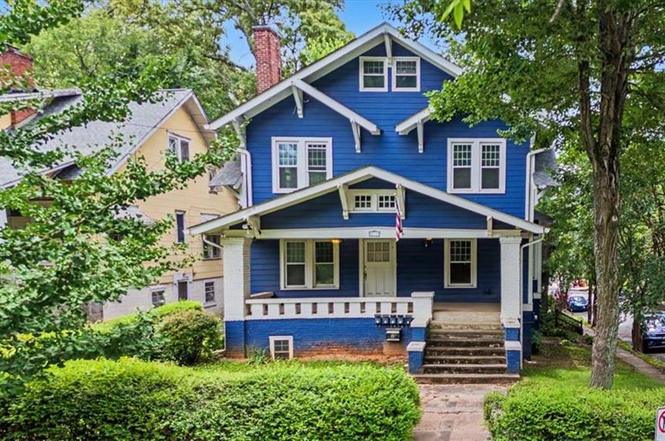
811 Saint Charles Ave NE · Atlanta, GA
Flood risk 1/10 · Minimal
- FEMA flood zone
- X (unshaded)
- Chance of flooding over 30 yrs
- 0.0%
- Est. flood insurance / yr
- $473 – $860
Fire risk 1/10 · Minimal
- Est. fire insurance / yr
- $963 – $1,789
Heat risk 5/10 · Moderate
- Hot days now (above 104°F)
- 7 days/yr
- Hot days in 30 yrs
- 18 days/yr
Wind risk 5/10 · Moderate
- Chance of severe wind over 30 yrs
- 25.0%
Air-quality risk 4/10 · Minor
- Unhealthy air days now
- 5 days/yr
- Unhealthy air days in 30 yrs
- 7 days/yr
Risk factors via First Street. Map © Google.
Why this score? — see what drove the C- grade
The composite is a weighted blend of 9 inputs, each scored 0–100. Each bar is that input's sub-score; the figure is the points it added to the 100-point composite (weight × sub-score).
- Cash flow +18.4/30.0
- ARV discount +7.5/15.0
- DSCR +5.8/10.0
- 1% rule +4.8/10.0
- Rent growth +4.4/5.0
- Livability +4.2/5.0
- Schools +2.7/10.0
- Condition / age +2.5/5.0
- Appreciation +0.0/10.0
$1,000,000
🖨 Deal sheet (PDF) 📄 Offer letter ✓ Due diligence
Multi-family units
County records classify this as Multi-Family (2-4 Unit). Listing-text estimate: 5 units. estimate disagrees with records
Listing remarks
UNBEATABLE INTOWN ATLANTA MULTIFAMILY INVESTMENT IN VIRGINIA-HIGHLAND! Rare opportunity to acquire an income-producing 5-plex with exceptional structural bones in one of Atlanta's most coveted historic neighborhoods. Situated on a beautiful corner lot featuring tree-lined streets, sidewalks, and streetlights, this property offers the ultimate Intown location. Residents are just around the corner from the iconic Ponce City Market and the vibrant Atlanta BeltLine Eastside Trail, putting world-class dining, shopping, and recreation right at their doorstep. EXCELLENT STRUCTURAL BONES & LOW-MAINTENANCE EXTERIOR Investors will appreciate the low-maintenance, high-durability exterior fea
Key facts
- Value add potential
- Beautiful corner lot
- Historic charm
Tags
Property features AI
Finance
- Financial info: Multifamily building with 5 total units
Exterior
- Parking: Four total parking spaces; Driveway with level access; Open parking available; See remarks for additional parking details
- Utilities: Public water; Public sewer; Cable available; Electricity available; Natural gas available; Phone available; Sewer available; Water available
- Home design: Three or more levels; Resale property
- Construction: Brick exterior; Fiber cement siding; Wood siding; Composition roof
- Exterior features: Backyard with fencing; Chain link fence; Wood fence; Near Beltline; Near public transport; Near schools; Near shopping; Sidewalks; Street lights
Interior
- Kitchen: Dishwasher; Garbage disposal; Range/oven; Refrigerator
- Bedrooms: Unit 1: 3 bedrooms; Unit 2: 2 bedrooms; Unit 3: 3 bedrooms; Unit 4: 2 bedrooms; Unit 5: 1 bedroom
- Flooring: Carpet; Ceramic tile; Hardwood floors; Laminate
- Bathrooms: Unit 1: 1 bathroom; Unit 2: 1 bathroom; Unit 3: 1 bathroom; Unit 4: 1 bathroom; Unit 5: 1 bathroom
- Heating & cooling: Central air in units; Ceiling fans; Electric cooling; Central heating; Hot water heating; Natural gas heating
- Interior features: Unfurnished; Insulated windows; Window treatments; Carpeting; Ceramic tile; Hardwood; Laminate
- Laundry & utility: Electric included for each unit; Gas included for each unit; Water included for each unit; Garbage included for each unit; Maintenance included for each unit
Neighborhood map
What this means for you Summary
Snapshot
- This is a 5 × 2-bed/1.0-bath units multifamily listed at $1.00M.
Deal economics
- At list price, monthly cash flow is $935 ($11k/yr) — positive. Per door: $187/mo.
- The deal already cash-flows at list — no discount required.
- To meet the 1% rule (rent ≥ 1% of price), the offer needs to be $983k (1.7% below list).
- Recommended offer: $983k (1.7% below list) — sets the bar for 1% rule.
- Cap rate 7.4% vs local median 3.1% in Atlanta — top-decile yield for the area; either an underpriced asset or a hidden risk that comps aren't pricing in. Stress-test before assuming the spread holds.
Location & tenants
- Location reads 83/100 on livability (#6 in GA, #919 nationally) — a professional / high-income tenant draw. Strengths: amenities A+, commute A+, housing A+; Watch: cost of living C-.
- Atlanta Public Schools (urban): math 28% / reading 35% proficiency, ranked #80 of 174 in GA (top 46%) — families likely to look elsewhere, expect single-tenant / working-renter base with shorter leases; 71% free/reduced lunch — lower-income household profile, screen leases tightly.
- Zoned schools: Springdale Park Elementary School (math 72% / reading 75%, grade A, #37 of 1,228 statewide, top 3%, 742 students, 11% FRL); David T Howard Middle School (math 58% / reading 63%, grade B+, #39 of 470 statewide, top 8%, 1,119 students, 19% FRL); Midtown High School (math 22% / reading 34%, grade F, #151 of 424 statewide, top 36%, 1,602 students, 19% FRL) — zoned schools average 16% FRL vs 71% district-wide (55 pts lower); this property's tenant base skews higher-income than the district average.
- Zoned-school proficiency averages 54% at this address vs 32% district-wide (+23 pts) — the actual schools serving this property are materially stronger than the Atlanta Public Schools average implies; a family-tenant draw the district grade alone would hide.
- Market conditions: Rents rising fast (+7.4%/yr); 189 active listings in the ZIP; 35 comparable units currently listed for rent nearby; rentals at typical pace (median 24d on market — plan ~3-4 weeks tenant-placement turnaround); high-income renter base; 11,565 units permitted in Fulton County in 2024 (8,159 in 5+ unit buildings).
Forward outlook
- Local home prices are declining (-3.0%/yr); year-one equity from $7k of loan paydown is wiped out by about $30k of value loss. Plan a longer hold.
- Fulton County population projected at +38% by 2050 — long-run rental-demand tailwind backs the buy-and-hold thesis.
- At projected returns (-3.0% appreciation + 7.4% rent growth), your $280k cash investment doubles in ~10 years — after that, you're playing with house money.
Negotiation context
- Only 1 days on market — expect competitive offers; lowballing is unlikely to land.
- Current owner paid $460k; list at $1.00M implies a 117% gain — meaningful room to come down on a strong offer.
Risks & watch-outs
- Watch-outs: built in 1920 — expect roof / HVAC / electrical / plumbing capex.
- Climate carrying-cost: moderate wind risk, 25% chance of damaging wind over 30y; extreme-heat days projected 7→18/yr by 2055 (HVAC capex compounding) — expect insurance premiums to compound above CPI over the hold.
Questions for the listing agent
- Can we see the unit-by-unit rent roll, current vacancy, and any below-market leases? What's the average tenancy length?
- What capital expenditures (roof, boiler, parking lot, exteriors) have been made in the last 5 years, and what's planned in the next 2?
- Built in 1920 — when were the roof, HVAC, electrical panel, plumbing, and water heater last replaced?
- Is there a deadline driving the sale (1031 exchange, divorce, estate, relocation)? That informs how much negotiation room exists.
- What's the average days-on-market for RENTAL listings here right now (not sales)? A rising rental-DOM trend means longer vacancies and softer asking-rent achievability than the comps imply.
- What's the recent tenant-quality profile in this submarket — average credit score on applications, eviction rate, late-payment / NSF rate, and stable-employment percentage? A property-management company in the area should have these aggregated.
- How much new apartment / multifamily construction is in the pipeline within 1–3 miles? Heavy new supply (>2% of stock underway) typically softens rents 12–24 months out; light construction supports rent growth.
Investment metrics
- 1% rule
- 0.98% ✗
- Cap rate
- 7.41%
- Cash-on-cash
- 4.01%
- DSCR
- 1.18
- GRM
- 8.5
CMA / ARV
No comps found within radius.
Projected returns pro-forma
-3.0% appreciation · 7.4% rent growth · sell at horizon
- IRR
- -5.2%
- Equity multiple
- 0.80×
- Total profit
- $-56,964
- Equity at exit
- $149,103
- IRR
- 9.0%
- Equity multiple
- 1.83×
- Total profit
- $231,735
- Equity at exit
- $86,462
Cash invested: $280,000 (down + closing). Projections, not guarantees.
Landlord ↔ Tenant lean methodology
- Overall (STATE)
- 90 Strongly Landlord-Friendly
- State Georgia
- 90 Strongly Landlord-Friendly · R+3
- County
- — inherits STATE
- City
- — inherits STATE
ZIP-level market 30306
- Rents YoY
- 7.4%
- Active inventory
- 189
- Price-to-rent
- 42.4×
Monthly cashflow live
- Estimated rent
- $9,832 high interval (Pro) →
- Mortgage (P&I)
- −$5,244
- Tax from tax record
- −$1,172 /mo · $14,063/yr
- Insurance
- −$417
- HOA
- −$0
- Vacancy / Maint / Mgmt
- −$2,065
- Net cashflow
- $935
Break-even live
Sensitivity live
| Price | -10% $1,501 | -5% $1,218 | +0% $935 | +5% $652 | +10% $368 |
|---|---|---|---|---|---|
| Rent | -10% $158 | -5% $546 | +0% $935 | +5% $1,323 | +10% $1,711 |
| Rate | -1.0pp $1,438 | -0.5pp $1,189 | base $935 | +0.5pp $675 | +1.0pp $412 |
5-unit breakdown (identical units grouped — click to expand)
| Units | Beds | Baths | Est. rent |
|---|---|---|---|
| 5× units | 2 | 1 | $9,830 |
| #1 | 2 | 1 | $1,966 |
| #2 | 2 | 1 | $1,966 |
| #3 | 2 | 1 | $1,966 |
| #4 | 2 | 1 | $1,966 |
| #5 | 2 | 1 | $1,966 |
| Total (5 units) | $9,832 | ||
UW: 25.0% down · 7.5% · 30yr · 1.5% tax · 5.0% vac · 8.0% maint · 8.0% mgmt
Financing live
Cash to close
- Down payment
- $250,000
- Closing costs
- $30,000
- Reserves months
- —
- Total cash needed
- —
Loan-product check · same deal, 3 products live
Conventional
25% down · 7.5% · 30yr
- Down + closing
- —
- Monthly P&I
- —
- Monthly cashflow
- —
- DSCR
- —
- Eligible?
- —
Personal DTI + credit; lowest rate.
DSCR
20% down · 8.5% · 30yr
- Down + closing
- —
- Monthly P&I
- —
- Monthly cashflow
- —
- DSCR
- —
- Eligible?
- —
No personal income docs; deal must DSCR.
Hard money
10% down · 12.0% · 12mo
- Down + closing
- —
- Monthly P&I
- —
- Monthly cashflow
- —
- DSCR
- —
- Eligible?
- —
Short-term bridge; refi at stabilization.
Rent comps 35 comps
| Address | Beds | Baths | Sqft | Rent | $/sqft | DOM | Units | Dist |
|---|---|---|---|---|---|---|---|---|
| 781 Greenwood Ave NE Atlanta, GA | 4.0 | 3.5 | 2760 | $9,950 | $3.61 | 26d | 1 | 0.10mi |
| 829 Barnett St NE Atlanta, GA | 4.0 | 3.5 | 2400 | $6,500 | $2.71 | 26d | 1 | 0.21mi |
| 692 Drewry St NE Atlanta, GA | 4.0 | 3.5 | 2217 | $8,500 | $3.83 | 26d | 1 | 0.29mi |
| 1021 North Ave NE Atlanta, GA | 4.0 | 3.0 | 2700 | $6,500 | $2.41 | 17d | 1 | 0.49mi |
| 645 Kennesaw Ave NE Unit A Atlanta, GA | 5.0 | 3.0 | 3100 | $6,400 | $2.06 | 7d | 1 | 0.55mi |
| 570 Morgan St NE Unit A Atlanta, GA | 4.0 | 2.5 | 2513 | $8,500 | $3.38 | 20d | 1 | 0.58mi |
| 519 N Highland Ave NE Atlanta, GA | 3.0 | 3.5 | 1910 | $6,500 | $3.40 | 26d | 1 | 0.68mi |
| 715 Ralph McGill Blvd NE Atlanta, GA | 3.0 | 3.0 | 2150 | $9,975 | $4.64 | 6d | 1 | 0.68mi |
| 970 Charles Allen Dr NE Unit D Atlanta, GA | 3.0 | 2.5 | 1700 | $5,000 | $2.94 | 22d | 1 | 0.81mi |
| 1046 Rosewood Dr NE Atlanta, GA | 3.0 | 2.0 | 2203 | $5,495 | $2.49 | 26d | 1 | 0.87mi |
| 456 Parkway Dr NE #9 Atlanta, GA | 3.0 | 2.5 | 2085 | $3,350 | $1.61 | 9d | 1 | 0.93mi |
| 1104 Rosedale Rd NE Atlanta, GA | 4.0 | 4.0 | 2750 | $5,500 | $2.00 | 45d | 1 | 0.99mi |
| 1246 Monroe Dr NE Unit A Atlanta, GA | 3.0 | 2.0 | 2387 | $4,650 | $1.95 | 26d | 1 | 1.02mi |
| 684 John Wesley Dobbs Ave NE Unit 700 D Atlanta, GA | 4.0 | 2.0 | 3241 | $7,000 | $2.16 | 3d | 1 | 1.07mi |
| 787 Myrtle St NE Unit 1 Atlanta, GA | 3.0 | 2.0 | 2300 | $6,500 | $2.83 | 26d | 1 | 1.07mi |
| 222 Lampkin St NE Atlanta, GA | 3.0 | 3.0 | 1940 | $6,500 | $3.35 | 26d | 1 | 1.07mi |
| 225 Sampson St NE Unit 220 A Atlanta, GA | 4.0 | 2.0 | 1900 | $3,800 | $2.00 | 26d | 1 | 1.09mi |
| 175 Sampson St NE Unit 175 Atlanta, GA | 4.0 | 3.5 | 3201 | $12,000 | $3.75 | 26d | 1 | 1.13mi |
| 658 Irwin St NE #15 Atlanta, GA | 3.0 | 2.5 | 1742 | $4,400 | $2.53 | 15d | 1 | 1.21mi |
| 1116 Piedmont Ave NE Atlanta, GA | 3.0 | 3.0 | 1633 | $4,350 | $2.66 | 26d | 1 | 1.25mi |
| 1258 DeKalb Ave NE Atlanta, GA | 3.0 | 2.5–3.5 | 2557 | $3,700 | $1.45 | 23d | 2 | 1.27mi |
| 1258 DeKalb Ave NE Atlanta, GA | 3.0 | 3.5 | 2557 | $3,600 | $1.41 | 0d | 1 | 1.27mi |
| 131 Ponce de Leon Ave NE Atlanta, GA | 4.0 | 1.0–4.0 | 1411 | $3,995 | $2.83 | 0d | 17 | 1.27mi |
| 180 10th St NE Atlanta, GA | 2.0–3.0 | 2.0–3.0 | 1621 | $8,100 | $5.00 | 0d | 20 | 1.27mi |
| 205 12th St NE Atlanta, GA | 1.0–3.0 | 1.0–2.0 | 1707 | $8,175 | $4.79 | 0d | 11 | 1.28mi |
| 207 13th St NE Atlanta, GA | 3.0 | 1.0–3.5 | 1645 | $7,031 | $4.27 | 9d | 14 | 1.31mi |
| 888 Juniper St NE Atlanta, GA | 1.0–3.0 | 1.0–3.0 | 1439 | $6,264 | $4.35 | 0d | 24 | 1.32mi |
| 661 Auburn Ave NE #16 Atlanta, GA | 3.0 | 3.5 | 2561 | $9,000 | $3.51 | 16d | 1 | 1.34mi |
| 661 Auburn Ave NE #16 Atlanta, GA | 3.0 | 3.5 | 2561 | $9,000 | $3.51 | 26d | 1 | 1.34mi |
| 693 Peachtree St NE Atlanta, GA | 1.0–3.0 | 1.5–2.5 | 1585 | $8,930 | $5.63 | 4d | 7 | 1.35mi |
| 69 Randolph St NE Unit A Atlanta, GA | 3.0 | 2.0 | 1590 | $4,500 | $2.83 | 26d | 1 | 1.35mi |
| 1081 Juniper St NE Atlanta, GA | 3.0 | 1.0–3.5 | 1375 | $18,230 | $13.26 | 0d | 104 | 1.37mi |
| 195 14th St NE Unit P603 Atlanta, GA | 3.0 | 2.0 | 1823 | $5,700 | $3.13 | 26d | 1 | 1.37mi |
| 663 Yorkshire Rd NE Atlanta, GA | 4.0 | 3.0 | 2500 | $10,000 | $4.00 | 26d | 1 | 1.40mi |
| 1146 Wade St NE Atlanta, GA | 4.0 | 2.0 | 1800 | $5,000 | $2.78 | 23d | 1 | 1.43mi |
Listing history 2 events
-
2026-06-22remarks 695-char remark
-
2026-06-22$1,000,000 Active 1 DOM
ⓘ Source: listings_history table (triggers on properties + properties_extension) + one-shot
backfill from property_details.listing_events for pre-trigger history.
Tax reassessment forecast GA · Resets to sale price
- Current annual tax
- $14,063 · $1,172/mo
- Projected year-2 tax
- $14,063 · $1,172/mo
- Expected delta
- $0/yr ($0/mo · 0.0%)
ⓘ Screening estimate from a state-policy table — verify with the county assessor before closing.
Climate risk First Street
- Flood 1/10 Low FEMA zone X (unshaded) · 0% chance over 30 yrs
- Wildfire 1/10 Low
- Heat 5/10 Major 7 d/yr ≥104°F today · 18 d/yr by 30 yrs out
- Wind 5/10 Major 25% chance of damaging wind over 30 yrs
- Air quality 4/10 Moderate 5 unhealthy d/yr today · 7 by 30 yrs out
Nearby sold comps map
Loading sold comps map…
Walkable amenities ~0.75 mi
Loading nearby amenities…
Taxation est. · year 1
- Rental income
- $117,984
- − Mortgage interest
- −$56,016
- − Property taxes
- −$14,063
- − Insurance
- −$5,000
- − Repairs & maintenance
- −$9,439
- − Management
- −$9,439
- − Depreciation
- −$29,091
- Taxable loss
- −$5,063
- Est. tax savings @ 24.0%
- +$1,215
- After-tax cash flow
- $12,430/yr
For passive investors: Depreciation is non-cash, so a rental often shows a tax loss while cash-flowing — sheltering income. Rental losses are passive: they offset passive income freely, and up to $25,000/yr can offset ordinary (W-2) income if you actively participate and your MAGI is under $100k (phasing out to $0 by $150k); unused losses carry forward. On sale, claimed depreciation is recaptured at up to 25%, and gains may owe capital-gains tax (a 1031 exchange can defer both). Figures are a year-1 estimate at your 24.0% rate — not tax advice; consult a CPA.
Schools (NCES district)
- District
- Atlanta Public Schools
- NCES district ID
- 1300120
- Math proficiency
- 28% ▼ -6.00%
- Reading proficiency
- 35% ▼ -2.00%
- Median HH income
- $48,306
- Composite
- 27.27/100
- National rank
- #7006
- State rank
- #80 of 174 in GA
Livability — Atlanta
- Score
- 83/100
- State rank
- #6
- US rank
- #919
Category grades
Schools grade is shown separately in the Schools card above.
Census & demographics
- Census place
- Atlanta, GA
- County
- Fulton County · 1,094,430 people
- City population
- 629,525
- Metro
- Atlanta-Sandy Springs-Alpharetta, GA
- Population (ZIP)
- 24,236
- Household income
- $123,077
- Rent vs Own
- Severe rent burden
- 1037.0
Population outlook (Fulton County) Hauer SSP2
- Today (2025)
- 1,203,707 people
- By 2030
- 1,299,706 · +8.0%
- By 2040
- 1,488,256 · +23.6%
- By 2050
- 1,664,580 · +38.3%
- By 2075
- 2,036,072 · +69.2%
- By 2100
- 2,222,402 · +84.6%
Race, ethnicity, and origin ACS 2023
- Neighborhood character
- Predominantly White (76%)
- Race & ethnicity
- White 76% Hispanic / Latino 8% Asian 7% Two or more races 7% Black 5% Native American 2%
- Hispanic origin (detail)
- Mexican 4%
- Common ancestry
- Slovak 4% Italian 4% Scotch-Irish 4%
- Foreign-born
- 10% · Canada, China
- Languages at home
- 87% English-only · Spanish 6% Chinese 2% Other Indo-European 2%
Political lean MEDSL · Fulton
- 2024 margin
- Solid D (+44.9) · D 71.9% · R 27.0% · Other 1.1%
- 2008→2024 swing
- +9.8pp toward D · 2008: 35.0pp · 2024: 44.9pp
- All cycles
- 2024: D+44.9 2020: D+46.4 2016: D+42.1 2012: D+29.6 2008: D+35.0
Not yet ingested
- Civics
- —
Market trends
- HPI YoY
- ▼ -754.85%
- Current HPI
- 291.9526
- Rent YoY
- ▲ 7.40%
- Metro
- Atlanta-Sandy Springs-Alpharetta, GA
- State GDP YoY
- ▲ 2.66%
- F500 in state
- 28
Industry mix (Fortune 500 HQ in GA)
| Industry | F500 HQs | Revenue |
|---|---|---|
| Paper / Packaging | 2 | $29B |
|
||
| Retail | 1 | $160B |
|
||
| Transportation / Logistics | 1 | $91B |
|
||
| Airlines | 1 | $62B |
|
||
| Consumer Goods | 1 | $47B |
|
||
| Utilities | 1 | $25B |
|
||
Price history
+624.6% since first listed4 events — show timeline
- 2026-06-20 Listed $1,000,000 FMLS
- 1999-07-23 Sold (Public Records) $460,000 Public Records
- 1999-07-23 Sold (Public Records) $460,000 Public Records
- 1995-03-28 Sold (Public Records) $138,000 Public Records
Property tax history
+2.3%/yrLatest (2025): $14,063 · +0.6% YoY. Source: county tax records.
Cash-flow waterfall
monthlySold comps — $/sqft
last 12 mo · ≤1 miLoading sold comps…