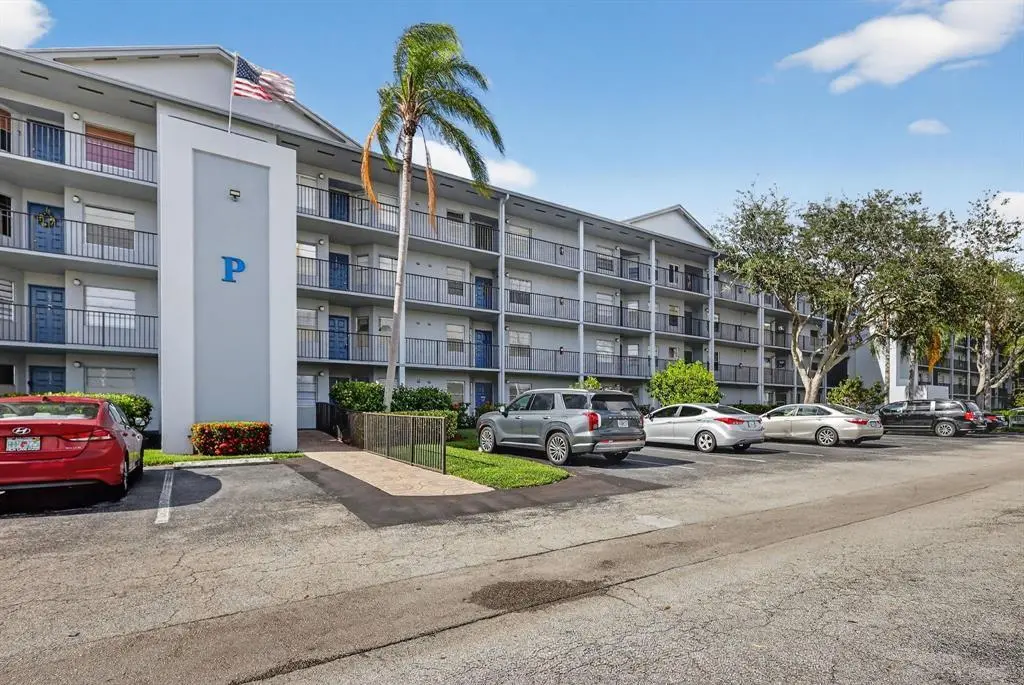
650 SW 124th Ter Unit 404 P · Pembroke Pines, FL
Flood risk 1/10 · Minimal
- FEMA flood zone
- X (shaded)
- Chance of flooding over 30 yrs
- 0.0%
- Est. flood insurance / yr
- $507 – $1,088
Fire risk 1/10 · Minimal
- Est. fire insurance / yr
- $947 – $1,759
Heat risk 10/10 · Severe
- Hot days now (above 106°F)
- 7 days/yr
- Hot days in 30 yrs
- 27 days/yr
Wind risk 10/10 · Severe
- Chance of severe wind over 30 yrs
- 99.0%
Air-quality risk 2/10 · Minimal
- Unhealthy air days now
- 2 days/yr
- Unhealthy air days in 30 yrs
- 2 days/yr
Risk factors via First Street. Map © Google.
Why this score? — see what drove the B- grade
The composite is a weighted blend of 9 inputs, each scored 0–100. Each bar is that input's sub-score; the figure is the points it added to the 100-point composite (weight × sub-score).
- Cash flow +25.2/30.0
- 1% rule +10.0/10.0
- DSCR +8.2/10.0
- ARV discount +7.5/15.0
- Livability +4.2/5.0
- Schools +4.1/10.0
- Appreciation +4.0/10.0
- Rent growth +2.5/5.0
- Condition / age +2.5/5.0
$149,000
🖨 Deal sheet 📄 Offer letter ✓ Due diligence
Listing remarks
Lowest-priced 2-bedroom, 1.5-bath unit with washer and dryer! Located on the 4th floor with no neighbors above, this bright and spacious condo features an eat-in kitchen and offers a fantastic opportunity to own in desirable Century Village Pembroke Pines. Enjoy resort-style living with endless amenities, including golf, pools, tennis, billiards, clubhouse, fitness center, transportation, classes, clubs, and more. Conveniently located near shopping, dining, hospitals, and major highways. Association requires a minimum 700 credit score for all buyers and occupants. No rentals permitted during the first two years of ownership. Per association, the owner must reside in the unit with any occupa
Key facts
- $438 HOA
- Parking
- Community pool
Property features AI
Finance
- Other: Pets not allowed
- HOA & community: Association: Buckingham East I; Monthly HOA fee of 435; HOA covers cable TV, insurance, internet, security, sewer, trash, water, common areas, elevator, reserve funds, roof repairs, recreation facilities, and pool service; Association amenities include clubhouse, elevators, fitness center, golf course, indoor pool, parking, pool, sauna, tennis courts, trash chute, cafe/restaurant, community room, courtesy bus, heated pool, internet included, maintained community, gated access, security, and recreation facilities; Senior community
Exterior
- Parking: Assigned parking; Guest parking; 1 open parking space (1 total parking)
- Security: Gated community; Security (association amenity)
- Utilities: Public water; Public sewer; Cable available; Water available; Sewer available
- Home design: Condominium; One level; Resale unit; East-facing; Building name: Buckingham P; Builder model: Oleander; Total stories in building: 4
- Construction: Concrete construction; Building area listed as 1,002 (builder source)
- Exterior features: No waterfront; Barrel roof
Interior
- Kitchen: Dishwasher; Disposal; Electric range; Microwave; Refrigerator; Electric water heater
- Bedrooms: No main-level bedrooms
- Flooring: Ceramic tile
- Bathrooms: 1 full bathroom; 1 half bathroom
- Heating & cooling: Central heating; Heat strip; Central air conditioning
- Interior features: Built-in features; Walk-in closet(s); Custom mirrors; Sliding windows
- Laundry & utility: In-unit laundry
Neighborhood map
What this means for you Summary
Snapshot
- This is a 2-bed/2.0-bath condo listed at $149k.
Deal economics
- At list price, monthly cash flow is $332 ($4k/yr) — positive.
- The deal already cash-flows at list — no discount required.
- Meets the 1% rule at list price ($2k rent vs $149k).
- Recommended offer: $145k (3.0% below list) — sets the bar for market timing.
- Cap rate 9.0% vs local median 4.0% in Pembroke Pines — top-decile yield for the area; either an underpriced asset or a hidden risk that comps aren't pricing in. Stress-test before assuming the spread holds.
Location & tenants
- Location reads 83/100 on livability (#54 in FL, #933 nationally) — a professional / high-income tenant draw. Strengths: housing A+, health & safety A+, crime A-; Watch: amenities D+, cost of living D+.
- Broward (suburban): math 42% / reading 53% proficiency, ranked #46 of 73 in FL (top 63%) — families likely to look elsewhere, expect single-tenant / working-renter base with shorter leases.
- Zoned schools: Lakeside Elementary School (math 53% / reading 63%, grade C+, #751 of 2,144 statewide, top 36%, 631 students, 57% FRL); Walter C. Young Middle School (math 49% / reading 62%, grade B-, #178 of 571 statewide, top 31%, 873 students, 56% FRL); Charles W Flanagan High School (math 29% / reading 50%, grade F, #304 of 667 statewide, top 47%, 2,475 students, 57% FRL).
- Market conditions: Rents soft (-0.2%/yr); 543 active listings in the ZIP; 40 comparable units currently listed for rent nearby; rentals at typical pace (median 24d on market — plan ~3-4 weeks tenant-placement turnaround); solid renter incomes; 2,111 units permitted in Broward County in 2024 (1,265 in 5+ unit buildings).
- This rent runs 36% of the median local income ($77k/yr) — at the standard rent-burdened threshold; future hikes will face affordability resistance.
Forward outlook
- Local home prices are declining (-2.0%/yr); year-one equity from $1k of loan paydown is wiped out by about $3k of value loss. Plan a longer hold.
- Broward County population projected at +34% by 2050 — long-run rental-demand tailwind backs the buy-and-hold thesis.
Negotiation context
- It's been on market 38 days — a 3% lower offer ($145k) is reasonable based on typical stale-listing flexibility.
- 2 sale attempts with the ask held roughly flat each time — persistent listings suggest the price (not the market) is what's stuck; bring a comps-based counter.
- Current owner paid $120k; 24% above their basis — modest negotiation headroom, anchor on the comps not their cost.
Risks & watch-outs
- Climate carrying-cost: severe wind risk, 99% chance of damaging wind over 30y; extreme-heat days projected 7→27/yr by 2055 (HVAC capex compounding) — expect insurance premiums to compound above CPI over the hold.
Questions for the listing agent
- It's been on market 38 days. Have you received any prior offers? Is the seller open to a 3% concession, seller financing, or rate buy-down credit?
- What does the HOA fee cover, when was the last increase, and are there any pending special assessments or reserve-fund shortfalls?
- Any open or pending special assessments — roof, HVAC, plumbing, elevator, façade? What's the per-unit balance and payoff schedule, and is the seller paying it off at close or rolling it to the buyer?
- Is there a deadline driving the sale (1031 exchange, divorce, estate, relocation)? That informs how much negotiation room exists.
- Schools are A-rated — typically a magnet for longer-tenancy family renters. What's the average tenant stay here, and is there a school-zone premium baked into asking?
- What's the average days-on-market for RENTAL listings here right now (not sales)? A rising rental-DOM trend means longer vacancies and softer asking-rent achievability than the comps imply.
- What's the recent tenant-quality profile in this submarket — average credit score on applications, eviction rate, late-payment / NSF rate, and stable-employment percentage? A property-management company in the area should have these aggregated.
- How much new apartment / multifamily construction is in the pipeline within 1–3 miles? Heavy new supply (>2% of stock underway) typically softens rents 12–24 months out; light construction supports rent growth.
Investment metrics
- 1% rule
- 1.55% ✓
- Cap rate
- 8.96%
- Cash-on-cash
- 9.54%
- DSCR
- 1.42
- GRM
- 5.4
CMA / ARV
No comps found within radius.
Projected returns pro-forma
-2.01% appreciation · 0.0% rent growth · sell at horizon
- IRR
- -2.0%
- Equity multiple
- 0.92×
- Total profit
- $-3,215
- Equity at exit
- $28,852
- IRR
- 1.8%
- Equity multiple
- 1.12×
- Total profit
- $5,147
- Equity at exit
- $24,575
Cash invested: $41,720 (down + closing). Projections, not guarantees.
Landlord ↔ Tenant lean methodology
- Overall (STATE)
- 87 Strongly Landlord-Friendly
- State Florida
- 87 Strongly Landlord-Friendly · R+3
- County
- — inherits STATE
- City
- — inherits STATE
ZIP-level market 33027
- Home prices YoY
- -0.6%
- Rents YoY
- -0.2%
- Active inventory
- 543
- Price-to-rent
- 5.4×
Monthly cashflow live
- Estimated rent
- $2,306 high interval (Pro) →
- Mortgage (P&I)
- −$781
- Tax from tax record
- −$208 /mo · $2,498/yr
- Insurance
- −$62
- HOA
- −$438
- Vacancy / Maint / Mgmt
- −$484
- Net cashflow
- $332
Break-even live
UW: 25.0% down · 7.5% · 30yr · 1.5% tax · 5.0% vac · 8.0% maint · 8.0% mgmt
Financing live
Cash to close
- Down payment
- $37,250
- Closing costs
- $4,470
- Reserves months
- —
- Total cash needed
- —
Loan-product check · same deal, 3 products live
Conventional
25% down · 7.5% · 30yr
- Down + closing
- —
- Monthly P&I
- —
- Monthly cashflow
- —
- DSCR
- —
- Eligible?
- —
Personal DTI + credit; lowest rate.
DSCR
20% down · 8.5% · 30yr
- Down + closing
- —
- Monthly P&I
- —
- Monthly cashflow
- —
- DSCR
- —
- Eligible?
- —
No personal income docs; deal must DSCR.
Hard money
10% down · 12.0% · 12mo
- Down + closing
- —
- Monthly P&I
- —
- Monthly cashflow
- —
- DSCR
- —
- Eligible?
- —
Short-term bridge; refi at stabilization.
Rent comps 40 comps
| Address | Beds | Baths | Sqft | Rent | $/sqft | DOM | Units | Dist |
|---|---|---|---|---|---|---|---|---|
| 12500 SW 5th Ct Unit 112M Pembroke Pines, FL | 1.0 | 1.5 | 1045 | $1,780 | $1.70 | 7d | 1 | 0.06mi |
| 12500 SW 5th Ct Unit 112M Pembroke Pines, FL | 1.0 | 1.5 | 1045 | $1,800 | $1.72 | 17d | 1 | 0.06mi |
| 12600 SW 5th Ct Pembroke Pines, FL | 2.0 | 2.0 | 1349 | $2,225 | $1.65 | 10d | 2 | 0.14mi |
| 12650 SW 6th St Unit 412K Pembroke Pines, FL | 1.0 | 1.5 | 1045 | $1,950 | $1.87 | 24d | 1 | 0.21mi |
| 12148 SW 4th St #12148 Pembroke Pines, FL | 3.0 | 2.5 | 1428 | $3,200 | $2.24 | 4d | 1 | 0.21mi |
| 12111 SW 5th Ct Pembroke Pines, FL | 1.0 | 1.5 | 1338 | $1,499 | $1.12 | 24d | 1 | 0.22mi |
| 1110 SW 125th Ave Pembroke Pines, FL | 1.0–2.0 | 1.5–2.0 | 1276 | $2,300 | $1.80 | 24d | 2 | 0.22mi |
| 12140 SW 4th St Unit 12140 Pembroke Pines, FL | 2.0 | 2.5 | 1169 | $2,900 | $2.48 | 2d | 1 | 0.23mi |
| 12800 SW 7th Ct Unit 102G Pembroke Pines, FL | 1.0 | 1.0 | 840 | $2,000 | $2.38 | 24d | 1 | 0.27mi |
| 12032 SW 5th Ct Unit 12032 Pembroke Pines, FL | 2.0 | 2.5 | 1169 | $2,750 | $2.35 | 24d | 1 | 0.28mi |
| 12750 SW 4th Ct Unit 114J Pembroke Pines, FL | 1.0 | 1.0 | 840 | $1,950 | $2.32 | 24d | 1 | 0.28mi |
| 12800 SW 7th Ct Pembroke Pines, FL | 1.0–2.0 | 1.0–2.0 | 1173 | $2,300 | $1.96 | 5d | 3 | 0.29mi |
| 1200 SW 125th Ave Unit 208L Pembroke Pines, FL | 1.0 | 1.5 | 1065 | $1,500 | $1.41 | 24d | 1 | 0.30mi |
| 308 SW 120th Ave Pembroke Pines, FL | 2.0 | 2.5 | 1120 | $2,500 | $2.23 | 24d | 1 | 0.31mi |
| 223 SW 120th Ave Pembroke Pines, FL | 2.0 | 2.5 | 1320 | $2,900 | $2.20 | 12d | 1 | 0.34mi |
| 223 SW 120th Ave Pembroke Pines, FL | 2.0 | 2.5 | 1320 | $2,900 | $2.20 | 5d | 1 | 0.34mi |
| 1300 SW 125th Ave Unit 311K Pembroke Pines, FL | 2.0 | 2.0 | 1351 | $2,500 | $1.85 | 24d | 1 | 0.38mi |
| 1351 SW 125th Ave Unit 108S Pembroke Pines, FL | 2.0 | 2.0 | 1100 | $2,300 | $2.09 | 21d | 1 | 0.39mi |
| 1300 SW 125th Ave Pembroke Pines, FL | 1.0–2.0 | 1.5–2.0 | 1198 | $2,500 | $2.09 | 4d | 2 | 0.40mi |
| 1151 SW 128th Ter Unit 210D Pembroke Pines, FL | 2.0 | 2.0 | 1192 | $2,200 | $1.85 | 24d | 1 | 0.41mi |
| 1400 SW 124th Ter Unit 302Q Pembroke Pines, FL | 2.0 | 2.0 | 1100 | $2,000 | $1.82 | 21d | 1 | 0.42mi |
| 12601 SW 13th St Unit 303G Pembroke Pines, FL | 2.0 | 2.0 | 1192 | $2,150 | $1.80 | 24d | 1 | 0.44mi |
| 12701 SW 13th St Unit 202F Pembroke Pines, FL | 2.0 | 2.0 | 1100 | $2,000 | $1.82 | 24d | 1 | 0.44mi |
| 12701 SW 13th St Unit 202F Pembroke Pines, FL | 2.0 | 2.0 | 1100 | $1,900 | $1.73 | 7d | 1 | 0.44mi |
| 12501 SW 14th St Unit 315R Pembroke Pines, FL | 2.0 | 2.0 | 1190 | $2,200 | $1.85 | 14d | 1 | 0.44mi |
| 12501 SW 14th St Pembroke Pines, FL | 2.0 | 2.0 | 1145 | $2,100 | $1.83 | 13d | 2 | 0.45mi |
| 12501 SW 14th St Pembroke Pines, FL | 2.0 | 2.0 | 1145 | $2,275 | $1.99 | 24d | 2 | 0.45mi |
| 1300 SW 130th Ave Pembroke Pines, FL | 1.0–2.0 | 1.0–2.0 | 885 | $1,975 | $2.23 | 24d | 2 | 0.49mi |
| 1401 SW 128th Ter Unit H309 Pembroke Pines, FL | 2.0 | 2.0 | 1100 | $2,200 | $2.00 | 11d | 1 | 0.50mi |
| 230 SW 117th Ter #202 Pembroke Pines, FL | 3.0 | 2.0 | 1330 | $3,200 | $2.41 | 24d | 1 | 0.51mi |
| 12650 SW 15th St Unit F304 Pembroke Pines, FL | 2.0 | 1.5 | 1032 | $1,900 | $1.84 | 24d | 1 | 0.51mi |
| 200 SW 117th Ter #10206 Pembroke Pines, FL | 2.0 | 2.0 | 1130 | $2,250 | $1.99 | 24d | 1 | 0.52mi |
| 1650 SW 124th Ter Unit D403 Pembroke Pines, FL | 2.0 | 1.5 | 1032 | $1,950 | $1.89 | 3d | 1 | 0.53mi |
| 1650 SW 124th Ter Unit D403 Pembroke Pines, FL | 2.0 | 1.5 | 1032 | $1,950 | $1.89 | 20d | 1 | 0.53mi |
| 11730 SW 2nd St #12208 Pembroke Pines, FL | 2.0 | 2.0 | 1130 | $2,380 | $2.11 | 24d | 1 | 0.53mi |
| 160 SW 117th Ter #6201 Pembroke Pines, FL | 2.0 | 2.0 | 1130 | $2,400 | $2.12 | 17d | 1 | 0.54mi |
| 11700 SW 2nd St #13107 Pembroke Pines, FL | 2.0 | 2.0 | 1130 | $2,400 | $2.12 | 20d | 1 | 0.56mi |
| 1651 SW 127th Ave Apt 305A Pembroke Pines, FL | 2.0 | 2.0 | 1207 | $2,650 | $2.20 | 24d | 1 | 0.57mi |
| 12651 SW 16th Ct Unit B304 Pembroke Pines, FL | 2.0 | 1.5 | 1032 | $2,200 | $2.13 | 24d | 1 | 0.58mi |
| 12651 SW 16th Ct Unit B304 Pembroke Pines, FL | 2.0 | 1.5 | 1032 | $2,200 | $2.13 | 10d | 1 | 0.58mi |
HOA detail condo
- Monthly dues
- $438 · $5,256/yr
- Likely covers
- poolgym
- Assessments
- None detected in remarks — confirm with the listing agent.
Listing history 22 events
-
2026-06-18days on market $149,000 Active 38 DOM
-
2026-06-17days on market $149,000 Active 37 DOM
-
2026-06-16days on market $149,000 Active 36 DOM
-
2026-06-15remarks 699-char remark
-
2026-06-15days on market $149,000 Active 35 DOM
-
2026-06-13days on market $149,000 Active 33 DOM
-
2026-06-09days on market $149,000 Active 29 DOM
-
2026-06-08days on market $149,000 Active 28 DOM
-
2026-06-07days on market $149,000 Active 27 DOM
-
2026-06-04days on market $149,000 Active 24 DOM
-
2026-06-03days on market $149,000 Active 23 DOM
-
2026-06-02days on market $149,000 Active 22 DOM
-
2026-06-01days on market $149,000 Active 21 DOM
-
2026-05-31days on market $149,000 Active 20 DOM
-
2026-05-07$149,000 Active
-
2026-04-29historical
-
2026-04-17price $154,000
-
2025-12-10$160,000 Active
-
2017-05-05soldstatus $120,000
-
2006-09-25soldstatus $157,000
-
2002-08-22soldstatus $70,000
-
1988-05-01soldstatus $49,800
ⓘ Source: listings_history table (triggers on properties + properties_extension) + one-shot
backfill from property_details.listing_events for pre-trigger history.
Tax reassessment forecast FL · Resets to sale price
- Current annual tax
- $2,498 · $208/mo
- Projected year-2 tax
- $2,498 · $208/mo
- Expected delta
- $0/yr ($0/mo · 0.0%)
ⓘ Screening estimate from a state-policy table — verify with the county assessor before closing.
Climate risk First Street
- Flood 1/10 Low FEMA zone X (shaded) · 0% chance over 30 yrs
- Wildfire 1/10 Low
- Heat 10/10 Extreme 7 d/yr ≥106°F today · 27 d/yr by 30 yrs out
- Wind 10/10 Extreme 99% chance of damaging wind over 30 yrs
- Air quality 2/10 Low 2 unhealthy d/yr today · 2 by 30 yrs out
Nearby sold comps map
Loading sold comps map…
Walkable amenities ~0.75 mi
Loading nearby amenities…
Taxation est. · year 1
- Rental income
- $27,667
- − Mortgage interest
- −$8,346
- − Property taxes
- −$2,498
- − Insurance
- −$745
- − Repairs & maintenance
- −$2,213
- − Management
- −$2,213
- − HOA
- −$5,256
- − Depreciation
- −$4,335
- Taxable income
- $2,060
- Est. tax owed @ 24.0%
- −$494
- After-tax cash flow
- $3,487/yr
For passive investors: Depreciation is non-cash, so a rental often shows a tax loss while cash-flowing — sheltering income. Rental losses are passive: they offset passive income freely, and up to $25,000/yr can offset ordinary (W-2) income if you actively participate and your MAGI is under $100k (phasing out to $0 by $150k); unused losses carry forward. On sale, claimed depreciation is recaptured at up to 25%, and gains may owe capital-gains tax (a 1031 exchange can defer both). Figures are a year-1 estimate at your 24.0% rate — not tax advice; consult a CPA.
Schools (NCES district)
- District
- Broward
- NCES district ID
- 1200180
- Math proficiency
- 42% ▼ -18.00%
- Reading proficiency
- 53% ▼ -5.00%
- Median HH income
- $52,139
- Composite
- 40.88/100
- National rank
- #3621
- State rank
- #46 of 73 in FL
Livability — Pembroke Pines
- Score
- 83/100
- State rank
- #54
- US rank
- #933
Category grades
Schools grade is shown separately in the Schools card above.
Census & demographics
- Census place
- Pembroke Pines, FL
- County
- Broward County · 1,963,430 people
- City population
- 180,224
- Metro
- Miami-Fort Lauderdale-Pompano Beach, FL
- Population (ZIP)
- 65,116
- Household income
- $76,561
- Rent vs Own
- Severe rent burden
- 1728.0
Population outlook (Broward County) Hauer SSP2
- Today (2025)
- 2,207,033 people
- By 2030
- 2,360,704 · +7.0%
- By 2040
- 2,661,208 · +20.6%
- By 2050
- 2,946,698 · +33.5%
- By 2075
- 3,602,273 · +63.2%
- By 2100
- 3,970,984 · +79.9%
Race, ethnicity, and origin ACS 2023
- Neighborhood character
- Diverse neighborhood (Simpson 0.65)
- Race & ethnicity
- Hispanic / Latino 52% Two or more races 23% Black 22% White 16% Asian 6%
- Hispanic origin (detail)
- Puerto Rican 6% Cuban 19% Dominican 3%
- Common ancestry
- Hispanic 6% Romanian 1% Scotch-Irish 1%
- Foreign-born
- 47% · Canada, Jamaica, Vietnam
- Languages at home
- 40% English-only · Spanish 47% French/Haitian/Cajun 5% Other Indo-European 2%
Political lean MEDSL · Broward
- 2024 margin
- D (+17.0) · D 58.0% · R 41.0%
- 2008→2024 swing
- -17.8pp toward R · 2008: 34.7pp · 2024: 17.0pp
- All cycles
- 2024: D+17.0 2020: D+29.8 2016: D+35.0 2012: D+34.9 2008: D+34.7
Not yet ingested
- Civics
- —
Market trends
- HPI YoY
- ▼ -2.01%
- Current HPI
- 359.5973
- Rent YoY
- ▼ -0.20%
- Metro
- Miami-Fort Lauderdale-Pompano Beach, FL
- State GDP YoY
- ▲ 3.28%
- F500 in state
- 36
Industry mix (Fortune 500 HQ in FL)
| Industry | F500 HQs | Revenue |
|---|---|---|
| Industrial Technology | 2 | $29B |
|
||
| Insurance | 2 | $17B |
|
||
| Retail | 1 | $60B |
|
||
| Technology Distribution | 1 | $58B |
|
||
| Homebuilding | 1 | $35B |
|
||
| Technology Manufacturing | 1 | $35B |
|
||
Price history
+199.2% since first listed8 events — show timeline
- 2026-05-07 Listed $149,000 Beaches MLS
- 2026-04-29 Listing Removed — Beaches MLS
- 2026-04-17 Price Changed $154,000 Beaches MLS
- 2025-12-10 Listed $160,000 Beaches MLS
- 2017-05-05 Sold (Public Records) $120,000 Public Records
- 2006-09-25 Sold (Public Records) $157,000 Public Records
- 2002-08-22 Sold (Public Records) $70,000 Public Records
- 1988-05-01 Sold (Public Records) $49,800 Public Records
Property tax history
+13.3%/yrLatest (2025): $2,498 · +7.0% YoY. Source: county tax records.
Cash-flow waterfall
monthlySold comps — $/sqft
last 12 mo · ≤1 miLoading sold comps…