 Multi-family
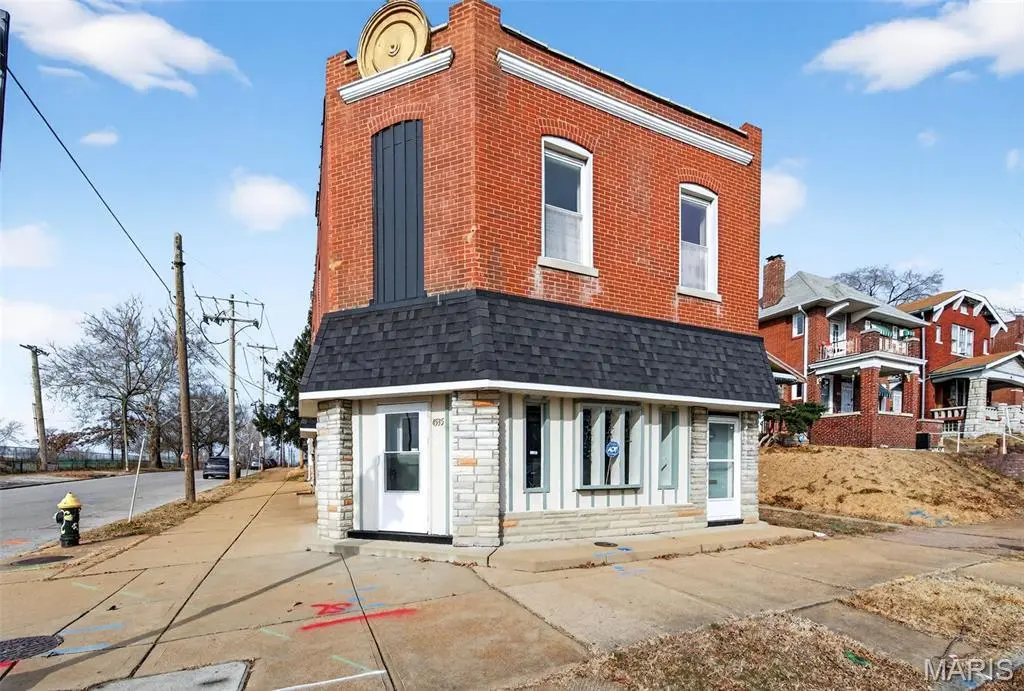
4535 S Grand Blvd · St. Louis, MO
Flood risk 1/10 · Minimal
- FEMA flood zone
- X (unshaded)
- Chance of flooding over 30 yrs
- 0.0%
- Est. flood insurance / yr
- $473 – $860
Fire risk 1/10 · Minimal
- Est. fire insurance / yr
- $1,054 – $1,958
Heat risk 5/10 · Moderate
- Hot days now (above 108°F)
- 7 days/yr
- Hot days in 30 yrs
- 21 days/yr
Wind risk 2/10 · Minimal
- Chance of severe wind over 30 yrs
- 1.0%
Air-quality risk 3/10 · Minor
- Unhealthy air days now
- 3 days/yr
- Unhealthy air days in 30 yrs
- 4 days/yr
Risk factors via First Street. Map © Google.
Why this score? — see what drove the C grade
The composite is a weighted blend of 9 inputs, each scored 0–100. Each bar is that input's sub-score; the figure is the points it added to the 100-point composite (weight × sub-score).
- Cash flow +27.9/30.0
- DSCR +9.9/10.0
- 1% rule +6.5/10.0
- Rent growth +3.3/5.0
- Livability +2.5/5.0
- Condition / age +2.5/5.0
- ARV discount +1.9/15.0
- Schools +1.2/10.0
- Appreciation +0.0/10.0
$248,000
🖨 Deal sheet (PDF) 📄 Offer letter ✓ Due diligence
Multi-family units
County records classify this as Multi-Family (5+ Unit). Listing-text estimate: 1 unit. estimate disagrees with records
5+ unit building — per-unit beds/baths from public records are typically unavailable; the breakdown below (if shown) is an estimate from the listing text.
Listing remarks MLS
Motivated seller...Located on a high-traffic corner lot, this versatile mixed-use property offers exceptional visibility and endless possibilities. Whether you're an investor looking for multiple streams of income or an entrepreneur ready to live & work in one place, this unique opportunity has it all. On the main level, you'll find a spacious open area perfect for retail shop, salon, office, etc with 1.5 bathrooms and a layout designed for flexibility, that's ready to fit your vision. The large windows and corner frontage offer excellent exposure to daily drive-by traffic. A separate entrance leads to the beautifully remodeled upstairs living area, ft 3 bedrooms brand-new kitchen, new flooring, and fresh, neutral paint throughout. Enjoy the convenience of living where you work or rent it out for additional passive income. Outside enjoy your private rooftop deck, ideal for relaxing, or create a rooftop garden. A fenced-in backyard adds even more outdoor space, perfect for pets. No seller or creative financing deals.
Key facts
- Large windows
- Spacious open area
- Corner frontage
Tags
Neighborhood map
What this means for you Summary
Snapshot
- This is a 3-bed/2.5-bath multifamily listed at $248k.
Deal economics
- At list price, monthly cash flow is $764 ($9k/yr) — positive.
- The deal already cash-flows at list — no discount required.
- Meets the 1% rule at list price ($3k rent vs $248k).
- Recommended offer: $218k (12.0% below list) — sets the bar for market timing.
- Cap rate 10.0% vs local median 5.0% in St. Louis — top-decile yield for the area; either an underpriced asset or a hidden risk that comps aren't pricing in. Stress-test before assuming the spread holds.
Location & tenants
- Location reads: area grade C — affects rentability + tenant quality, not the cash-flow math above.
- St. Louis City (urban): math 10% / reading 18% proficiency, ranked #312 of 324 in MO (top 96%) — low school quality limits family demand, transient renter base, plan for 1-2y turnover; 80% free/reduced lunch — lower-income household profile, screen leases tightly.
- Zoned schools: Nahed Chapman New American Aca (math 2% / reading 2%, grade F, #1,099 of 1,115 statewide, top 100%, 335 students, 99% FRL); Gateway Middle (math 0% / reading 8%, grade F, #389 of 391 statewide, top 100%, 506 students, 99% FRL); Roosevelt High (math 2% / reading 8%, grade F, #517 of 521 statewide, top 100%, 460 students, 99% FRL) — zoned schools average 99% FRL vs 80% district-wide (19 pts higher); higher-poverty schools than district average — tighter screening recommended.
- Market conditions: Rents rising (+3.3%/yr); 125 active listings in the ZIP; 4 comparable units currently listed for rent nearby; rentals lingering (median 45d on market — plan ~5-8 weeks vacancy on turnover, expect pricing pressure); 50% of comp listings sitting > 30 days — soft ceiling on asking rent; 294 units permitted in St. Louis city in 2024 (227 in 5+ unit buildings).
Forward outlook
- Local home prices are declining (-3.0%/yr); year-one equity from $2k of loan paydown is wiped out by about $7k of value loss. Plan a longer hold.
- St. Louis County population projected to shrink 6% by 2050 — rents likely to lag national; underwrite the cash flow, not the appreciation.
- At projected returns (-3.0% appreciation + 3.3% rent growth), your $69k cash investment doubles in ~9 years — after that, you're playing with house money.
Negotiation context
- It's been on market 130 days — a 12% lower offer ($218k) is reasonable based on typical stale-listing flexibility.
- 4 sale attempts since 2y ago with the ask held roughly flat each time — persistent listings suggest the price (not the market) is what's stuck; bring a comps-based counter.
- Current owner paid $190k; 31% above their basis — modest negotiation headroom, anchor on the comps not their cost.
Risks & watch-outs
- Watch-outs: built in 1909 — expect roof / HVAC / electrical / plumbing capex.
- Climate carrying-cost: extreme-heat days projected 7→21/yr by 2055 (HVAC capex compounding) — expect insurance premiums to compound above CPI over the hold.
Questions for the listing agent
- It's been on market 130 days. Have you received any prior offers? Is the seller open to a 12% concession, seller financing, or rate buy-down credit?
- Built in 1909 — when were the roof, HVAC, electrical panel, plumbing, and water heater last replaced?
- Why hasn't it sold? Are there any deal-killer items the seller is aware of (foundation, flood, title, zoning, code violations)?
- Is there a deadline driving the sale (1031 exchange, divorce, estate, relocation)? That informs how much negotiation room exists.
- What's the average days-on-market for RENTAL listings here right now (not sales)? A rising rental-DOM trend means longer vacancies and softer asking-rent achievability than the comps imply.
- What's the recent tenant-quality profile in this submarket — average credit score on applications, eviction rate, late-payment / NSF rate, and stable-employment percentage? A property-management company in the area should have these aggregated.
- How much new apartment / multifamily construction is in the pipeline within 1–3 miles? Heavy new supply (>2% of stock underway) typically softens rents 12–24 months out; light construction supports rent growth.
Investment metrics
- 1% rule
- 1.15% ✓
- Cap rate
- 9.99%
- Cash-on-cash
- 13.20%
- DSCR
- 1.59
- GRM
- 7.2
CMA / ARV
- ARV (median comp)
- $220,367
- List price
- $248,000
- Delta
- 12.54%
- Verdict
- OVERPRICED
- Comps
- 20 within 1.0 mi
Show comp detail 12 sales within ~0.75 mi
| Address | Dist | Beds/Ba | Sqft | Sold | Price | $/sf | Match |
|---|---|---|---|---|---|---|---|
| 3610 Neosho St | 0.10mi | 4/4.0 (+1) | 3,384 (-5%) | 3mo | $164,900 | $49 | 74 |
| 4226 Dewey Ave | 0.31mi | 4/4.0 (+1) | 3,536 (-0%) | 15mo | $279,900 | $79 | 62 |
| 4552 Virginia Ave | 0.35mi | 4/4.0 (+1) | 3,740 (+6%) | 4mo | $40,000 | $11 | 60 |
| 4234 Dewey Ave | 0.30mi | 4/4.0 (+1) | 3,536 (-0%) | 18mo | $194,900 | $55 | 59 |
| 3230 Pulaski St | 0.42mi | 4/4.0 (+1) | 3,570 (+1%) | 12mo | $299,000 | $84 | 58 |
| 3706 Meramec St | 0.33mi | 4/4.0 (+1) | 3,392 (-4%) | 17mo | $385,000 | $114 | 52 |
| 3420 Klocke St | 0.41mi | 4/4.0 (+1) | 3,344 (-6%) | 14mo | $225,000 | $67 | 49 |
| 5524 S Grand Blvd | 0.64mi | 4/2.0 (+1) | 3,672 (+4%) | 15mo | $99,900 | $27 | 45 |
| 4513 Pennsylvania Ave | 0.56mi | 4/4.0 (+1) | 3,810 (+7%) | 11mo | $230,000 | $60 | 41 |
| 4121 Michigan Ave | 0.57mi | 4/4.0 (+1) | 3,336 (-6%) | 14mo | $260,000 | $78 | 41 |
| 3435 Alberta St | 0.65mi | 4/4.0 (+1) | 3,850 (+9%) | 5mo | $160,000 | $42 | 40 |
| 3714 Bates St | 0.72mi | 4/4.0 (+1) | 3,774 (+6%) | 15mo | $275,000 | $73 | 32 |
Match score weights: distance 35% · size 25% · config 20% · recency 20%. Top-matched comps best support the ARV.
Projected returns pro-forma
-3.0% appreciation · 3.27% rent growth · sell at horizon
- IRR
- 3.4%
- Equity multiple
- 1.13×
- Total profit
- $9,146
- Equity at exit
- $36,978
- IRR
- 13.1%
- Equity multiple
- 2.06×
- Total profit
- $73,431
- Equity at exit
- $21,443
Cash invested: $69,440 (down + closing). Projections, not guarantees.
Landlord ↔ Tenant lean methodology
- Overall (STATE)
- 81 Strongly Landlord-Friendly
- State Missouri
- 81 Strongly Landlord-Friendly · R+10
- County
- — inherits STATE
- City
- — inherits STATE
ZIP-level market 63111
- Rents YoY
- 3.3%
- Active inventory
- 125
- Price-to-rent
- 14.5×
Monthly cashflow live
- Estimated rent
- $2,853 high interval (Pro) →
- Mortgage (P&I)
- −$1,301
- Tax from tax record
- −$86 /mo · $1,034/yr
- Insurance
- −$103
- HOA
- −$0
- Vacancy / Maint / Mgmt
- −$599
- Net cashflow
- $764
Break-even live
Sensitivity live
| Price | -10% $904 | -5% $834 | +0% $764 | +5% $694 | +10% $623 |
|---|---|---|---|---|---|
| Rent | -10% $538 | -5% $651 | +0% $764 | +5% $877 | +10% $989 |
| Rate | -1.0pp $889 | -0.5pp $827 | base $764 | +0.5pp $700 | +1.0pp $634 |
2-unit breakdown (identical units grouped — click to expand)
| Units | Beds | Baths | Est. rent |
|---|---|---|---|
| 2× units | 3 | 2 | $2,852 |
| #1 | 3 | 2 | $1,426 |
| #2 | 3 | 2 | $1,426 |
| Total (2 units) | $2,853 | ||
UW: 25.0% down · 7.5% · 30yr · 1.5% tax · 5.0% vac · 8.0% maint · 8.0% mgmt
Financing live
Cash to close
- Down payment
- $62,000
- Closing costs
- $7,440
- Reserves months
- —
- Total cash needed
- —
Loan-product check · same deal, 3 products live
Conventional
25% down · 7.5% · 30yr
- Down + closing
- —
- Monthly P&I
- —
- Monthly cashflow
- —
- DSCR
- —
- Eligible?
- —
Personal DTI + credit; lowest rate.
DSCR
20% down · 8.5% · 30yr
- Down + closing
- —
- Monthly P&I
- —
- Monthly cashflow
- —
- DSCR
- —
- Eligible?
- —
No personal income docs; deal must DSCR.
Hard money
10% down · 12.0% · 12mo
- Down + closing
- —
- Monthly P&I
- —
- Monthly cashflow
- —
- DSCR
- —
- Eligible?
- —
Short-term bridge; refi at stabilization.
Rent comps 4 comps
| Address | Beds | Baths | Sqft | Rent | $/sqft | DOM | Units | Dist |
|---|---|---|---|---|---|---|---|---|
| 755 Dover Pl Saint Louis, MO | 2.0 | 1.0 | 2750 | $1,000 | $0.36 | 45d | 1 | 0.87mi |
| 5301 S Broadway Saint Louis, MO | 2.0 | 1.0 | 3809 | $1,900 | $0.50 | 0d | 1 | 0.95mi |
| 3807 Potomac St Saint Louis, MO | 3.0 | 1.0 | 2588 | $1,100 | $0.43 | 45d | 1 | 1.21mi |
| 3807 Potomac St Saint Louis, MO | 3.0 | 1.0 | 2588 | $1,300 | $0.50 | 9d | 1 | 1.21mi |
Listing history 25 events
-
2026-06-05days on market $248,000 Active 130 DOM
-
2026-06-03days on market $248,000 Active 129 DOM
-
2026-06-02days on market $248,000 Active 128 DOM
-
2026-06-01days on market $248,000 Active 127 DOM
-
2026-05-31days on market $248,000 Active 126 DOM
-
2026-05-04price $248,000 1035-char remark
Show marketing remark (1035 chars)
Motivated seller...Located on a high-traffic corner lot, this versatile mixed-use property offers exceptional visibility and endless possibilities. Whether you're an investor looking for multiple streams of income or an entrepreneur ready to live & work in one place, this unique opportunity has it all. On the main level, you'll find a spacious open area perfect for retail shop, salon, office, etc with 1.5 bathrooms and a layout designed for flexibility, that's ready to fit your vision. The large windows and corner frontage offer excellent exposure to daily drive-by traffic. A separate entrance leads to the beautifully remodeled upstairs living area, ft 3 bedrooms brand-new kitchen, new flooring, and fresh, neutral paint throughout. Enjoy the convenience of living where you work or rent it out for additional passive income. Outside enjoy your private rooftop deck, ideal for relaxing, or create a rooftop garden. A fenced-in backyard adds even more outdoor space, perfect for pets. No seller or creative financing deals.
-
2026-03-02price $254,900 1035-char remark
Show marketing remark (1035 chars)
Motivated seller...Located on a high-traffic corner lot, this versatile mixed-use property offers exceptional visibility and endless possibilities. Whether you're an investor looking for multiple streams of income or an entrepreneur ready to live & work in one place, this unique opportunity has it all. On the main level, you'll find a spacious open area perfect for retail shop, salon, office, etc with 1.5 bathrooms and a layout designed for flexibility, that's ready to fit your vision. The large windows and corner frontage offer excellent exposure to daily drive-by traffic. A separate entrance leads to the beautifully remodeled upstairs living area, ft 3 bedrooms brand-new kitchen, new flooring, and fresh, neutral paint throughout. Enjoy the convenience of living where you work or rent it out for additional passive income. Outside enjoy your private rooftop deck, ideal for relaxing, or create a rooftop garden. A fenced-in backyard adds even more outdoor space, perfect for pets. No seller or creative financing deals.
-
2026-01-26$259,500 Active 1035-char remark
Show marketing remark (1035 chars)
Motivated seller...Located on a high-traffic corner lot, this versatile mixed-use property offers exceptional visibility and endless possibilities. Whether you're an investor looking for multiple streams of income or an entrepreneur ready to live & work in one place, this unique opportunity has it all. On the main level, you'll find a spacious open area perfect for retail shop, salon, office, etc with 1.5 bathrooms and a layout designed for flexibility, that's ready to fit your vision. The large windows and corner frontage offer excellent exposure to daily drive-by traffic. A separate entrance leads to the beautifully remodeled upstairs living area, ft 3 bedrooms brand-new kitchen, new flooring, and fresh, neutral paint throughout. Enjoy the convenience of living where you work or rent it out for additional passive income. Outside enjoy your private rooftop deck, ideal for relaxing, or create a rooftop garden. A fenced-in backyard adds even more outdoor space, perfect for pets. No seller or creative financing deals.
-
2026-01-26historical $259,500 1035-char remark
Show marketing remark (1035 chars)
Motivated seller...Located on a high-traffic corner lot, this versatile mixed-use property offers exceptional visibility and endless possibilities. Whether you're an investor looking for multiple streams of income or an entrepreneur ready to live & work in one place, this unique opportunity has it all. On the main level, you'll find a spacious open area perfect for retail shop, salon, office, etc with 1.5 bathrooms and a layout designed for flexibility, that's ready to fit your vision. The large windows and corner frontage offer excellent exposure to daily drive-by traffic. A separate entrance leads to the beautifully remodeled upstairs living area, ft 3 bedrooms brand-new kitchen, new flooring, and fresh, neutral paint throughout. Enjoy the convenience of living where you work or rent it out for additional passive income. Outside enjoy your private rooftop deck, ideal for relaxing, or create a rooftop garden. A fenced-in backyard adds even more outdoor space, perfect for pets. No seller or creative financing deals.
-
2025-07-31price $269,900
-
2025-06-25price $274,400
-
2025-05-15$274,900 Active
-
2025-03-18soldstatus $190,000
-
2025-03-06soldstatus Closed
-
2025-03-06soldstatus Closed
-
2025-02-20status Pending
-
2025-02-20status Pending
-
2025-02-18historical Active Under Contract
-
2025-02-18historical Active Under Contract
-
2025-02-12price $225,000
-
2025-02-12price $225,000
-
2024-12-24$250,000 Active
-
2024-12-16$250,000 Active
-
2024-11-24historical $250,000
-
2016-06-02soldstatus
ⓘ Source: listings_history table (triggers on properties + properties_extension) + one-shot
backfill from property_details.listing_events for pre-trigger history.
Tax reassessment forecast MO · Resets to sale price
- Current annual tax
- $1,034 · $86/mo
- Projected year-2 tax
- $2,406 · $200/mo
- Expected delta
- +$1,372/yr (+$114/mo · 132.7%)
ⓘ Screening estimate from a state-policy table — verify with the county assessor before closing.
Climate risk First Street
- Flood 1/10 Low FEMA zone X (unshaded) · 0% chance over 30 yrs
- Wildfire 1/10 Low
- Heat 5/10 Major 7 d/yr ≥108°F today · 21 d/yr by 30 yrs out
- Wind 2/10 Low 100% chance of damaging wind over 30 yrs
- Air quality 3/10 Moderate 3 unhealthy d/yr today · 4 by 30 yrs out
Nearby sold comps map
Loading sold comps map…
Walkable amenities ~0.75 mi
Loading nearby amenities…
Taxation est. · year 1
- Rental income
- $34,236
- − Mortgage interest
- −$13,892
- − Property taxes
- −$1,034
- − Insurance
- −$1,240
- − Repairs & maintenance
- −$2,739
- − Management
- −$2,739
- − Depreciation
- −$7,215
- Taxable income
- $5,378
- Est. tax owed @ 24.0%
- −$1,291
- After-tax cash flow
- $7,875/yr
For passive investors: Depreciation is non-cash, so a rental often shows a tax loss while cash-flowing — sheltering income. Rental losses are passive: they offset passive income freely, and up to $25,000/yr can offset ordinary (W-2) income if you actively participate and your MAGI is under $100k (phasing out to $0 by $150k); unused losses carry forward. On sale, claimed depreciation is recaptured at up to 25%, and gains may owe capital-gains tax (a 1031 exchange can defer both). Figures are a year-1 estimate at your 24.0% rate — not tax advice; consult a CPA.
Schools (NCES district)
- District
- St. Louis City
- NCES district ID
- 2929280
- Math proficiency
- 10% ▼ -6.00%
- Reading proficiency
- 18% ▼ -3.00%
- Median HH income
- $35,685
- Composite
- 11.54/100
- National rank
- #9699
- State rank
- #312 of 324 in MO
Livability — St. Louis
No livability data for this city. (Only ~50 U.S. cities are tracked.)
Census & demographics
- Census place
- St. Louis, MO
- County
- Saint Louis City · 254,015 people
- City population
- 283,259
- Metro
- St. Louis, MO-IL
- Population (ZIP)
- 18,851
- Household income
- $47,039
- Rent vs Own
- Severe rent burden
- 1364.0
Population outlook (St. Louis County) Hauer SSP2
- Today (2025)
- 315,737 people
- By 2030
- 313,865 · -0.6%
- By 2040
- 305,439 · -3.3%
- By 2050
- 296,529 · -6.1%
- By 2075
- 271,028 · -14.2%
- By 2100
- 255,359 · -19.1%
Race, ethnicity, and origin ACS 2023
- Neighborhood character
- Diverse neighborhood (Simpson 0.65)
- Race & ethnicity
- Black 42% White 41% Two or more races 11% Hispanic / Latino 9% Asian 1%
- Hispanic origin (detail)
- Mexican 6%
- Common ancestry
- Lithuanian 3% Slovak 1% Romanian 1%
- Foreign-born
- 7% · Canada, India
- Languages at home
- 90% English-only · Spanish 7% Other Indo-European 1%
Political lean MEDSL · St. Louis
- 2024 margin
- Solid D (+64.7) · D 81.4% · R 16.7% · Other 2.0%
- 2008→2024 swing
- -3.5pp toward R · 2008: 68.2pp · 2024: 64.7pp
- All cycles
- 2024: D+64.7 2020: D+66.2 2016: D+63.7 2012: D+66.6 2008: D+68.2
Not yet ingested
- Civics
- —
Market trends
- HPI YoY
- ▼ -92.80%
- Current HPI
- 169.4644
- Rent YoY
- ▲ 3.27%
- Metro
- St. Louis, MO-IL
- State GDP YoY
- ▲ 1.84%
- F500 in state
- 20
Industry mix (Fortune 500 HQ in MO)
| Industry | F500 HQs | Revenue |
|---|---|---|
| Healthcare | 1 | $163B |
|
||
| Insurance | 1 | $21B |
|
||
| Industrial Technology | 1 | $17B |
|
||
| Retail | 1 | $16B |
|
||
| Industrial Distribution | 1 | $10B |
|
||
| Utilities | 1 | $9B |
|
||
Price history
-0.8% since first listed20 events — show timeline
- 2026-05-04 Price Changed $248,000 MARIS as Distributed by MLS Grid
- 2026-03-02 Price Changed $254,900 MARIS as Distributed by MLS Grid
- 2026-01-26 Listed $259,500 MARIS as Distributed by MLS Grid
- 2026-01-26 Coming Soon $259,500 MARIS as Distributed by MLS Grid
- 2025-07-31 Price Changed $269,900 MARIS as Distributed by MLS Grid
- 2025-06-25 Price Changed $274,400 MARIS as Distributed by MLS Grid
- 2025-05-15 Listed $274,900 MARIS as Distributed by MLS Grid
- 2025-03-18 Sold (Public Records) $190,000 Public Records
- 2025-03-06 Sold (MLS) — MARIS as Distributed by MLS Grid
- 2025-03-06 Sold (MLS) — MARIS as Distributed by MLS Grid
- 2025-02-20 Pending — MARIS as Distributed by MLS Grid
- 2025-02-20 Pending — MARIS as Distributed by MLS Grid
- 2025-02-18 Contingent — MARIS as Distributed by MLS Grid
- 2025-02-18 Contingent — MARIS as Distributed by MLS Grid
- 2025-02-12 Price Changed $225,000 MARIS as Distributed by MLS Grid
- 2025-02-12 Price Changed $225,000 MARIS as Distributed by MLS Grid
- 2024-12-24 Listed $250,000 MARIS as Distributed by MLS Grid
- 2024-12-16 Listed $250,000 MARIS as Distributed by MLS Grid
- 2024-11-24 Coming Soon $250,000 MARIS as Distributed by MLS Grid
- 2016-06-02 Sold (Public Records) — Public Records
Property tax history
-2.0%/yrLatest (2024): $1,034 · +5.2% YoY. Source: county tax records.
Cash-flow waterfall
monthlySold comps — $/sqft
last 12 mo · ≤1 miLoading sold comps…