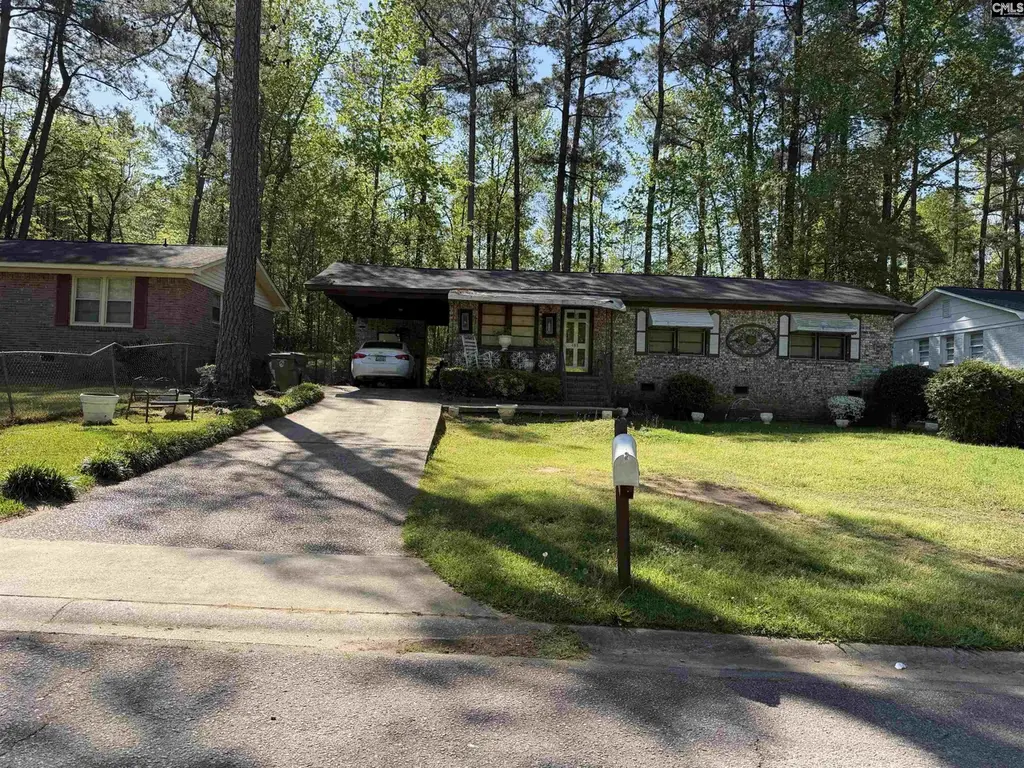
400 Stanford St · Columbia, SC
Flood risk 1/10 · Minimal
- FEMA flood zone
- X (unshaded)
- Chance of flooding over 30 yrs
- 0.0%
- Est. flood insurance / yr
- $507 – $1,088
Fire risk 4/10 · Minor
- Est. fire insurance / yr
- $783 – $1,453
Heat risk 6/10 · Moderate
- Hot days now (above 108°F)
- 7 days/yr
- Hot days in 30 yrs
- 16 days/yr
Wind risk 6/10 · Moderate
- Chance of severe wind over 30 yrs
- 60.0%
Air-quality risk 3/10 · Minor
- Unhealthy air days now
- 2 days/yr
- Unhealthy air days in 30 yrs
- 2 days/yr
Risk factors via First Street. Map © Google.
Why this score? — see what drove the B+ grade
The composite is a weighted blend of 9 inputs, each scored 0–100. Each bar is that input's sub-score; the figure is the points it added to the 100-point composite (weight × sub-score).
- Cash flow +30.0/30.0
- ARV discount +15.0/15.0
- 1% rule +10.0/10.0
- DSCR +10.0/10.0
- Livability +3.9/5.0
- Rent growth +3.1/5.0
- Schools +2.6/10.0
- Condition / age +2.5/5.0
- Appreciation +0.0/10.0
$99,000
🖨 Deal sheet 📄 Offer letter ✓ Due diligence
Listing remarks
Opportunity awaits in the established Hollywood Hills subdivision. This 4-bedroom, 1-bath home offers 1,144 square feet and a functional layout ready for its next chapter. With value-add potential and opportunity for updates and improvements, this property is well-suited for those looking to expand a portfolio or step into investment ownership. A great chance to secure a property with immediate potential and long-term upside. Disclaimer: CMLS has not reviewed and, therefore, does not endorse vendors who may appear in listings.
Key facts
- Value add potential
- Long term upside
- Built 1971
Tags
Property features AI
Exterior
- Parking: Attached carport
- Utilities: Public water; Public sewer
- Home design: Single-story home
- Construction: Crawlspace foundation
- Exterior features: Covered front porch; Paved road access; Brick finish on all sides above the foundation
Interior
- Bedrooms: Master bedroom on the main level; Second bedroom on the main level; Third bedroom on the main level; Fourth bedroom on the main level
- Bathrooms: One full bathroom on the main level; One full bathroom total
- Heating & cooling: Central heat; Central air
- Interior features: Central heating; Central air conditioning
- Laundry & utility: Utility room for laundry/household tasks
Neighborhood map
What this means for you Summary
Snapshot
- This is a 4-bed/2.0-bath single-family listed at $99k.
Deal economics
- At list price, monthly cash flow is $663 ($8k/yr) — positive.
- The deal already cash-flows at list — no discount required.
- Meets the 1% rule at list price ($2k rent vs $99k).
- Recommended offer: $98k (1.5% below list) — sets the bar for market timing.
- Cap rate 14.3% vs local median 5.0% in Columbia — top-decile yield for the area; either an underpriced asset or a hidden risk that comps aren't pricing in. Stress-test before assuming the spread holds.
Location & tenants
- Location reads 78/100 on livability (#18 in SC, #2,436 nationally) — a middle-class / working-renter tenant base. Strengths: amenities A+, commute A+, cost of living A+; Watch: employment D, crime F.
- Richland 01 (urban): math 26% / reading 36% proficiency, ranked #54 of 80 in SC (top 68%) — families likely to look elsewhere, expect single-tenant / working-renter base with shorter leases; 64% free/reduced lunch — lower-income household profile, screen leases tightly.
- Zoned schools: W.J. Keenan High (math 54% / reading 77%, grade B, #83 of 196 statewide, top 43%, 725 students, 100% FRL) — zoned schools average 100% FRL vs 64% district-wide (36 pts higher); higher-poverty schools than district average — tighter screening recommended.
- Zoned-school proficiency averages 66% at this address vs 31% district-wide (+35 pts) — the actual schools serving this property are materially stronger than the Richland 01 average implies; a family-tenant draw the district grade alone would hide.
- Market conditions: Rents rising (+2.5%/yr); 238 active listings in the ZIP; 3,472 units permitted in Richland County in 2024 (1,096 in 5+ unit buildings).
- At $1,739/mo this rent would consume 45% of the median local household income ($46k/yr) (locally 1980% of renters already pay >50% of income on rent) — very limited rent-growth headroom before tenants either downsize or default.
Forward outlook
- Local home prices are declining (-3.0%/yr); year-one equity from $684 of loan paydown is wiped out by about $3k of value loss. Plan a longer hold.
- Richland County population projected at +30% by 2050 — long-run rental-demand tailwind backs the buy-and-hold thesis.
- At projected returns (-3.0% appreciation + 2.5% rent growth), your $28k cash investment doubles in ~5 years — after that, you're playing with house money.
Negotiation context
- It's been on market 24 days — a 2% lower offer ($98k) is reasonable based on typical stale-listing flexibility.
- 2 sale attempts; this cycle's ask has dropped $6k (6%) from the opening price — seller is motivated, your offer sets the floor, not the list.
Risks & watch-outs
- Climate carrying-cost: major wind risk, 60% chance of damaging wind over 30y; extreme-heat days projected 7→16/yr by 2055 (HVAC capex compounding) — expect insurance premiums to compound above CPI over the hold.
Questions for the listing agent
- Built in 1971 — when were the roof, HVAC, electrical panel, plumbing, and water heater last replaced?
- Is there a deadline driving the sale (1031 exchange, divorce, estate, relocation)? That informs how much negotiation room exists.
- Schools are D-rated, which usually means shorter tenancies and higher turnover. Who's the typical renter profile here, and what's been the actual vacancy rate?
- Crime grade is F in this area — have there been break-ins, vandalism, or insurance claims at this property in the last 3 years? What carrier currently insures it and at what premium?
- What's the average days-on-market for RENTAL listings here right now (not sales)? A rising rental-DOM trend means longer vacancies and softer asking-rent achievability than the comps imply.
- What's the recent tenant-quality profile in this submarket — average credit score on applications, eviction rate, late-payment / NSF rate, and stable-employment percentage? A property-management company in the area should have these aggregated.
- How much new for-sale + rental construction is in the pipeline within 1–3 miles? Heavy new supply typically softens prices + rents 12–24 months out; constrained supply supports both.
Investment metrics
- 1% rule
- 1.76% ✓
- Cap rate
- 14.33%
- Cash-on-cash
- 28.71%
- DSCR
- 2.28
- GRM
- 4.7
CMA / ARV
- ARV (on-the-fly)
- $153,296
- Comps found
- 4
Show comp detail 4 sales within ~0.75 mi
| Address | Dist | Beds/Ba | Sqft | Sold | Price | $/sf | Match |
|---|---|---|---|---|---|---|---|
| 416 Woodcrest Dr | 0.28mi | 3/2.0 (-1) | 1,175 (+3%) | 16mo | $174,000 | $148 | 64 |
| 709 Meadowlake Dr | 0.53mi | 3/2.0 (-1) | 1,102 (-4%) | 2mo | $148,000 | $134 | 63 |
| 140 Beaver Brook Rd | 0.26mi | 3/1.0 (-1) | 1,100 (-4%) | 18mo | $90,000 | $82 | 58 |
| 436 Green Tree Cir | 0.38mi | 3/1.0 (-1) | 1,010 (-12%) | 2mo | $85,000 | $84 | 52 |
Match score weights: distance 35% · size 25% · config 20% · recency 20%. Top-matched comps best support the ARV.
Projected returns pro-forma
-3.0% appreciation · 2.5% rent growth · sell at horizon
- IRR
- 22.5%
- Equity multiple
- 1.92×
- Total profit
- $25,367
- Equity at exit
- $14,761
- IRR
- 30.2%
- Equity multiple
- 3.64×
- Total profit
- $73,113
- Equity at exit
- $8,560
Cash invested: $27,720 (down + closing). Projections, not guarantees.
Landlord ↔ Tenant lean methodology
- Overall (STATE)
- 90 Strongly Landlord-Friendly
- State South Carolina
- 90 Strongly Landlord-Friendly · R+6
- County
- — inherits STATE
- City
- — inherits STATE
ZIP-level market 29203
- Home prices YoY
- -31.6%
- Rents YoY
- 2.5%
- Active inventory
- 238
- Price-to-rent
- 4.7×
Monthly cashflow live
- Estimated rent
- $1,739 medium interval (Pro) →
- Mortgage (P&I)
- −$519
- Tax from tax record
- −$150 /mo · $1,800/yr
- Insurance
- −$41
- HOA
- −$0
- Vacancy / Maint / Mgmt
- −$365
- Net cashflow
- $663
Break-even live
UW: 25.0% down · 7.5% · 30yr · 1.5% tax · 5.0% vac · 8.0% maint · 8.0% mgmt
Financing live
Cash to close
- Down payment
- $24,750
- Closing costs
- $2,970
- Reserves months
- —
- Total cash needed
- —
Loan-product check · same deal, 3 products live
Conventional
25% down · 7.5% · 30yr
- Down + closing
- —
- Monthly P&I
- —
- Monthly cashflow
- —
- DSCR
- —
- Eligible?
- —
Personal DTI + credit; lowest rate.
DSCR
20% down · 8.5% · 30yr
- Down + closing
- —
- Monthly P&I
- —
- Monthly cashflow
- —
- DSCR
- —
- Eligible?
- —
No personal income docs; deal must DSCR.
Hard money
10% down · 12.0% · 12mo
- Down + closing
- —
- Monthly P&I
- —
- Monthly cashflow
- —
- DSCR
- —
- Eligible?
- —
Short-term bridge; refi at stabilization.
Listing history 7 events
-
2026-06-18days on market $99,000 Active 24 DOM
-
2026-06-17days on market $99,000 Active 23 DOM
-
2026-06-16days on market $99,000 Active 22 DOM
-
2026-06-15days on market $99,000 Active 21 DOM
-
2026-06-14days on market $99,000 Active 19 DOM
-
2026-06-10remarks 533-char remark
-
2026-06-10$99,000 Active 16 DOM
ⓘ Source: listings_history table (triggers on properties + properties_extension) + one-shot
backfill from property_details.listing_events for pre-trigger history.
Tax reassessment forecast SC · Resets to sale price
- Current annual tax
- $1,800 · $150/mo
- Projected year-2 tax
- $1,800 · $150/mo
- Expected delta
- $0/yr ($0/mo · 0.0%)
ⓘ Screening estimate from a state-policy table — verify with the county assessor before closing.
Climate risk First Street
- Flood 1/10 Low FEMA zone X (unshaded) · 0% chance over 30 yrs
- Wildfire 4/10 Moderate
- Heat 6/10 Major 7 d/yr ≥108°F today · 16 d/yr by 30 yrs out
- Wind 6/10 Major 60% chance of damaging wind over 30 yrs
- Air quality 3/10 Moderate 2 unhealthy d/yr today · 2 by 30 yrs out
Nearby sold comps map
Loading sold comps map…
Walkable amenities ~0.75 mi
Loading nearby amenities…
Taxation est. · year 1
- Rental income
- $20,865
- − Mortgage interest
- −$5,546
- − Property taxes
- −$1,800
- − Insurance
- −$495
- − Repairs & maintenance
- −$1,669
- − Management
- −$1,669
- − Depreciation
- −$2,880
- Taxable income
- $6,806
- Est. tax owed @ 24.0%
- −$1,633
- After-tax cash flow
- $6,325/yr
For passive investors: Depreciation is non-cash, so a rental often shows a tax loss while cash-flowing — sheltering income. Rental losses are passive: they offset passive income freely, and up to $25,000/yr can offset ordinary (W-2) income if you actively participate and your MAGI is under $100k (phasing out to $0 by $150k); unused losses carry forward. On sale, claimed depreciation is recaptured at up to 25%, and gains may owe capital-gains tax (a 1031 exchange can defer both). Figures are a year-1 estimate at your 24.0% rate — not tax advice; consult a CPA.
Schools (NCES district)
- District
- Richland 01
- NCES district ID
- 4503360
- Math proficiency
- 26% ▼ -7.00%
- Reading proficiency
- 36% ▼ -5.00%
- Median HH income
- $38,931
- Composite
- 25.94/100
- National rank
- #7335
- State rank
- #54 of 80 in SC
Livability — Columbia
- Score
- 78/100
- State rank
- #18
- US rank
- #2436
Category grades
Schools grade is shown separately in the Schools card above.
Census & demographics
- County
- Richland County · 389,530 people
- City population
- 335,994
- Metro
- Columbia, SC
- Population (ZIP)
- 40,653
- Household income
- $46,054
- Rent vs Own
- Severe rent burden
- 1980.0
Population outlook (Richland County) Hauer SSP2
- Today (2025)
- 459,667 people
- By 2030
- 487,524 · +6.1%
- By 2040
- 542,035 · +17.9%
- By 2050
- 595,371 · +29.5%
- By 2075
- 732,998 · +59.5%
- By 2100
- 820,415 · +78.5%
Race, ethnicity, and origin ACS 2023
- Neighborhood character
- Predominantly Black (80%)
- Race & ethnicity
- Black 80% White 13% Hispanic / Latino 5% Two or more races 2%
- Common ancestry
- Serbian 1%
- Foreign-born
- 3% · Canada
- Languages at home
- 93% English-only · Spanish 5%
Political lean MEDSL · Richland
- 2024 margin
- Solid D (+34.6) · D 66.4% · R 31.8% · Other 1.8%
- 2008→2024 swing
- +5.7pp toward D · 2008: 28.9pp · 2024: 34.6pp
- All cycles
- 2024: D+34.6 2020: D+38.3 2016: D+32.9 2012: D+33.3 2008: D+28.9
Not yet ingested
- Civics
- —
Market trends
- HPI YoY
- ▼ -77.52%
- Current HPI
- 168.2114
- Rent YoY
- ▲ 2.50%
- Metro
- Columbia, SC
- State GDP YoY
- ▲ 4.51%
- F500 in state
- 2
Industry mix (Fortune 500 HQ in SC)
| Industry | F500 HQs | Revenue |
|---|---|---|
| Packaging | 1 | $7B |
|
||
Price history
-89.0% since first listed7 events — show timeline
- 2026-06-10 Price Changed $99,000 Consolidated MLS
- 2026-06-09 Relisted — Consolidated MLS
- 2026-04-14 Listed $105,000 Consolidated MLS
- 2021-11-02 Sold (Public Records) $428,500 Public Records
- 2004-07-30 Sold (Public Records) $418,000 Public Records
- 2002-04-02 Sold (Public Records) $396,000 Public Records
- 2001-09-26 Sold (Public Records) $900,000 Public Records
Property tax history
+1.7%/yrLatest (2025): $1,800 · +2.6% YoY. Source: county tax records.
Cash-flow waterfall
monthlySold comps — $/sqft
last 12 mo · ≤1 miLoading sold comps…