104 3rd St · Sanford, TX
Flood risk 1/10 · Minimal
- FEMA flood zone
- —
- Chance of flooding over 30 yrs
- 0.0%
- Est. flood insurance / yr
- —
Fire risk 10/10 · Severe
- Est. fire insurance / yr
- $1,222 – $2,270
Heat risk 6/10 · Moderate
- Hot days now (above 100°F)
- 7 days/yr
- Hot days in 30 yrs
- 19 days/yr
Wind risk 2/10 · Minimal
- Chance of severe wind over 30 yrs
- —
Air-quality risk 2/10 · Minimal
- Unhealthy air days now
- 1 days/yr
- Unhealthy air days in 30 yrs
- 1 days/yr
Risk factors via First Street. Map © Google.
Why this score? — see what drove the B grade
The composite is a weighted blend of 9 inputs, each scored 0–100. Each bar is that input's sub-score; the figure is the points it added to the 100-point composite (weight × sub-score).
- Cash flow +30.0/30.0
- 1% rule +10.0/10.0
- DSCR +10.0/10.0
- ARV discount +7.5/15.0
- Appreciation +5.0/10.0
- Schools +3.5/10.0
- Livability +2.7/5.0
- Rent growth +2.5/5.0
- Condition / age +2.5/5.0
$24,999
🖨 Deal sheet 📄 Offer letter ✓ Due diligence
Listing remarks MLS
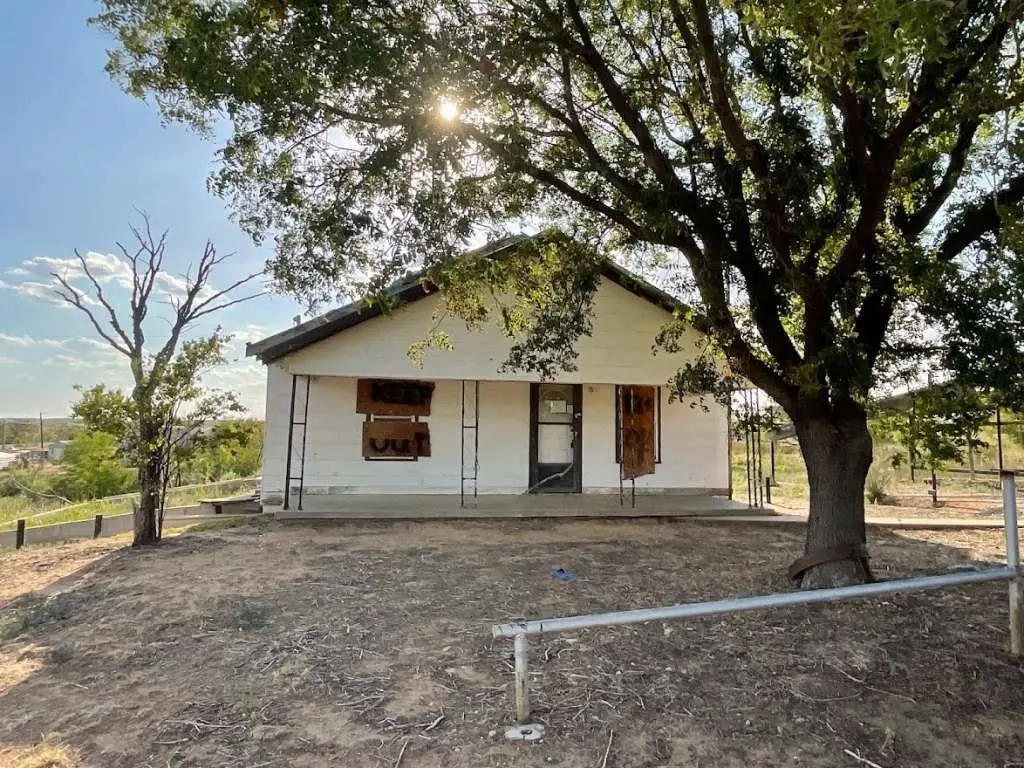
INVESTORS! Take a look at this great investment property. 104 3rd St that features two bedrooms, one bathroom and approximately 780 square feet of livable space. This home is being sold AS IS but has a lot of potential. With a little bit of work, this property can easily be transformed into an amazing home for you or as a rental investment. It is located at the top of a hill and close to the canyon for you to enjoy all that nature has to offer. Meredith River and a number of nearby amenities are less than 20 minutes from this property. WE MAKE IT EASY TO OWN. This is a great opportunity! Don't wait, call us today to get more information on the owner's easy terms and smooth process that may be able to put the deed in your name and make this your dream property.
Key facts
- Nearby amenities
- Close to the canyon
- Top of a hill
Tags
Neighborhood map
What this means for you Summary
Snapshot
- This is a 2-bed/1.0-bath single-family listed at $25k.
Deal economics
- At list price, monthly cash flow is $487 ($6k/yr) — positive.
- The deal already cash-flows at list — no discount required.
- Meets the 1% rule at list price ($835 rent vs $25k).
- Recommended offer: $22k (12.0% below list) — sets the bar for market timing.
Location & tenants
- Location reads 54/100 on livability (#1,402 in TX) — a working-class tenant base; expect higher turnover. Strengths: cost of living A+, housing A+; Watch: schools F, crime F, amenities F.
- Plemons-Stinnett-Phillips CISD (rural): math 38% / reading 44% proficiency, ranked #377 of 826 in TX (top 46%) — families likely to look elsewhere, expect single-tenant / working-renter base with shorter leases.
- Market conditions: 2 active listings in the ZIP; 2 units permitted in Hutchinson County in 2024 (0 in 5+ unit buildings).
Forward outlook
- In year one you build about $923 of equity ($173 loan paydown + $750 appreciation (3.0% local appreciation)).
- At projected returns (3.0% appreciation + 3.0% rent growth), your $7k cash investment doubles in ~2 years — after that, you're playing with house money.
Negotiation context
- It's been on market 304 days — a 12% lower offer ($22k) is reasonable based on typical stale-listing flexibility.
- 2 sale attempts since 3y ago; this cycle's ask has dropped $3k (12%) from the opening price — seller is motivated, your offer sets the floor, not the list.
Risks & watch-outs
- Watch-outs: built in 1948 — expect roof / HVAC / electrical / plumbing capex.
- Climate carrying-cost: severe wildfire risk; extreme-heat days projected 7→19/yr by 2055 (HVAC capex compounding) — expect insurance premiums to compound above CPI over the hold.
Questions for the listing agent
- It's been on market 304 days. Have you received any prior offers? Is the seller open to a 12% concession, seller financing, or rate buy-down credit?
- Built in 1948 — when were the roof, HVAC, electrical panel, plumbing, and water heater last replaced?
- Why hasn't it sold? Are there any deal-killer items the seller is aware of (foundation, flood, title, zoning, code violations)?
- Is there a deadline driving the sale (1031 exchange, divorce, estate, relocation)? That informs how much negotiation room exists.
- Schools are F-rated, which usually means shorter tenancies and higher turnover. Who's the typical renter profile here, and what's been the actual vacancy rate?
- Crime grade is F in this area — have there been break-ins, vandalism, or insurance claims at this property in the last 3 years? What carrier currently insures it and at what premium?
- What's the average days-on-market for RENTAL listings here right now (not sales)? A rising rental-DOM trend means longer vacancies and softer asking-rent achievability than the comps imply.
- What's the recent tenant-quality profile in this submarket — average credit score on applications, eviction rate, late-payment / NSF rate, and stable-employment percentage? A property-management company in the area should have these aggregated.
- How much new for-sale + rental construction is in the pipeline within 1–3 miles? Heavy new supply typically softens prices + rents 12–24 months out; constrained supply supports both.
Investment metrics
- 1% rule
- 3.34% ✓
- Cap rate
- 29.66%
- Cash-on-cash
- 83.45%
- DSCR
- 4.71
- GRM
- 2.5
CMA / ARV
No comps found within radius.
Projected returns pro-forma
3.0% appreciation · 3.0% rent growth · sell at horizon
- IRR
- 87.8%
- Equity multiple
- 5.86×
- Total profit
- $34,026
- Equity at exit
- $11,241
- IRR
- 87.4%
- Equity multiple
- 12.10×
- Total profit
- $77,703
- Equity at exit
- $17,323
Cash invested: $7,000 (down + closing). Projections, not guarantees.
Landlord ↔ Tenant lean methodology
- Overall (STATE)
- 87 Strongly Landlord-Friendly
- State Texas
- 87 Strongly Landlord-Friendly · R+5
- County
- — inherits STATE
- City
- — inherits STATE
ZIP-level market 79078
- Active inventory
- 2
- Price-to-rent
- 2.5×
Monthly cashflow live
- Estimated rent
- $835 medium interval (Pro) →
- Mortgage (P&I)
- −$131
- Tax est. 1.5%
- −$31 /mo · $375/yr
- Insurance
- −$10
- HOA
- −$0
- Vacancy / Maint / Mgmt
- −$175
- Net cashflow
- $487
Break-even live
UW: 25.0% down · 7.5% · 30yr · 1.5% tax · 5.0% vac · 8.0% maint · 8.0% mgmt
Financing live
Cash to close
- Down payment
- $6,250
- Closing costs
- $750
- Reserves months
- —
- Total cash needed
- —
Loan-product check · same deal, 3 products live
Conventional
25% down · 7.5% · 30yr
- Down + closing
- —
- Monthly P&I
- —
- Monthly cashflow
- —
- DSCR
- —
- Eligible?
- —
Personal DTI + credit; lowest rate.
DSCR
20% down · 8.5% · 30yr
- Down + closing
- —
- Monthly P&I
- —
- Monthly cashflow
- —
- DSCR
- —
- Eligible?
- —
No personal income docs; deal must DSCR.
Hard money
10% down · 12.0% · 12mo
- Down + closing
- —
- Monthly P&I
- —
- Monthly cashflow
- —
- DSCR
- —
- Eligible?
- —
Short-term bridge; refi at stabilization.
Listing history 26 events
-
2026-06-18days on market $24,999 Active 304 DOM
-
2026-06-17days on market $24,999 Active 303 DOM
-
2026-06-16days on market $24,999 Active 302 DOM
-
2026-06-15days on market $24,999 Active 301 DOM
-
2026-06-15days on market $24,999 Active 300 DOM
-
2026-06-13days on market $24,999 Active 299 DOM
-
2026-06-12days on market $24,999 Active 298 DOM
-
2026-06-09days on market $24,999 Active 295 DOM
-
2026-06-08days on market $24,999 Active 294 DOM
-
2026-06-08days on market $24,999 Active 293 DOM
-
2026-06-05days on market $24,999 Active 291 DOM
-
2026-06-03days on market $24,999 Active 289 DOM
-
2026-06-02days on market $24,999 Active 288 DOM
-
2026-06-01days on market $24,999 Active 287 DOM
-
2026-05-31days on market $24,999 Active 286 DOM
-
2025-09-26price $24,999 770-char remark
Show marketing remark (770 chars)
INVESTORS! Take a look at this great investment property. 104 3rd St that features two bedrooms, one bathroom and approximately 780 square feet of livable space. This home is being sold AS IS but has a lot of potential. With a little bit of work, this property can easily be transformed into an amazing home for you or as a rental investment. It is located at the top of a hill and close to the canyon for you to enjoy all that nature has to offer. Meredith River and a number of nearby amenities are less than 20 minutes from this property. WE MAKE IT EASY TO OWN. This is a great opportunity! Don't wait, call us today to get more information on the owner's easy terms and smooth process that may be able to put the deed in your name and make this your dream property.
-
2025-08-18$28,248 Active 770-char remark
Show marketing remark (770 chars)
INVESTORS! Take a look at this great investment property. 104 3rd St that features two bedrooms, one bathroom and approximately 780 square feet of livable space. This home is being sold AS IS but has a lot of potential. With a little bit of work, this property can easily be transformed into an amazing home for you or as a rental investment. It is located at the top of a hill and close to the canyon for you to enjoy all that nature has to offer. Meredith River and a number of nearby amenities are less than 20 minutes from this property. WE MAKE IT EASY TO OWN. This is a great opportunity! Don't wait, call us today to get more information on the owner's easy terms and smooth process that may be able to put the deed in your name and make this your dream property.
-
2024-06-14historical
-
2023-06-14$29,122 Active
-
1995-12-21soldstatus
-
1990-11-15soldstatus
-
1990-04-30soldstatus
-
1990-04-17soldstatus
-
1984-06-08soldstatus
-
1982-04-13soldstatus
-
1982-04-13soldstatus
ⓘ Source: listings_history table (triggers on properties + properties_extension) + one-shot
backfill from property_details.listing_events for pre-trigger history.
Climate risk First Street
- Flood 1/10 Low 0% chance over 30 yrs
- Wildfire 10/10 Extreme
- Heat 6/10 Major 7 d/yr ≥100°F today · 19 d/yr by 30 yrs out
- Wind 2/10 Low
- Air quality 2/10 Low 1 unhealthy d/yr today · 1 by 30 yrs out
Nearby sold comps map
Loading sold comps map…
Walkable amenities ~0.75 mi
Loading nearby amenities…
Taxation est. · year 1
- Rental income
- $10,018
- − Mortgage interest
- −$1,400
- − Property taxes
- −$375
- − Insurance
- −$125
- − Repairs & maintenance
- −$801
- − Management
- −$801
- − Depreciation
- −$727
- Taxable income
- $5,788
- Est. tax owed @ 24.0%
- −$1,389
- After-tax cash flow
- $4,452/yr
For passive investors: Depreciation is non-cash, so a rental often shows a tax loss while cash-flowing — sheltering income. Rental losses are passive: they offset passive income freely, and up to $25,000/yr can offset ordinary (W-2) income if you actively participate and your MAGI is under $100k (phasing out to $0 by $150k); unused losses carry forward. On sale, claimed depreciation is recaptured at up to 25%, and gains may owe capital-gains tax (a 1031 exchange can defer both). Figures are a year-1 estimate at your 24.0% rate — not tax advice; consult a CPA.
Schools (NCES district)
- District
- Plemons-Stinnett-Phillips CISD
- NCES district ID
- 4841580
- Math proficiency
- 38% ▼ -15.00%
- Reading proficiency
- 44% ▼ -2.00%
- Median HH income
- $46,689
- Composite
- 34.99/100
- National rank
- #5053
- State rank
- #377 of 826 in TX
Livability — Sanford
- Score
- 54/100
- State rank
- #1402
- US rank
- #24039
Category grades
Schools grade is shown separately in the Schools card above.
Census & demographics
- Population (ZIP)
- 153
Population outlook (Hutchinson County) Hauer SSP2
- Today (2025)
- 21,274 people
- By 2030
- 21,089 · -0.9%
- By 2040
- 20,938 · -1.6%
- By 2050
- 20,999 · -1.3%
- By 2075
- 21,433 · +0.7%
- By 2100
- 21,243 · -0.1%
Race, ethnicity, and origin ACS 2023
- Neighborhood character
- Predominantly White (86%)
- Race & ethnicity
- White 86% Hispanic / Latino 11% Two or more races 11% Native American 3%
- Hispanic origin (detail)
- Cuban 2%
- Common ancestry
- Serbian 5% Slovak 1%
Political lean MEDSL · Hutchinson
- 2024 margin
- Solid R (+77.2) · D 11.1% · R 88.2%
- 2008→2024 swing
- -8.2pp toward R · 2008: -68.9pp · 2024: -77.2pp
- All cycles
- 2024: R+77.2 2020: R+76.6 2016: R+76.1 2012: R+72.7 2008: R+68.9
Not yet ingested
- Civics
- —
Market trends
- HPI YoY
- —
- Current HPI
- —
- Rent YoY
- —
- Metro
- —
- State GDP YoY
- ▲ 3.95%
- F500 in state
- 110
Industry mix (Fortune 500 HQ in TX)
| Industry | F500 HQs | Revenue |
|---|---|---|
| Energy | 16 | $1,198B |
|
||
| Technology | 5 | $198B |
|
||
| Engineering / Construction | 4 | $72B |
|
||
| Energy Services | 3 | $60B |
|
||
| Utilities | 3 | $41B |
|
||
| Healthcare | 2 | $330B |
|
||
Price history
-14.2% since first listed11 events — show timeline
- 2025-09-26 Price Changed $24,999 HARMLS
- 2025-08-18 Listed $28,248 HARMLS
- 2024-06-14 Listing Removed — HARMLS
- 2023-06-14 Listed $29,122 HARMLS
- 1995-12-21 Sold (Public Records) — Public Records
- 1990-11-15 Sold (Public Records) — Public Records
- 1990-04-30 Sold (Public Records) — Public Records
- 1990-04-17 Sold (Public Records) — Public Records
- 1984-06-08 Sold (Public Records) — Public Records
- 1982-04-13 Sold (Public Records) — Public Records
- 1982-04-13 Sold (Public Records) — Public Records
Property tax history
-15.1%/yrLatest (2025): $35 · -1.8% YoY. Source: county tax records.
Cash-flow waterfall
monthlySold comps — $/sqft
last 12 mo · ≤1 miLoading sold comps…