 Triplex
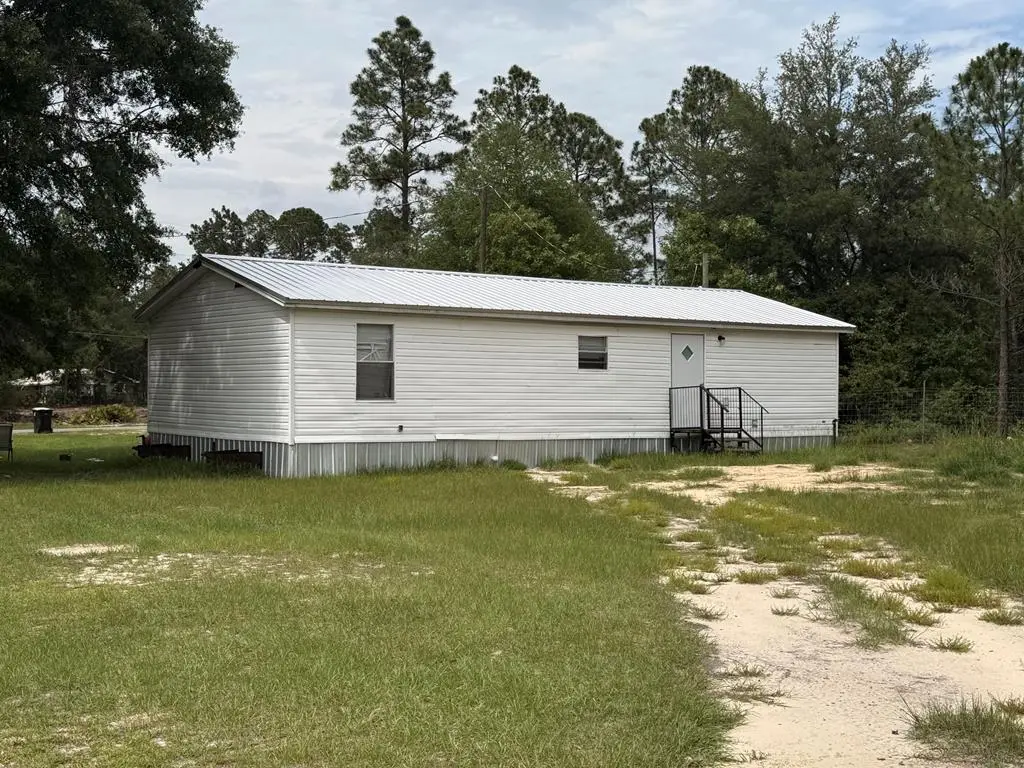
401 Dead Oak Rd - 4 Units Rd #4 · Douglas, GA
Flood risk 1/10 · Minimal
- FEMA flood zone
- X (unshaded)
- Chance of flooding over 30 yrs
- 0.0%
- Est. flood insurance / yr
- $507 – $1,088
Fire risk 6/10 · Moderate
- Est. fire insurance / yr
- $963 – $1,789
Heat risk 8/10 · Major
- Hot days now (above 108°F)
- 7 days/yr
- Hot days in 30 yrs
- 20 days/yr
Wind risk 8/10 · Major
- Chance of severe wind over 30 yrs
- 98.0%
Air-quality risk 3/10 · Minor
- Unhealthy air days now
- 2 days/yr
- Unhealthy air days in 30 yrs
- 4 days/yr
Risk factors via First Street. Map © Google.
Why this score? — see what drove the C+ grade
The composite is a weighted blend of 9 inputs, each scored 0–100. Each bar is that input's sub-score; the figure is the points it added to the 100-point composite (weight × sub-score).
- Cash flow +27.4/30.0
- DSCR +9.6/10.0
- ARV discount +7.5/15.0
- 1% rule +7.4/10.0
- Condition / age +3.8/5.0
- Livability +3.2/5.0
- Rent growth +2.5/5.0
- Schools +2.4/10.0
- Appreciation +0.0/10.0
$330,000
🖨 Deal sheet 📄 Offer letter ✓ Due diligence
Multi-family units
County records classify this as Multi-Family (2-4 Unit). Listing-text estimate: 3 units. confirmed
Listing remarks
Strong cash flow and significant upside potential highlight this 4-unit mobile home portfolio in Douglas, Georgia. The portfolio consists of two 3BR/2BA homes and two 2BR/2BA homes, with three homes located together on a single parcel at the end of a cul-de-sac and the fourth just a short distance away. Current rents are $850, $750, $1,100, and $575 per month, providing immediate income while still offering upside. Market rents support approximately $950 per unit, creating a clear path to increased cash flow through rent optimization. All homes have been renovated and feature central heating and air conditioning, new metal roofs, and little-to-no deferred maintenance. Each unit is individua
Key facts
- Cul de sac location
- Renovated homes
- New metal roofs
Tags
Property features AI
Finance
- Other: Subdivision: HICKORY RIDGE
- Financial info: Annual tax amount listed
Exterior
- Utilities: Public water; Septic tank sewer
- Home design: Multi-family residential property; Multi-unit; Single-story
- Construction: Metal siding construction; Metal roof
- Exterior features: Metal roof; Metal siding; Approximately 3.3 acres; Zoned R
Neighborhood map
What this means for you Summary
Snapshot
- This is a 3 × 3-bed/?-bath units multifamily listed at $330k. Condition is rated good.
Deal economics
- At list price, monthly cash flow is $964 ($12k/yr) — positive. Per door: $321/mo.
- The deal already cash-flows at list — no discount required.
- Meets the 1% rule at list price ($4k rent vs $330k).
- Recommended offer: $325k (1.5% below list) — sets the bar for market timing.
- Cap rate 9.8% vs local median 4.7% in Douglas — top-decile yield for the area; either an underpriced asset or a hidden risk that comps aren't pricing in. Stress-test before assuming the spread holds.
Location & tenants
- Location reads 64/100 on livability (#252 in GA) — a middle-class / working-renter tenant base. Strengths: cost of living A+, housing A; Watch: health & safety C-, crime D, schools F.
- Coffee County (rural): math 28% / reading 31% proficiency, ranked #99 of 174 in GA (top 57%) — low school quality limits family demand, transient renter base, plan for 1-2y turnover; 66% free/reduced lunch — lower-income household profile, screen leases tightly.
- Market conditions: 31 active listings in the ZIP; 110 units permitted in Coffee County in 2024 (6 in 5+ unit buildings).
Forward outlook
- Local home prices are declining (-3.0%/yr); year-one equity from $2k of loan paydown is wiped out by about $10k of value loss. Plan a longer hold.
- Coffee County population projected to shrink 4% by 2050 — rents likely to lag national; underwrite the cash flow, not the appreciation.
- At projected returns (-3.0% appreciation + 3.0% rent growth), your $92k cash investment doubles in ~10 years — after that, you're playing with house money.
Negotiation context
- It's been on market 16 days — a 2% lower offer ($325k) is reasonable based on typical stale-listing flexibility.
Risks & watch-outs
- Climate carrying-cost: severe wind risk, 98% chance of damaging wind over 30y; major wildfire risk; extreme-heat days projected 7→20/yr by 2055 (HVAC capex compounding) — expect insurance premiums to compound above CPI over the hold.
Questions for the listing agent
- Can we see the unit-by-unit rent roll, current vacancy, and any below-market leases? What's the average tenancy length?
- What capital expenditures (roof, boiler, parking lot, exteriors) have been made in the last 5 years, and what's planned in the next 2?
- Is there a deadline driving the sale (1031 exchange, divorce, estate, relocation)? That informs how much negotiation room exists.
- Schools are F-rated, which usually means shorter tenancies and higher turnover. Who's the typical renter profile here, and what's been the actual vacancy rate?
- Crime grade is D in this area — have there been break-ins, vandalism, or insurance claims at this property in the last 3 years? What carrier currently insures it and at what premium?
- What's the average days-on-market for RENTAL listings here right now (not sales)? A rising rental-DOM trend means longer vacancies and softer asking-rent achievability than the comps imply.
- What's the recent tenant-quality profile in this submarket — average credit score on applications, eviction rate, late-payment / NSF rate, and stable-employment percentage? A property-management company in the area should have these aggregated.
- How much new apartment / multifamily construction is in the pipeline within 1–3 miles? Heavy new supply (>2% of stock underway) typically softens rents 12–24 months out; light construction supports rent growth.
Investment metrics
- 1% rule
- 1.24% ✓
- Cap rate
- 9.80%
- Cash-on-cash
- 12.52%
- DSCR
- 1.56
- GRM
- 6.7
CMA / ARV
No comps found within radius.
Projected returns pro-forma
-3.0% appreciation · 3.0% rent growth · sell at horizon
- IRR
- 2.3%
- Equity multiple
- 1.09×
- Total profit
- $7,984
- Equity at exit
- $49,204
- IRR
- 11.8%
- Equity multiple
- 1.93×
- Total profit
- $86,261
- Equity at exit
- $28,532
Cash invested: $92,400 (down + closing). Projections, not guarantees.
Landlord ↔ Tenant lean methodology
- Overall (STATE)
- 90 Strongly Landlord-Friendly
- State Georgia
- 90 Strongly Landlord-Friendly · R+3
- County
- — inherits STATE
- City
- — inherits STATE
ZIP-level market 31533
- Home prices YoY
- -21.6%
- Active inventory
- 31
- Price-to-rent
- 20.1×
Monthly cashflow live
- Estimated rent
- $4,107 medium interval (Pro) →
- Mortgage (P&I)
- −$1,731
- Tax est. 1.5%
- −$412 /mo · $4,950/yr
- Insurance
- −$138
- HOA
- −$0
- Vacancy / Maint / Mgmt
- −$862
- Net cashflow
- $964
Break-even live
3-unit breakdown (identical units grouped — click to expand)
| Units | Beds | Baths | Est. rent |
|---|---|---|---|
| 3× units | 3 | — | $4,107 |
| #1 | 3 | — | $1,369 |
| #2 | 3 | — | $1,369 |
| #3 | 3 | — | $1,369 |
| Total (3 units) | $4,107 | ||
UW: 25.0% down · 7.5% · 30yr · 1.5% tax · 5.0% vac · 8.0% maint · 8.0% mgmt
Financing live
Cash to close
- Down payment
- $82,500
- Closing costs
- $9,900
- Reserves months
- —
- Total cash needed
- —
Loan-product check · same deal, 3 products live
Conventional
25% down · 7.5% · 30yr
- Down + closing
- —
- Monthly P&I
- —
- Monthly cashflow
- —
- DSCR
- —
- Eligible?
- —
Personal DTI + credit; lowest rate.
DSCR
20% down · 8.5% · 30yr
- Down + closing
- —
- Monthly P&I
- —
- Monthly cashflow
- —
- DSCR
- —
- Eligible?
- —
No personal income docs; deal must DSCR.
Hard money
10% down · 12.0% · 12mo
- Down + closing
- —
- Monthly P&I
- —
- Monthly cashflow
- —
- DSCR
- —
- Eligible?
- —
Short-term bridge; refi at stabilization.
Listing history 12 events
-
2026-06-18days on market $330,000 Active 16 DOM
-
2026-06-17days on market $330,000 Active 15 DOM
-
2026-06-16days on market $330,000 Active 14 DOM
-
2026-06-15days on market $330,000 Active 13 DOM
-
2026-06-13days on market $330,000 Active 11 DOM
-
2026-06-12days on market $330,000 Active 10 DOM
-
2026-06-09days on market $330,000 Active 7 DOM
-
2026-06-08days on market $330,000 Active 6 DOM
-
2026-06-07days on market $330,000 Active 5 DOM
-
2026-06-07days on market $330,000 Active 4 DOM
-
2026-06-03remarks 699-char remark
-
2026-06-03$330,000 Active 1 DOM
ⓘ Source: listings_history table (triggers on properties + properties_extension) + one-shot
backfill from property_details.listing_events for pre-trigger history.
Climate risk First Street
- Flood 1/10 Low FEMA zone X (unshaded) · 0% chance over 30 yrs
- Wildfire 6/10 Major
- Heat 8/10 Severe 7 d/yr ≥108°F today · 20 d/yr by 30 yrs out
- Wind 8/10 Severe 98% chance of damaging wind over 30 yrs
- Air quality 3/10 Moderate 2 unhealthy d/yr today · 4 by 30 yrs out
Nearby sold comps map
Loading sold comps map…
Walkable amenities ~0.75 mi
Loading nearby amenities…
Taxation est. · year 1
- Rental income
- $49,284
- − Mortgage interest
- −$18,485
- − Property taxes
- −$4,950
- − Insurance
- −$1,650
- − Repairs & maintenance
- −$3,943
- − Management
- −$3,943
- − Depreciation
- −$9,600
- Taxable income
- $6,713
- Est. tax owed @ 24.0%
- −$1,611
- After-tax cash flow
- $9,956/yr
For passive investors: Depreciation is non-cash, so a rental often shows a tax loss while cash-flowing — sheltering income. Rental losses are passive: they offset passive income freely, and up to $25,000/yr can offset ordinary (W-2) income if you actively participate and your MAGI is under $100k (phasing out to $0 by $150k); unused losses carry forward. On sale, claimed depreciation is recaptured at up to 25%, and gains may owe capital-gains tax (a 1031 exchange can defer both). Figures are a year-1 estimate at your 24.0% rate — not tax advice; consult a CPA.
Condition & rehab AI · 5 photos
This multi-family property is in good condition with minimal repairs needed. Landscaping and exterior painting would significantly enhance its curb appeal and value.
Value-add opportunities
- Both Landscaping improvements — Enhances curb appeal and could attract more tenants.
- Both Painting exterior — Fresh paint can improve the home's appearance and value.
- Both Landscaping and curb appeal — Improves the home's overall appearance and could attract more tenants and buyers.
Renovation cost estimate screening
Value-add ROI direction
- Both Landscaping improvements — Enhances curb appeal and could attract more tenants. ↑
- Both Painting exterior — Fresh paint can improve the home's appearance and value. ↑
- Both Landscaping and curb appeal — Improves the home's overall appearance and could attract more tenants and buyers. ↑
ⓘ Cost ranges are severity-bucket heuristics (US national rule-of-thumb). Get contractor quotes + a written scope before underwriting a rehab budget.
Schools (NCES district)
- District
- Coffee County
- NCES district ID
- 1301350
- Math proficiency
- 28% ▼ -12.00%
- Reading proficiency
- 31% ▼ -8.00%
- Median HH income
- $35,068
- Composite
- 24.36/100
- National rank
- #7693
- State rank
- #99 of 174 in GA
Livability — Douglas
- Score
- 64/100
- State rank
- #252
- US rank
- #14074
Category grades
Schools grade is shown separately in the Schools card above.
Census & demographics
- Population (ZIP)
- 17,464
Population outlook (Coffee County) Hauer SSP2
- Today (2025)
- 43,255 people
- By 2030
- 43,007 · -0.6%
- By 2040
- 42,337 · -2.1%
- By 2050
- 41,505 · -4.0%
- By 2075
- 39,695 · -8.2%
- By 2100
- 36,090 · -16.6%
Race, ethnicity, and origin ACS 2023
- Neighborhood character
- Diverse neighborhood (Simpson 0.63)
- Race & ethnicity
- White 48% Black 34% Hispanic / Latino 15% Two or more races 11%
- Hispanic origin (detail)
- Mexican 12%
- Common ancestry
- Slovak 2% Lithuanian 1% Serbian 1%
- Foreign-born
- 9% · Canada
- Languages at home
- 85% English-only · Spanish 14% Other Indo-European 1%
Political lean MEDSL · Coffee
- 2024 margin
- Solid R (+45.1) · D 27.3% · R 72.5%
- 2008→2024 swing
- -15.6pp toward R · 2008: -29.5pp · 2024: -45.1pp
- All cycles
- 2024: R+45.1 2020: R+39.9 2016: R+39.5 2012: R+29.1 2008: R+29.5
Not yet ingested
- Civics
- —
Market trends
- HPI YoY
- ▼ -51.34%
- Current HPI
- 186.6264
- Rent YoY
- —
- Metro
- —
- State GDP YoY
- ▲ 2.66%
- F500 in state
- 28
Industry mix (Fortune 500 HQ in GA)
| Industry | F500 HQs | Revenue |
|---|---|---|
| Paper / Packaging | 2 | $29B |
|
||
| Retail | 1 | $160B |
|
||
| Transportation / Logistics | 1 | $91B |
|
||
| Airlines | 1 | $62B |
|
||
| Consumer Goods | 1 | $47B |
|
||
| Utilities | 1 | $25B |
|
||
Price history
1 event — show timeline
- 2026-06-02 Listed $330,000 SGMLS
Cash-flow waterfall
monthlySold comps — $/sqft
last 12 mo · ≤1 miLoading sold comps…