None · Lehigh Acres, FL
Flood risk 1/10 · Minimal
- FEMA flood zone
- X (unshaded)
- Chance of flooding over 30 yrs
- 0.0%
- Est. flood insurance / yr
- $507 – $1,088
Fire risk 3/10 · Minor
- Est. fire insurance / yr
- $947 – $1,759
Heat risk 10/10 · Severe
- Hot days now (above 108°F)
- 7 days/yr
- Hot days in 30 yrs
- 28 days/yr
Wind risk 10/10 · Severe
- Chance of severe wind over 30 yrs
- 99.0%
Air-quality risk 2/10 · Minimal
- Unhealthy air days now
- 1 days/yr
- Unhealthy air days in 30 yrs
- 2 days/yr
Risk factors via First Street. Map © Google.
Why this score? — see what drove the D- grade
The composite is a weighted blend of 9 inputs, each scored 0–100. Each bar is that input's sub-score; the figure is the points it added to the 100-point composite (weight × sub-score).
- Appreciation +10.0/10.0
- Cash flow +7.5/30.0
- ARV discount +4.6/15.0
- Schools +4.1/10.0
- Livability +3.0/5.0
- Condition / age +2.5/5.0
- 1% rule +1.9/10.0
- DSCR +1.7/10.0
- Rent growth +1.3/5.0
$295,000
🖨 Deal sheet 📄 Offer letter ✓ Due diligence
Listing remarks MLS
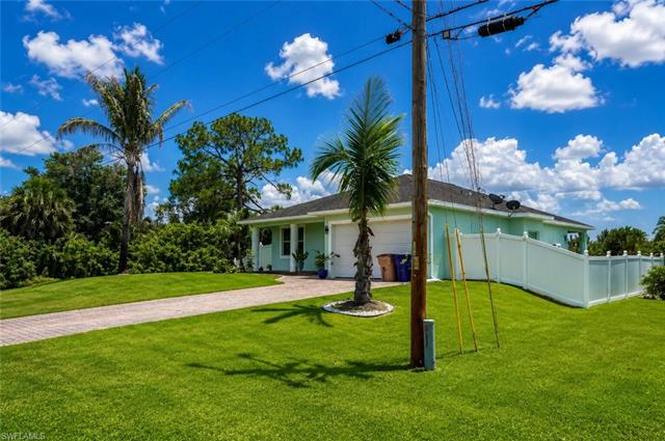
This beautiful home boast 10ft ceilings, crown molding, solid counter tops, upgraded cabinets, wood floors, Privacy fencing, brick driveway, separate tub and shower, walk in closets, and a large back porch with a view of the majestic golf course, without the HOA. It doesn't stop there, the roof was replaced in 2018 and the seller had the interior freshly painted and new plants and mulch installed just before putting on the market for an immediate move in. To ensure you love your new home, just before closing, we will have the home professionally cleaned. This is a one of a kind, don't let this one pass you by.
Key facts
- Paver driveway
- Remodeled bathrooms
- 0.27 acre lot
Tags
Property features AI
Finance
- Other: Zoning: RS-1; Subdivision: Lehigh Acres (Subdivision #26); Lot dimensions approx. 81' x 153' x 81' x 153' (total area 0.2736 acres); 1 unit in building
- HOA & community: No HOA maintenance or community amenities; Community type: see remarks
Exterior
- Parking: Attached 2-car garage
- Utilities: Septic sewer; Partial reverse osmosis water; Central electric cooling; Cable available
- Home design: Single-family residential; One story; Rear exposure faces East; Built in 2008
- Construction: Concrete block construction; Shingle roof; Previously appraised lot dimensions
- Exterior features: Room for a pool; Stucco exterior; Windows: see remarks; Regular lot
Interior
- Kitchen: Microwave
- Bedrooms: 3 bedrooms
- Flooring: Tile flooring
- Bathrooms: 2 full bathrooms; No master bath
- Heating & cooling: Central electric cooling
- Interior features: Den / study; Family room; Open porch / lanai; Split bedroom floor plan; Microwave included; Unfurnished
- Laundry & utility: Laundry in residence; Partial reverse osmosis water system
Neighborhood map
What this means for you Summary
Snapshot
- This is a 3-bed/2.0-bath single-family listed at $295k.
Deal economics
- At list price, monthly cash flow is $-362 ($-4k/yr) — negative.
- To cash-flow at today's rent, offer at most $231k (21.7% below list).
- To meet the 1% rule (rent ≥ 1% of price), the offer needs to be $202k (31.4% below list).
- Recommended offer: $202k (31.4% below list) — sets the bar for 1% rule.
Location & tenants
- Location reads 59/100 on livability (#826 in FL) — a working-class tenant base; expect higher turnover. Strengths: cost of living A+, housing A+; Watch: crime C-, employment D+, schools D-.
- Lee (suburban): math 47% / reading 50% proficiency, ranked #42 of 73 in FL (top 58%) — families likely to look elsewhere, expect single-tenant / working-renter base with shorter leases.
- Market conditions: Rents falling (-4.7%/yr); 2460 active listings in the ZIP; 40 comparable units currently listed for rent nearby; rentals at typical pace (median 21d on market — plan ~3-4 weeks tenant-placement turnaround); 15,411 units permitted in Lee County in 2024 (4,686 in 5+ unit buildings).
- This rent runs 34% of the median local income ($72k/yr) — at the standard rent-burdened threshold; future hikes will face affordability resistance.
Forward outlook
- In year one you build about $32k of equity ($2k loan paydown + $30k appreciation (10.0% local appreciation)).
- Lee County population projected at +44% by 2050 — long-run rental-demand tailwind backs the buy-and-hold thesis.
- By year 2, paydown + projected appreciation supports a ~$51k cash-out refi (75% LTV) — recoverable capital for the next deal without selling this one.
Negotiation context
- Only 4 days on market — expect competitive offers; lowballing is unlikely to land.
- 3 sale attempts since 11y ago with the ask held roughly flat each time — persistent listings suggest the price (not the market) is what's stuck; bring a comps-based counter.
- Current owner paid $180k; list at $295k implies a 64% gain — meaningful room to come down on a strong offer.
Risks & watch-outs
- Climate carrying-cost: severe wind risk, 99% chance of damaging wind over 30y; extreme-heat days projected 7→28/yr by 2055 (HVAC capex compounding) — expect insurance premiums to compound above CPI over the hold.
Questions for the listing agent
- What do current leases actually rent for vs. the listed asking? Can we see a recent rent roll and the last 12 months of T-12 income?
- Is there a deadline driving the sale (1031 exchange, divorce, estate, relocation)? That informs how much negotiation room exists.
- Schools are D-rated, which usually means shorter tenancies and higher turnover. Who's the typical renter profile here, and what's been the actual vacancy rate?
- The area grade is low — what's the realistic commute time and amenity access for the typical tenant pool here? Any planned neighborhood developments (good or bad) we should know about?
- What's the average days-on-market for RENTAL listings here right now (not sales)? A rising rental-DOM trend means longer vacancies and softer asking-rent achievability than the comps imply.
- What's the recent tenant-quality profile in this submarket — average credit score on applications, eviction rate, late-payment / NSF rate, and stable-employment percentage? A property-management company in the area should have these aggregated.
- How much new for-sale + rental construction is in the pipeline within 1–3 miles? Heavy new supply typically softens prices + rents 12–24 months out; constrained supply supports both.
Investment metrics
- 1% rule
- 0.69% ✗
- Cap rate
- 4.82%
- Cash-on-cash
- -5.26%
- DSCR
- 0.77
- GRM
- 12.1
CMA / ARV
- ARV (on-the-fly)
- $277,315
- Comps found
- 12
Show comp detail 12 sales within ~0.75 mi
| Address | Dist | Beds/Ba | Sqft | Sold | Price | $/sf | Match |
|---|---|---|---|---|---|---|---|
| 352 Rawlings Ave | 0.10mi | 3/2.5 | 1,500 (+0%) | 6mo | $285,000 | $190 | 89 |
| 19993 Lake Vista Cir N | 0.24mi | 3/2.0 | 1,540 (+3%) | 2mo | $250,000 | $162 | 83 |
| 398 Radiant Sun Ln | 0.37mi | 4/2.0 (+1) | 1,499 (0%) | 5mo | $276,999 | $185 | 74 |
| 536 Ilaria Ct | 0.31mi | 3/2.0 | 1,328 (-11%) | 1mo | $252,200 | $190 | 66 |
| 11933 Savanna Lakes Blvd | 0.64mi | 3/2.0 | 1,487 (-1%) | 4mo | $245,000 | $165 | 65 |
| 11901 Savanna Lakes Blvd | 0.67mi | 3/2.0 | 1,487 (-1%) | 3mo | $255,597 | $172 | 65 |
| 11917 Savanna Lakes Blvd | 0.65mi | 3/2.0 | 1,487 (-1%) | 4mo | $254,000 | $171 | 65 |
| 356 Progress Ave | 0.43mi | 3/2.0 | 1,629 (+9%) | 2mo | $365,000 | $224 | 64 |
| 426 Progress Ave | 0.58mi | 3/2.0 | 1,408 (-6%) | 2mo | $250,000 | $178 | 61 |
| 414 Pinehurst Ave | 0.57mi | 3/2.0 | 1,629 (+9%) | 3mo | $365,000 | $224 | 57 |
| 416 Piper Ave | 0.67mi | 3/2.5 | 1,569 (+5%) | 5mo | $350,000 | $223 | 55 |
| 11905 Savanna Lakes Blvd | 0.73mi | 3/2.0 | 1,343 (-10%) | 5mo | $230,000 | $171 | 45 |
Match score weights: distance 35% · size 25% · config 20% · recency 20%. Top-matched comps best support the ARV.
Projected returns pro-forma
10.0% appreciation · 0.0% rent growth · sell at horizon
- IRR
- 19.8%
- Equity multiple
- 2.59×
- Total profit
- $131,636
- Equity at exit
- $265,759
- IRR
- 17.6%
- Equity multiple
- 5.78×
- Total profit
- $395,136
- Equity at exit
- $573,120
Cash invested: $82,600 (down + closing). Projections, not guarantees.
Landlord ↔ Tenant lean methodology
- Overall (STATE)
- 87 Strongly Landlord-Friendly
- State Florida
- 87 Strongly Landlord-Friendly · R+3
- County
- — inherits STATE
- City
- — inherits STATE
ZIP-level market 33974
- Home prices YoY
- 5.8%
- Rents YoY
- -4.7%
- Active inventory
- 2460
- Price-to-rent
- 12.1×
Monthly cashflow live
- Estimated rent
- $2,025 high interval (Pro) →
- Mortgage (P&I)
- −$1,547
- Tax from tax record
- −$292 /mo · $3,504/yr
- Insurance
- −$123
- HOA
- −$0
- Vacancy / Maint / Mgmt
- −$425
- Net cashflow
- $-362
Break-even live
UW: 25.0% down · 7.5% · 30yr · 1.5% tax · 5.0% vac · 8.0% maint · 8.0% mgmt
Financing live
Cash to close
- Down payment
- $73,750
- Closing costs
- $8,850
- Reserves months
- —
- Total cash needed
- —
Loan-product check · same deal, 3 products live
Conventional
25% down · 7.5% · 30yr
- Down + closing
- —
- Monthly P&I
- —
- Monthly cashflow
- —
- DSCR
- —
- Eligible?
- —
Personal DTI + credit; lowest rate.
DSCR
20% down · 8.5% · 30yr
- Down + closing
- —
- Monthly P&I
- —
- Monthly cashflow
- —
- DSCR
- —
- Eligible?
- —
No personal income docs; deal must DSCR.
Hard money
10% down · 12.0% · 12mo
- Down + closing
- —
- Monthly P&I
- —
- Monthly cashflow
- —
- DSCR
- —
- Eligible?
- —
Short-term bridge; refi at stabilization.
Rent comps 40 comps
| Address | Beds | Baths | Sqft | Rent | $/sqft | DOM | Units | Dist |
|---|---|---|---|---|---|---|---|---|
| 351 Ranchito Ave Lehigh Acres, FL | 3.0 | 2.5 | 1500 | $2,000 | $1.33 | 23d | 1 | 0.09mi |
| 19933 Lake Vista Cir Lehigh Acres, FL | 3.0 | 2.0 | 1776 | $1,750 | $0.99 | 19d | 1 | 0.15mi |
| 337 Rancho Ave Lehigh Acres, FL | 3.0 | 2.0 | 1723 | $2,150 | $1.25 | 23d | 1 | 0.15mi |
| 448 Reading St Lehigh Acres, FL | 3.0 | 2.0 | 1100 | $1,890 | $1.72 | 3d | 1 | 0.18mi |
| 19949 Lake Vista Cir Unit 16C Lehigh Acres, FL | 3.0 | 2.0 | 1517 | $1,600 | $1.05 | 23d | 1 | 0.19mi |
| 334 Ranch Ave Lehigh Acres, FL | 3.0 | 2.0 | 1645 | $2,150 | $1.31 | 3d | 1 | 0.19mi |
| 19949 Lake Vista Cir N #1 Lehigh Acres, FL | 3.0 | 2.0 | 1442 | $1,800 | $1.25 | 23d | 1 | 0.19mi |
| 467 Raymer St Lehigh Acres, FL | 4.0 | 2.0 | 1833 | $1,850 | $1.01 | 10d | 1 | 0.20mi |
| 437 Reading St Lehigh Acres, FL | 4.0 | 2.0 | 1833 | $1,795 | $0.98 | 2d | 1 | 0.27mi |
| 477 Rayford St Lehigh Acres, FL | 4.0 | 3.0 | 1715 | $2,000 | $1.17 | 23d | 1 | 0.28mi |
| 438 Poplar St Lehigh Acres, FL | 3.0 | 2.0 | 1640 | $2,150 | $1.31 | 3d | 1 | 0.28mi |
| 472 Rajah St Lehigh Acres, FL | 3.0 | 2.0 | 1715 | $2,200 | $1.28 | 3d | 1 | 0.29mi |
| 532 Ilaria Ct Lehigh Acres, FL | 4.0 | 2.0 | 1598 | $2,300 | $1.44 | 16d | 1 | 0.32mi |
| 20055 Lake Vista Cir N Lehigh Acres, FL | 3.0 | 2.0 | 1442 | $1,700 | $1.18 | 23d | 1 | 0.36mi |
| 463 Piedmont St Unit 463 Lehigh Acres, FL | 3.0 | 2.0 | 1200 | $1,350 | $1.12 | 3d | 1 | 0.39mi |
| 20012 Petrucka Cir N Unit D Lehigh Acres, FL | 3.0 | 2.0 | 1517 | $1,750 | $1.15 | 23d | 1 | 0.41mi |
| 448 Grant Blvd Unit 1 Lehigh Acres, FL | 3.0 | 2.0 | 1244 | $1,650 | $1.33 | 21d | 1 | 0.44mi |
| 448 Grant Blvd Unit 1 Lehigh Acres, FL | 2.0 | 2.0 | 1244 | $1,595 | $1.28 | 1d | 1 | 0.44mi |
| 448 Grant Blvd Unit 1 Lehigh Acres, FL | 2.0 | 2.0 | 1244 | $1,595 | $1.28 | 2d | 1 | 0.44mi |
| 442 Grant Blvd Lehigh Acres, FL | 3.0 | 2.0 | 1199 | $1,625 | $1.36 | 14d | 1 | 0.46mi |
| 333 Pinehurst Ave Lehigh Acres, FL | 3.0 | 2.0 | 1545 | $2,100 | $1.36 | 23d | 1 | 0.53mi |
| 19931 Green Pasture Rd Lehigh Acres, FL | 4.0 | 2.0 | 1817 | $2,248 | $1.24 | 23d | 1 | 0.61mi |
| 363 Grant Blvd Lehigh Acres, FL | 3.0 | 2.0 | 1158 | $1,700 | $1.47 | 23d | 1 | 0.66mi |
| 11918 Savanna Lakes Blvd Lehigh Acres, FL | 3.0 | 2.0 | 1484 | $2,000 | $1.35 | 23d | 1 | 0.66mi |
| 357 Grant Blvd Lehigh Acres, FL | 3.0 | 2.0 | 1200 | $1,800 | $1.50 | 16d | 1 | 0.68mi |
| 10353 Canal Brook Ln Lehigh Acres, FL | 3.0 | 2.0 | 1541 | $2,049 | $1.33 | 23d | 1 | 0.68mi |
| 10507 Crossback Ln Lehigh Acres, FL | 3.0 | 2.0 | 1672 | $1,800 | $1.08 | 23d | 1 | 0.72mi |
| 374 Compese Ave S Lehigh Acres, FL | 3.0 | 2.0 | 1200 | $1,750 | $1.46 | 16d | 1 | 0.76mi |
| 20190 Caroline Creek Pl Unit 250 Lehigh Acres, FL | 3.0 | 2.0 | 1448 | $2,200 | $1.52 | 23d | 1 | 0.77mi |
| 20190 Caroline Creek Pl Unit 250 Lehigh Acres, FL | 3.0 | 2.0 | 1448 | $1,900 | $1.31 | 3d | 1 | 0.77mi |
| 322 Poplar St Lehigh Acres, FL | 3.0 | 2.0 | 1199 | $2,000 | $1.67 | 23d | 1 | 0.78mi |
| 320 Poplar St Lehigh Acres, FL | 3.0 | 2.0 | 1223 | $1,900 | $1.55 | 19d | 1 | 0.79mi |
| 12321 Dakota Ridge Pl Lehigh Acres, FL | 3.0 | 2.0 | 1448 | $1,850 | $1.28 | 14d | 1 | 0.80mi |
| 10531 Canal Brook Ln Lehigh Acres, FL | 4.0 | 2.0 | 1828 | $2,300 | $1.26 | 16d | 1 | 0.80mi |
| 286 Justene Cir Lehigh Acres, FL | 3.0 | 2.0 | 1839 | $1,900 | $1.03 | 23d | 1 | 0.83mi |
| 506 Corinne Dr Unit 506 Lehigh Acres, FL | 3.0 | 2.0 | 1706 | $2,300 | $1.35 | 23d | 1 | 0.85mi |
| 430 Petite Ave Lehigh Acres, FL | 3.0 | 2.0 | 1189 | $1,850 | $1.56 | 14d | 1 | 0.85mi |
| 520 Creuset Ave S Lehigh Acres, FL | 2.0 | 2.0 | 1050 | $1,700 | $1.62 | 23d | 1 | 0.86mi |
| 19750 Garden Ridge Ct Lehigh Acres, FL | 4.0 | 2.5 | 1400 | $2,200 | $1.57 | 23d | 1 | 0.87mi |
| 397 Carrillon Ave S Lehigh Acres, FL | 3.0 | 2.0 | 1200 | $1,550 | $1.29 | 3d | 1 | 0.87mi |
Listing history 5 events
-
2026-06-18days on market $295,000 Active 4 DOM
-
2026-06-17days on market $295,000 Active 3 DOM
-
2026-06-16days on market $295,000 Active 2 DOM
-
2026-06-15remarks 699-char remark
-
2026-06-15$295,000 Active 1 DOM
ⓘ Source: listings_history table (triggers on properties + properties_extension) + one-shot
backfill from property_details.listing_events for pre-trigger history.
Tax reassessment forecast FL · Resets to sale price
- Current annual tax
- $3,504 · $292/mo
- Projected year-2 tax
- $3,504 · $292/mo
- Expected delta
- $0/yr ($0/mo · 0.0%)
ⓘ Screening estimate from a state-policy table — verify with the county assessor before closing.
Climate risk First Street
- Flood 1/10 Low FEMA zone X (unshaded) · 0% chance over 30 yrs
- Wildfire 3/10 Moderate
- Heat 10/10 Extreme 7 d/yr ≥108°F today · 28 d/yr by 30 yrs out
- Wind 10/10 Extreme 99% chance of damaging wind over 30 yrs
- Air quality 2/10 Low 1 unhealthy d/yr today · 2 by 30 yrs out
Nearby sold comps map
Loading sold comps map…
Walkable amenities ~0.75 mi
Loading nearby amenities…
Taxation est. · year 1
- Rental income
- $24,297
- − Mortgage interest
- −$16,525
- − Property taxes
- −$3,504
- − Insurance
- −$1,475
- − Repairs & maintenance
- −$1,944
- − Management
- −$1,944
- − Depreciation
- −$8,582
- Taxable loss
- −$9,676
- Est. tax savings @ 24.0%
- +$2,322
- After-tax cash flow
- $-2,026/yr
For passive investors: Depreciation is non-cash, so a rental often shows a tax loss while cash-flowing — sheltering income. Rental losses are passive: they offset passive income freely, and up to $25,000/yr can offset ordinary (W-2) income if you actively participate and your MAGI is under $100k (phasing out to $0 by $150k); unused losses carry forward. On sale, claimed depreciation is recaptured at up to 25%, and gains may owe capital-gains tax (a 1031 exchange can defer both). Figures are a year-1 estimate at your 24.0% rate — not tax advice; consult a CPA.
Schools (NCES district)
- District
- Lee
- NCES district ID
- 1201080
- Math proficiency
- 47% ▼ -11.00%
- Reading proficiency
- 50% ▼ -4.00%
- Median HH income
- $49,518
- Composite
- 41.49/100
- National rank
- #3458
- State rank
- #42 of 73 in FL
Livability — Lehigh Acres
- Score
- 59/100
- State rank
- #826
- US rank
- #20055
Category grades
Schools grade is shown separately in the Schools card above.
Census & demographics
- Census place
- Lehigh Acres, FL
- County
- Lee County · 788,662 people
- City population
- 130,638
- Metro
- Cape Coral-Fort Myers, FL
- Population (ZIP)
- 19,927
- Household income
- $72,192
- Rent vs Own
- Severe rent burden
- 434.0
Population outlook (Lee County) Hauer SSP2
- Today (2025)
- 871,946 people
- By 2030
- 955,468 · +9.6%
- By 2040
- 1,113,587 · +27.7%
- By 2050
- 1,256,891 · +44.1%
- By 2075
- 1,560,270 · +78.9%
- By 2100
- 1,726,848 · +98.0%
Race, ethnicity, and origin ACS 2023
- Neighborhood character
- Diverse neighborhood (Simpson 0.64)
- Race & ethnicity
- Hispanic / Latino 52% Two or more races 31% White 26% Black 18%
- Hispanic origin (detail)
- Mexican 12% Puerto Rican 7% Cuban 20% Dominican 4%
- Common ancestry
- Hispanic 7% Italian 1% Portuguese 1%
- Foreign-born
- 32% · Canada, Jamaica
- Languages at home
- 48% English-only · Spanish 43% French/Haitian/Cajun 7% Other Indo-European 1%
Political lean MEDSL · Lee
- 2024 margin
- Strong R (+28.4) · D 35.5% · R 63.9%
- 2008→2024 swing
- -18.0pp toward R · 2008: -10.4pp · 2024: -28.4pp
- All cycles
- 2024: R+28.4 2020: R+19.2 2016: R+20.4 2012: R+16.6 2008: R+10.4
Not yet ingested
- Civics
- —
Market trends
- HPI YoY
- ▲ 16.53%
- Current HPI
- 303.3399
- Rent YoY
- ▼ -4.68%
- Metro
- Cape Coral-Fort Myers, FL
- State GDP YoY
- ▲ 3.28%
- F500 in state
- 36
Industry mix (Fortune 500 HQ in FL)
| Industry | F500 HQs | Revenue |
|---|---|---|
| Industrial Technology | 2 | $29B |
|
||
| Insurance | 2 | $17B |
|
||
| Retail | 1 | $60B |
|
||
| Technology Distribution | 1 | $58B |
|
||
| Homebuilding | 1 | $35B |
|
||
| Technology Manufacturing | 1 | $35B |
|
||
Price history
+2850.0% since first listed13 events — show timeline
- 2026-06-14 Listed $295,000 NAPLESMLS
- 2018-09-28 Sold (Public Records) $180,000 Public Records
- 2018-09-26 Sold (MLS) $180,000 FORTMLS
- 2018-08-20 Pending — FORTMLS
- 2018-08-14 Listed $179,900 FORTMLS
- 2015-01-21 Sold (Public Records) $105,000 Public Records
- 2015-01-20 Price Changed $105,000 FORTMLS
- 2015-01-12 Price Changed $109,000 FORTMLS
- 2015-01-12 Sold (MLS) $105,000 FORTMLS
- 2015-01-07 Listed $109,000 FORTMLS
- 2006-10-13 Sold (Public Records) $1,100,000 Public Records
- 2005-08-12 Sold (Public Records) $8,700 Public Records
- 2003-12-19 Sold (Public Records) $10,000 Public Records
Property tax history
+8.2%/yrLatest (2025): $3,504 · -4.3% YoY. Source: county tax records.
Cash-flow waterfall
monthlySold comps — $/sqft
last 12 mo · ≤1 miLoading sold comps…