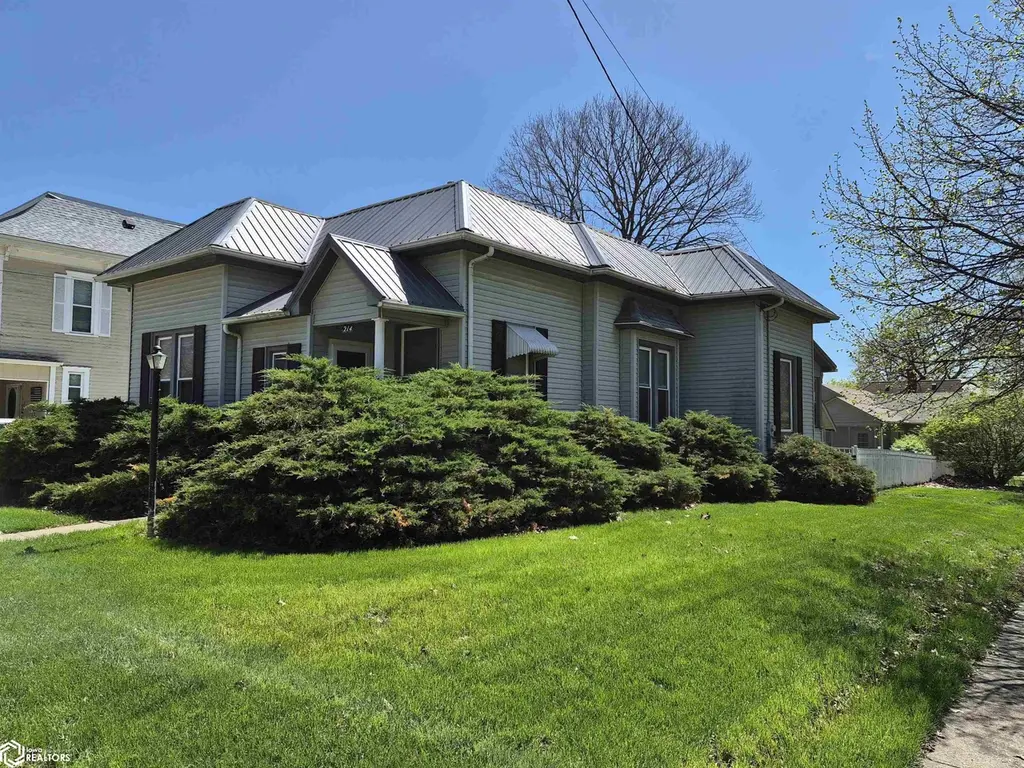
214 College Ave · Oskaloosa, IA
Flood risk 1/10 · Minimal
- FEMA flood zone
- X (unshaded)
- Chance of flooding over 30 yrs
- 0.0%
- Est. flood insurance / yr
- $473 – $860
Fire risk 1/10 · Minimal
- Est. fire insurance / yr
- $902 – $1,676
Heat risk 3/10 · Minor
- Hot days now (above 103°F)
- 7 days/yr
- Hot days in 30 yrs
- 16 days/yr
Wind risk 2/10 · Minimal
- Chance of severe wind over 30 yrs
- —
Air-quality risk 2/10 · Minimal
- Unhealthy air days now
- 1 days/yr
- Unhealthy air days in 30 yrs
- 1 days/yr
Risk factors via First Street. Map © Google.
Why this score? — see what drove the B grade
The composite is a weighted blend of 9 inputs, each scored 0–100. Each bar is that input's sub-score; the figure is the points it added to the 100-point composite (weight × sub-score).
- Cash flow +30.0/30.0
- 1% rule +10.0/10.0
- DSCR +10.0/10.0
- ARV discount +7.5/15.0
- Schools +5.4/10.0
- Livability +4.0/5.0
- Rent growth +2.5/5.0
- Condition / age +2.5/5.0
- Appreciation +0.0/10.0
$71,900
🖨 Deal sheet 📄 Offer letter ✓ Due diligence
Listing remarks
Attention flippers!!! This one has great curb appeal and outside spaces! Two driveways and a detached garage for plenty of off-street parking. Picket fenced in back yard. maintenance free deck for soaking up the south exposure sun. Inside you'll find 3 BRs, 1 bath, kitchen with oak cabs. BIG dining room and a living room as well as 2 back porches. All the basics are here, just needs some inside work to make it fabulous! SOLD AS-IS, WHERE IS. This is an Estate. Pre-approved buyers please.
Key facts
- 7,405 sq ft lot
- Garage
- Built 1920
Neighborhood map
What this means for you Summary
Snapshot
- This is a 3-bed/1.0-bath single-family listed at $72k.
Deal economics
- At list price, monthly cash flow is $406 ($5k/yr) — positive.
- The deal already cash-flows at list — no discount required.
- Meets the 1% rule at list price ($1k rent vs $72k).
- Cap rate 13.1% vs local median 4.8% in Oskaloosa — top-decile yield for the area; either an underpriced asset or a hidden risk that comps aren't pricing in. Stress-test before assuming the spread holds.
Location & tenants
- Location reads 81/100 on livability (#57 in IA, #1,325 nationally) — a professional / high-income tenant draw. Strengths: cost of living A+, housing A+, health & safety A+; Watch: employment C-, amenities D-, commute F.
- Oskaloosa Community School District (rural): math 62% / reading 67% proficiency, ranked #208 of 289 in IA (top 72%) — acceptable for families but not a draw, mixed tenant base, ~2y average lease.
- Market conditions: 71 active listings in the ZIP; 2 comparable units currently listed for rent nearby; 13 units permitted in Mahaska County in 2024 (0 in 5+ unit buildings).
Forward outlook
- Local home prices are declining (-3.0%/yr); year-one equity from $497 of loan paydown is wiped out by about $2k of value loss. Plan a longer hold.
- Mahaska County population projected at -10% by 2050 — secular population decline; favor cash flow + early exit over multi-decade hold.
- At projected returns (-3.0% appreciation + 3.0% rent growth), your $20k cash investment doubles in ~6 years — after that, you're playing with house money.
Negotiation context
- Only 0 days on market — expect competitive offers; lowballing is unlikely to land.
Risks & watch-outs
- Watch-outs: built in 1920 — expect roof / HVAC / electrical / plumbing capex.
Questions for the listing agent
- Built in 1920 — when were the roof, HVAC, electrical panel, plumbing, and water heater last replaced?
- Is there a deadline driving the sale (1031 exchange, divorce, estate, relocation)? That informs how much negotiation room exists.
- Schools are B-rated — typically a magnet for longer-tenancy family renters. What's the average tenant stay here, and is there a school-zone premium baked into asking?
- What's the average days-on-market for RENTAL listings here right now (not sales)? A rising rental-DOM trend means longer vacancies and softer asking-rent achievability than the comps imply.
- What's the recent tenant-quality profile in this submarket — average credit score on applications, eviction rate, late-payment / NSF rate, and stable-employment percentage? A property-management company in the area should have these aggregated.
- How much new for-sale + rental construction is in the pipeline within 1–3 miles? Heavy new supply typically softens prices + rents 12–24 months out; constrained supply supports both.
Investment metrics
- 1% rule
- 1.66% ✓
- Cap rate
- 13.07%
- Cash-on-cash
- 24.21%
- DSCR
- 2.08
- GRM
- 5.0
CMA / ARV
- ARV (on-the-fly)
- $169,884
- Comps found
- 12
Show comp detail 12 sales within ~0.75 mi
| Address | Dist | Beds/Ba | Sqft | Sold | Price | $/sf | Match |
|---|---|---|---|---|---|---|---|
| 214 College Ave | 0.00mi | 3/1.0 | 1,089 (0%) | 1mo | $77,000 | $71 | 99 |
| 415 College Ave | 0.12mi | 2/1.0 (-1) | 1,092 (+0%) | 5mo | $151,000 | $138 | 85 |
| 316 N 1st St | 0.42mi | 3/1.0 | 1,092 (+0%) | 2mo | $89,000 | $82 | 79 |
| 1011 N 2nd St | 0.22mi | 3/1.5 | 1,040 (-4%) | 9mo | $194,900 | $187 | 72 |
| 411 College Hill Ave | 0.21mi | 2/1.5 (-1) | 1,032 (-5%) | 4mo | $150,000 | $145 | 71 |
| 417 College Hill Ave | 0.22mi | 3/1.0 | 960 (-12%) | 1mo | $150,000 | $156 | 69 |
| 710 N C St | 0.15mi | 3/1.0 | 1,242 (+14%) | 7mo | $60,000 | $48 | 64 |
| 1209 M Ave W | 0.64mi | 3/2.0 | 1,020 (-6%) | 7mo | $254,900 | $250 | 50 |
| 208 Rosenberger Ave | 0.19mi | 4/2.5 (+1) | 1,240 (+14%) | 9mo | $230,000 | $185 | 49 |
| 505 A Ave E | 0.61mi | 2/1.0 (-1) | 1,188 (+9%) | 6mo | $129,000 | $109 | 46 |
| 1107 B Ave W | 0.66mi | 2/1.0 (-1) | 1,170 (+7%) | 9mo | $193,500 | $165 | 44 |
| 514 A Ave E | 0.65mi | 3/2.0 | 1,228 (+13%) | 9mo | $247,500 | $202 | 37 |
Match score weights: distance 35% · size 25% · config 20% · recency 20%. Top-matched comps best support the ARV.
Projected returns pro-forma
-3.0% appreciation · 3.0% rent growth · sell at horizon
- IRR
- 17.5%
- Equity multiple
- 1.71×
- Total profit
- $14,264
- Equity at exit
- $10,721
- IRR
- 26.0%
- Equity multiple
- 3.28×
- Total profit
- $45,910
- Equity at exit
- $6,217
Cash invested: $20,132 (down + closing). Projections, not guarantees.
Landlord ↔ Tenant lean methodology
- Overall (STATE)
- 83 Strongly Landlord-Friendly
- State Iowa
- 83 Strongly Landlord-Friendly · R+6
- County
- — inherits STATE
- City
- — inherits STATE
ZIP-level market 52577
- Home prices YoY
- -25.4%
- Active inventory
- 71
- Price-to-rent
- 5.0×
Monthly cashflow live
- Estimated rent
- $1,195 medium interval (Pro) →
- Mortgage (P&I)
- −$377
- Tax from tax record
- −$131 /mo · $1,570/yr
- Insurance
- −$30
- HOA
- −$0
- Vacancy / Maint / Mgmt
- −$251
- Net cashflow
- $406
Break-even live
UW: 25.0% down · 7.5% · 30yr · 1.5% tax · 5.0% vac · 8.0% maint · 8.0% mgmt
Financing live
Cash to close
- Down payment
- $17,975
- Closing costs
- $2,157
- Reserves months
- —
- Total cash needed
- —
Loan-product check · same deal, 3 products live
Conventional
25% down · 7.5% · 30yr
- Down + closing
- —
- Monthly P&I
- —
- Monthly cashflow
- —
- DSCR
- —
- Eligible?
- —
Personal DTI + credit; lowest rate.
DSCR
20% down · 8.5% · 30yr
- Down + closing
- —
- Monthly P&I
- —
- Monthly cashflow
- —
- DSCR
- —
- Eligible?
- —
No personal income docs; deal must DSCR.
Hard money
10% down · 12.0% · 12mo
- Down + closing
- —
- Monthly P&I
- —
- Monthly cashflow
- —
- DSCR
- —
- Eligible?
- —
Short-term bridge; refi at stabilization.
Rent comps 2 comps
| Address | Beds | Baths | Sqft | Rent | $/sqft | DOM | Units | Dist |
|---|---|---|---|---|---|---|---|---|
| 1319 B Ave W Unit 26 Oskaloosa, IA | 2.0 | 1.0 | 856 | $1,195 | $1.40 | 44d | 1 | 0.79mi |
| 1315 B Ave W Unit 6 Oskaloosa, IA | 2.0 | 1.0 | 856 | $1,195 | $1.40 | 44d | 1 | 0.81mi |
Listing history 2 events
-
2026-04-17$71,900
-
2026-04-17historical
ⓘ Source: listings_history table (triggers on properties + properties_extension) + one-shot
backfill from property_details.listing_events for pre-trigger history.
Tax reassessment forecast IA · Partial reset (capped growth)
- Current annual tax
- $1,570 · $131/mo
- Projected year-2 tax
- $1,570 · $131/mo
- Expected delta
- $0/yr ($0/mo · 0.0%)
ⓘ Screening estimate from a state-policy table — verify with the county assessor before closing.
Climate risk First Street
- Flood 1/10 Low FEMA zone X (unshaded) · 0% chance over 30 yrs
- Wildfire 1/10 Low
- Heat 3/10 Moderate 7 d/yr ≥103°F today · 16 d/yr by 30 yrs out
- Wind 2/10 Low
- Air quality 2/10 Low 1 unhealthy d/yr today · 1 by 30 yrs out
Nearby sold comps map
Loading sold comps map…
Walkable amenities ~0.75 mi
Loading nearby amenities…
Taxation est. · year 1
- Rental income
- $14,340
- − Mortgage interest
- −$4,028
- − Property taxes
- −$1,570
- − Insurance
- −$360
- − Repairs & maintenance
- −$1,147
- − Management
- −$1,147
- − Depreciation
- −$2,092
- Taxable income
- $3,997
- Est. tax owed @ 24.0%
- −$959
- After-tax cash flow
- $3,915/yr
For passive investors: Depreciation is non-cash, so a rental often shows a tax loss while cash-flowing — sheltering income. Rental losses are passive: they offset passive income freely, and up to $25,000/yr can offset ordinary (W-2) income if you actively participate and your MAGI is under $100k (phasing out to $0 by $150k); unused losses carry forward. On sale, claimed depreciation is recaptured at up to 25%, and gains may owe capital-gains tax (a 1031 exchange can defer both). Figures are a year-1 estimate at your 24.0% rate — not tax advice; consult a CPA.
Schools (NCES district)
- District
- Oskaloosa Community School District
- NCES district ID
- 1921870
- Math proficiency
- 62% ▼ -4.00%
- Reading proficiency
- 67% ▬ 0.00%
- Median HH income
- $44,362
- Composite
- 54.26/100
- National rank
- #1373
- State rank
- #208 of 289 in IA
Livability — Oskaloosa
- Score
- 81/100
- State rank
- #57
- US rank
- #1325
Category grades
Schools grade is shown separately in the Schools card above.
Census & demographics
- Census place
- Oskaloosa, IA
- Population (ZIP)
- 14,336
Population outlook (Mahaska County) Hauer SSP2
- Today (2025)
- 22,032 people
- By 2030
- 21,682 · -1.6%
- By 2040
- 20,750 · -5.8%
- By 2050
- 19,800 · -10.1%
- By 2075
- 17,839 · -19.0%
- By 2100
- 15,829 · -28.2%
Race, ethnicity, and origin ACS 2023
- Neighborhood character
- Predominantly White (92%)
- Race & ethnicity
- White 92% Two or more races 3% Hispanic / Latino 2% Black 2% Asian 1%
- Common ancestry
- Iranian 8% Italian 3% Portuguese 2%
- Foreign-born
- 2%
- Languages at home
- 97% English-only · Other Asian/Pacific 1% Spanish 1%
Political lean MEDSL · Mahaska
- 2024 margin
- Solid R (+51.6) · D 23.6% · R 75.2% · Other 1.1%
- 2008→2024 swing
- -35.1pp toward R · 2008: -16.5pp · 2024: -51.6pp
- All cycles
- 2024: R+51.6 2020: R+47.4 2016: R+45.7 2012: R+20.5 2008: R+16.5
Not yet ingested
- Civics
- —
Market trends
- HPI YoY
- ▼ -81.78%
- Current HPI
- 239.9131
- Rent YoY
- —
- Metro
- —
- State GDP YoY
- ▲ 2.48%
- F500 in state
- 4
Industry mix (Fortune 500 HQ in IA)
| Industry | F500 HQs | Revenue |
|---|---|---|
| Financial Services | 1 | $16B |
|
||
| Retail / Convenience | 1 | $15B |
|
||
Price history
2 events — show timeline
- 2026-04-17 Delisted — IAR
- 2026-04-17 Listed $71,900 IAR
Property tax history
+1.6%/yrLatest (2025): $1,570 · +1.0% YoY. Source: county tax records.
Cash-flow waterfall
monthlySold comps — $/sqft
last 12 mo · ≤1 miLoading sold comps…