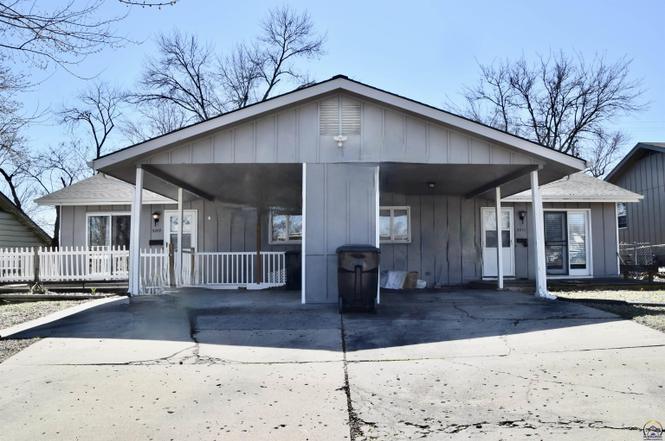
 Duplex
3209 SW 29th Ter · Topeka, KS
Flood risk 1/10 · Minimal
- FEMA flood zone
- X (unshaded)
- Chance of flooding over 30 yrs
- 0.0%
- Est. flood insurance / yr
- $473 – $860
Fire risk 3/10 · Minor
- Est. fire insurance / yr
- $1,154 – $2,142
Heat risk 5/10 · Moderate
- Hot days now (above 107°F)
- 7 days/yr
- Hot days in 30 yrs
- 17 days/yr
Wind risk 2/10 · Minimal
- Chance of severe wind over 30 yrs
- —
Air-quality risk 3/10 · Minor
- Unhealthy air days now
- 3 days/yr
- Unhealthy air days in 30 yrs
- 4 days/yr
Risk factors via First Street. Map © Google.
Why this score? — see what drove the C grade
The composite is a weighted blend of 9 inputs, each scored 0–100. Each bar is that input's sub-score; the figure is the points it added to the 100-point composite (weight × sub-score).
- Cash flow +23.8/30.0
- DSCR +7.7/10.0
- ARV discount +7.5/15.0
- 1% rule +6.0/10.0
- Rent growth +5.0/5.0
- Livability +3.5/5.0
- Condition / age +2.5/5.0
- Schools +1.7/10.0
- Appreciation +0.0/10.0
$185,000
🖨 Deal sheet 📄 Offer letter ✓ Due diligence
Multi-family units
County records classify this as Multi-Family (2-4 Unit). Listing-text estimate: 2 units. confirmed
Listing remarks
Great opportunity to own both sides of this west side duplex close to schools, shopping and entertainment. One side is vacant and move in ready and the other is tenant occupied, each having an additional storage area in the basement. Buyer and buyers agent to verify all pertinent information.
Key facts
- 8,276 sq ft lot
- 4 parking spots
- Built 1967
Tags
Property features AI
Finance
- Other: Listing broker: Better Homes and Gardens Real; Listing agent: Jessy Holcomb, Cell: 785-845-1000
- Financial info: Tax information available but excluded
- HOA & community: HOA or community fee details not provided
Exterior
- Parking: 4 parking spaces
- Security: No security details provided
- Utilities: Utilities information not provided
- Home design: Residential income property configured as a 2–4 unit multifamily; Property occupies a 0.19-acre lot
- Construction: Construction details not provided
- Exterior features: Located in the Sunnymede Subdivision; Directions: From 29th and Oakley, go south to 29th Terrace, then west to the address
Interior
- Kitchen: Kitchen details not provided
- Bedrooms: Bedroom details not provided
- Flooring: Flooring details not provided
- Bathrooms: Bathroom details not provided
- Heating & cooling: Heating and cooling details not provided
- Interior features: No interior feature details available
- Laundry & utility: Laundry and utility details not provided
Neighborhood map
What this means for you Summary
Snapshot
- This is a 2 × 2-bed/1.5-bath units multifamily listed at $185k.
Deal economics
- At list price, monthly cash flow is $356 ($4k/yr) — positive. Per door: $178/mo.
- The deal already cash-flows at list — no discount required.
- Meets the 1% rule at list price ($2k rent vs $185k).
- Recommended offer: $179k (3.0% below list) — sets the bar for market timing.
- Cap rate 8.6% vs local median 4.3% in Topeka — top-decile yield for the area; either an underpriced asset or a hidden risk that comps aren't pricing in. Stress-test before assuming the spread holds.
Location & tenants
- Location reads 69/100 on livability (#195 in KS) — a middle-class / working-renter tenant base. Strengths: cost of living A+, housing A+, health & safety A+; Watch: employment C-, crime F, commute F.
- Topeka Public Schools (urban): math 17% / reading 23% proficiency, ranked #158 of 169 in KS (top 94%) — low school quality limits family demand, transient renter base, plan for 1-2y turnover; 69% free/reduced lunch — lower-income household profile, screen leases tightly.
- Zoned schools: Jardine Elementary (math 18% / reading 24%, grade F, #583 of 684 statewide, top 85%, 743 students, 79% FRL); Jardine Middle School (math 13% / reading 23%, grade F, #164 of 219 statewide, top 76%, 542 students, 79% FRL); Topeka West High (math 13% / reading 20%, grade F, #244 of 327 statewide, top 75%, 1,085 students, 59% FRL) — zoned schools at 72% FRL track the district average.
- Market conditions: Rents rising fast (+9.9%/yr); 137 active listings in the ZIP; 2 comparable units currently listed for rent nearby; 219 units permitted in Shawnee County in 2024 (25 in 5+ unit buildings).
- This rent runs 34% of the median local income ($71k/yr) — at the standard rent-burdened threshold; future hikes will face affordability resistance.
Forward outlook
- Local home prices are declining (-3.0%/yr); year-one equity from $1k of loan paydown is wiped out by about $6k of value loss. Plan a longer hold.
- Shawnee County population projected to shrink 7% by 2050 — rents likely to lag national; underwrite the cash flow, not the appreciation.
- At projected returns (-3.0% appreciation + 8.0% rent growth), your $52k cash investment doubles in ~8 years — after that, you're playing with house money.
Negotiation context
- It's been on market 59 days — a 3% lower offer ($179k) is reasonable based on typical stale-listing flexibility.
- Current owner paid $72k; list at $185k implies a 155% gain — meaningful room to come down on a strong offer.
Risks & watch-outs
- Climate carrying-cost: extreme-heat days projected 7→17/yr by 2055 (HVAC capex compounding) — expect insurance premiums to compound above CPI over the hold.
Questions for the listing agent
- It's been on market 59 days. Have you received any prior offers? Is the seller open to a 3% concession, seller financing, or rate buy-down credit?
- Can we see the unit-by-unit rent roll, current vacancy, and any below-market leases? What's the average tenancy length?
- What capital expenditures (roof, boiler, parking lot, exteriors) have been made in the last 5 years, and what's planned in the next 2?
- Built in 1967 — when were the roof, HVAC, electrical panel, plumbing, and water heater last replaced?
- Is there a deadline driving the sale (1031 exchange, divorce, estate, relocation)? That informs how much negotiation room exists.
- Schools are D-rated, which usually means shorter tenancies and higher turnover. Who's the typical renter profile here, and what's been the actual vacancy rate?
- Crime grade is F in this area — have there been break-ins, vandalism, or insurance claims at this property in the last 3 years? What carrier currently insures it and at what premium?
- What's the average days-on-market for RENTAL listings here right now (not sales)? A rising rental-DOM trend means longer vacancies and softer asking-rent achievability than the comps imply.
- What's the recent tenant-quality profile in this submarket — average credit score on applications, eviction rate, late-payment / NSF rate, and stable-employment percentage? A property-management company in the area should have these aggregated.
- How much new apartment / multifamily construction is in the pipeline within 1–3 miles? Heavy new supply (>2% of stock underway) typically softens rents 12–24 months out; light construction supports rent growth.
Investment metrics
- 1% rule
- 1.10% ✓
- Cap rate
- 8.60%
- Cash-on-cash
- 8.24%
- DSCR
- 1.37
- GRM
- 7.6
CMA / ARV
No comps found within radius.
Projected returns pro-forma
-3.0% appreciation · 8.0% rent growth · sell at horizon
- IRR
- 1.6%
- Equity multiple
- 1.07×
- Total profit
- $3,422
- Equity at exit
- $27,584
- IRR
- 15.6%
- Equity multiple
- 2.57×
- Total profit
- $81,072
- Equity at exit
- $15,995
Cash invested: $51,800 (down + closing). Projections, not guarantees.
Landlord ↔ Tenant lean methodology
- Overall (STATE)
- 83 Strongly Landlord-Friendly
- State Kansas
- 83 Strongly Landlord-Friendly · R+10
- County
- — inherits STATE
- City
- — inherits STATE
ZIP-level market 66614
- Rents YoY
- 9.9%
- Active inventory
- 137
- Price-to-rent
- 15.2×
Monthly cashflow live
- Estimated rent
- $2,032 high interval (Pro) →
- Mortgage (P&I)
- −$970
- Tax from tax record
- −$202 /mo · $2,429/yr
- Insurance
- −$77
- HOA
- −$0
- Vacancy / Maint / Mgmt
- −$427
- Net cashflow
- $356
Break-even live
2-unit breakdown (identical units grouped — click to expand)
| Units | Beds | Baths | Est. rent |
|---|---|---|---|
| 2× units | 2 | 1.5 | $2,032 |
| #1 | 2 | 1.5 | $1,016 |
| #2 | 2 | 1.5 | $1,016 |
| Total (2 units) | $2,032 | ||
UW: 25.0% down · 7.5% · 30yr · 1.5% tax · 5.0% vac · 8.0% maint · 8.0% mgmt
Financing live
Cash to close
- Down payment
- $46,250
- Closing costs
- $5,550
- Reserves months
- —
- Total cash needed
- —
Loan-product check · same deal, 3 products live
Conventional
25% down · 7.5% · 30yr
- Down + closing
- —
- Monthly P&I
- —
- Monthly cashflow
- —
- DSCR
- —
- Eligible?
- —
Personal DTI + credit; lowest rate.
DSCR
20% down · 8.5% · 30yr
- Down + closing
- —
- Monthly P&I
- —
- Monthly cashflow
- —
- DSCR
- —
- Eligible?
- —
No personal income docs; deal must DSCR.
Hard money
10% down · 12.0% · 12mo
- Down + closing
- —
- Monthly P&I
- —
- Monthly cashflow
- —
- DSCR
- —
- Eligible?
- —
Short-term bridge; refi at stabilization.
Rent comps 2 comps
| Address | Beds | Baths | Sqft | Rent | $/sqft | DOM | Units | Dist |
|---|---|---|---|---|---|---|---|---|
| 3211 SW Twilight Ct Topeka, KS | 1.0–3.0 | 1.0–2.0 | 965 | $1,245 | $1.29 | 21d | 6 | 0.50mi |
| 2211 SW Burnett Rd Topeka, KS | 3.0 | 1.0 | 1239 | $1,595 | $1.29 | 21d | 1 | 1.15mi |
Listing history 6 events
-
2026-05-07status Pending
-
2026-04-27price $185,000
-
2026-03-31price $199,000
-
2026-03-09$210,000 Active
-
2022-04-01soldstatus
-
2000-10-01soldstatus $72,500
ⓘ Source: listings_history table (triggers on properties + properties_extension) + one-shot
backfill from property_details.listing_events for pre-trigger history.
Tax reassessment forecast KS · Resets to sale price
- Current annual tax
- $2,429 · $202/mo
- Projected year-2 tax
- $2,608 · $217/mo
- Expected delta
- +$179/yr (+$15/mo · 7.4%)
ⓘ Screening estimate from a state-policy table — verify with the county assessor before closing.
Climate risk First Street
- Flood 1/10 Low FEMA zone X (unshaded) · 0% chance over 30 yrs
- Wildfire 3/10 Moderate
- Heat 5/10 Major 7 d/yr ≥107°F today · 17 d/yr by 30 yrs out
- Wind 2/10 Low
- Air quality 3/10 Moderate 3 unhealthy d/yr today · 4 by 30 yrs out
Nearby sold comps map
Loading sold comps map…
Walkable amenities ~0.75 mi
Loading nearby amenities…
Taxation est. · year 1
- Rental income
- $24,384
- − Mortgage interest
- −$10,363
- − Property taxes
- −$2,429
- − Insurance
- −$925
- − Repairs & maintenance
- −$1,951
- − Management
- −$1,951
- − Depreciation
- −$5,382
- Taxable income
- $1,384
- Est. tax owed @ 24.0%
- −$332
- After-tax cash flow
- $3,935/yr
For passive investors: Depreciation is non-cash, so a rental often shows a tax loss while cash-flowing — sheltering income. Rental losses are passive: they offset passive income freely, and up to $25,000/yr can offset ordinary (W-2) income if you actively participate and your MAGI is under $100k (phasing out to $0 by $150k); unused losses carry forward. On sale, claimed depreciation is recaptured at up to 25%, and gains may owe capital-gains tax (a 1031 exchange can defer both). Figures are a year-1 estimate at your 24.0% rate — not tax advice; consult a CPA.
Schools (NCES district)
- District
- Topeka Public Schools
- NCES district ID
- 2012260
- Math proficiency
- 17% ▼ -8.00%
- Reading proficiency
- 23% ▼ -2.00%
- Median HH income
- $37,405
- Composite
- 16.69/100
- National rank
- #9167
- State rank
- #158 of 169 in KS
Livability — Topeka
- Score
- 69/100
- State rank
- #195
- US rank
- #8848
Category grades
Schools grade is shown separately in the Schools card above.
Census & demographics
- Census place
- Topeka, KS
- County
- Shawnee County · 118,130 people
- City population
- 118,130
- Metro
- Topeka, KS
- Population (ZIP)
- 32,538
- Household income
- $71,377
- Rent vs Own
- Severe rent burden
- 852.0
Population outlook (Shawnee County) Hauer SSP2
- Today (2025)
- 179,277 people
- By 2030
- 177,762 · -0.8%
- By 2040
- 172,341 · -3.9%
- By 2050
- 166,330 · -7.2%
- By 2075
- 152,417 · -15.0%
- By 2100
- 134,782 · -24.8%
Race, ethnicity, and origin ACS 2023
- Neighborhood character
- Predominantly White (79%)
- Race & ethnicity
- White 79% Hispanic / Latino 9% Two or more races 7% Black 4% Asian 3%
- Hispanic origin (detail)
- Mexican 8%
- Common ancestry
- Italian 3% Slovak 2% Romanian 2%
- Foreign-born
- 5% · Canada, China
- Languages at home
- 94% English-only · Spanish 3% Other Asian/Pacific 1% Other Indo-European 1%
Political lean MEDSL · Shawnee
- 2024 margin
- Toss-up / Even · D 49.3% · R 48.8% · Other 2.0%
- 2008→2024 swing
- +0.8pp no change · 2008: -0.3pp · 2024: 0.5pp
- All cycles
- 2024: D+0.5 2020: D+3.0 2016: R+2.8 2012: R+1.7 2008: R+0.3
Not yet ingested
- Civics
- —
Market trends
- HPI YoY
- ▼ -160.56%
- Current HPI
- 225.5592
- Rent YoY
- ▲ 9.88%
- Metro
- Topeka, KS
- State GDP YoY
- —
- F500 in state
- 0
Price history
+155.2% since first listed6 events — show timeline
- 2026-05-07 Pending — Sunflower MLS as distributed by MLS GRID
- 2026-04-27 Price Changed $185,000 Sunflower MLS as distributed by MLS GRID
- 2026-03-31 Price Changed $199,000 Sunflower MLS as distributed by MLS GRID
- 2026-03-09 Listed $210,000 Sunflower MLS as distributed by MLS GRID
- 2022-04-01 Sold (Public Records) — Public Records
- 2000-10-01 Sold (Public Records) $72,500 Public Records
Property tax history
+3.2%/yrLatest (2025): $2,429 · +3.8% YoY. Source: county tax records.
Cash-flow waterfall
monthlySold comps — $/sqft
last 12 mo · ≤1 miLoading sold comps…