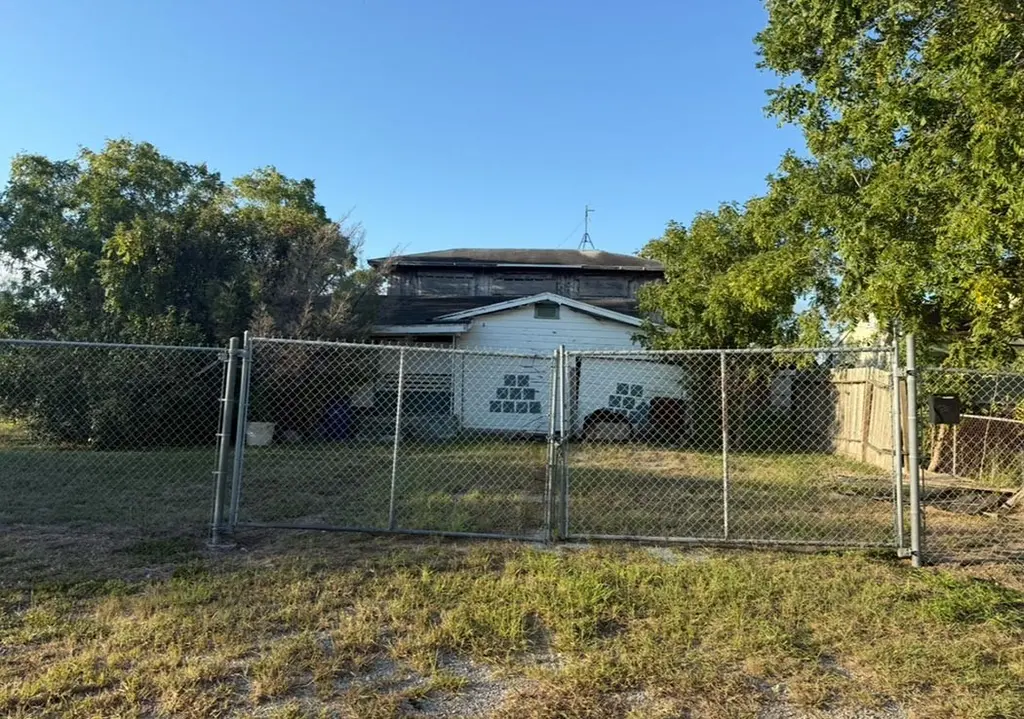
2747 Nemec St · Corpus Christi, TX
Flood risk 6/10 · Moderate
- FEMA flood zone
- X (unshaded)
- Chance of flooding over 30 yrs
- 0.69%
- Est. flood insurance / yr
- $507 – $1,088
Fire risk 1/10 · Minimal
- Est. fire insurance / yr
- $1,222 – $2,270
Heat risk 10/10 · Severe
- Hot days now (above 107°F)
- 7 days/yr
- Hot days in 30 yrs
- 26 days/yr
Wind risk 9/10 · Severe
- Chance of severe wind over 30 yrs
- 99.0%
Air-quality risk 1/10 · Minimal
- Unhealthy air days now
- 0 days/yr
- Unhealthy air days in 30 yrs
- 0 days/yr
Risk factors via First Street. Map © Google.
Why this score? — see what drove the B- grade
The composite is a weighted blend of 9 inputs, each scored 0–100. Each bar is that input's sub-score; the figure is the points it added to the 100-point composite (weight × sub-score).
- Cash flow +30.0/30.0
- 1% rule +10.0/10.0
- DSCR +10.0/10.0
- ARV discount +7.5/15.0
- Livability +3.9/5.0
- Rent growth +3.1/5.0
- Schools +2.8/10.0
- Condition / age +2.5/5.0
- Appreciation +0.0/10.0
$80,000
🖨 Deal sheet 📄 Offer letter ✓ Due diligence
Listing remarks MLS
Located near the intersection of SPID and Crosstown Expressway, this 4 bedroom, 2 bath, 2 story house has approximately 1,856 square feet of living space and the lot has over 20,000 square feet. Needs work
Key facts
- 0.47 acre lot
- 2 garage spots
- Built 1964
Neighborhood map
What this means for you Summary
Snapshot
- This is a 4-bed/2.0-bath single-family listed at $80k.
Deal economics
- At list price, monthly cash flow is $931 ($11k/yr) — positive.
- The deal already cash-flows at list — no discount required.
- Meets the 1% rule at list price ($2k rent vs $80k).
- Recommended offer: $73k (9.0% below list) — sets the bar for market timing.
- Cap rate 20.3% vs local median 3.6% in Corpus Christi — top-decile yield for the area; either an underpriced asset or a hidden risk that comps aren't pricing in. Stress-test before assuming the spread holds.
Location & tenants
- Location reads 78/100 on livability (#66 in TX, #2,404 nationally) — a middle-class / working-renter tenant base. Strengths: commute A+, cost of living A+, housing A+; Watch: crime F.
- Corpus Christi ISD (urban): math 31% / reading 35% proficiency, ranked #562 of 826 in TX (top 68%) — families likely to look elsewhere, expect single-tenant / working-renter base with shorter leases; 63% free/reduced lunch — lower-income household profile, screen leases tightly.
- Market conditions: Rents rising (+2.3%/yr); 417 active listings in the ZIP; 11 comparable units currently listed for rent nearby; rentals lingering (median 44d on market — plan ~5-8 weeks vacancy on turnover, expect pricing pressure); 64% of comp listings sitting > 30 days — soft ceiling on asking rent; 1,397 units permitted in Nueces County in 2024 (47 in 5+ unit buildings).
- This rent runs 44% of the median local income ($55k/yr) — at the standard rent-burdened threshold; future hikes will face affordability resistance.
Forward outlook
- Local home prices are declining (-3.0%/yr); year-one equity from $553 of loan paydown is wiped out by about $2k of value loss. Plan a longer hold.
- Nueces County population projected at +36% by 2050 — long-run rental-demand tailwind backs the buy-and-hold thesis.
- At projected returns (-3.0% appreciation + 2.3% rent growth), your $22k cash investment doubles in ~3 years — after that, you're playing with house money.
Negotiation context
- It's been on market 99 days — a 9% lower offer ($73k) is reasonable based on typical stale-listing flexibility.
Risks & watch-outs
- Watch-outs: property tax is 3.3% of price.
- Climate carrying-cost: major flood risk; severe wind risk, 99% chance of damaging wind over 30y; extreme-heat days projected 7→26/yr by 2055 (HVAC capex compounding) — expect insurance premiums to compound above CPI over the hold.
Questions for the listing agent
- It's been on market 99 days. Have you received any prior offers? Is the seller open to a 9% concession, seller financing, or rate buy-down credit?
- Built in 1964 — when were the roof, HVAC, electrical panel, plumbing, and water heater last replaced?
- Property tax is high relative to price — has the assessment been appealed recently, and will the sale trigger a re-assessment?
- Why hasn't it sold? Are there any deal-killer items the seller is aware of (foundation, flood, title, zoning, code violations)?
- Is there a deadline driving the sale (1031 exchange, divorce, estate, relocation)? That informs how much negotiation room exists.
- Crime grade is F in this area — have there been break-ins, vandalism, or insurance claims at this property in the last 3 years? What carrier currently insures it and at what premium?
- What's the average days-on-market for RENTAL listings here right now (not sales)? A rising rental-DOM trend means longer vacancies and softer asking-rent achievability than the comps imply.
- What's the recent tenant-quality profile in this submarket — average credit score on applications, eviction rate, late-payment / NSF rate, and stable-employment percentage? A property-management company in the area should have these aggregated.
- How much new for-sale + rental construction is in the pipeline within 1–3 miles? Heavy new supply typically softens prices + rents 12–24 months out; constrained supply supports both.
Investment metrics
- 1% rule
- 2.54% ✓
- Cap rate
- 20.25%
- Cash-on-cash
- 49.85%
- DSCR
- 3.22
- GRM
- 3.3
CMA / ARV
- ARV (median comp)
- $164,554
- List price
- $80,000
- Delta
- -51.38%
- Verdict
- UNDERPRICED
- Comps
- 20 within 1.0 mi
Show comp detail 10 sales within ~0.75 mi
| Address | Dist | Beds/Ba | Sqft | Sold | Price | $/sf | Match |
|---|---|---|---|---|---|---|---|
| 5206 Larcade Dr | 0.29mi | 5/2.0 (+1) | 1,776 (-4%) | 12mo | $184,900 | $104 | 64 |
| 2709 Milo St | 0.28mi | 3/2.0 (-1) | 1,718 (-8%) | 23mo | $129,900 | $76 | 50 |
| 5338 Alejandro St | 0.44mi | 4/2.0 | 1,591 (-14%) | 7mo | $120,000 | $75 | 49 |
| 4602 Christie | 0.62mi | 3/2.5 (-1) | 1,954 (+5%) | 10mo | $120,000 | $61 | 47 |
| 5320 Hitching Post | 0.73mi | 4/3.0 | 1,723 (-7%) | 4mo | $211,000 | $122 | 47 |
| 3029 Santa Sofia St | 0.73mi | 4/2.0 | 1,831 (-2%) | 23mo | $265,450 | $145 | 44 |
| 4642 Brookdale Dr | 0.46mi | 4/3.0 | 1,669 (-10%) | 18mo | $175,000 | $105 | 42 |
| 4910 Hakel Dr | 0.64mi | 3/2.0 (-1) | 1,748 (-6%) | 17mo | $229,000 | $131 | 41 |
| 5210 Hitching Post | 0.65mi | 3/3.0 (-1) | 2,062 (+11%) | 7mo | $219,000 | $106 | 36 |
| 4738 Hakel Dr | 0.71mi | 3/2.0 (-1) | 1,664 (-10%) | 14mo | $238,800 | $144 | 33 |
Match score weights: distance 35% · size 25% · config 20% · recency 20%. Top-matched comps best support the ARV.
Projected returns pro-forma
-3.0% appreciation · 2.32% rent growth · sell at horizon
- IRR
- 46.8%
- Equity multiple
- 3.01×
- Total profit
- $45,032
- Equity at exit
- $11,928
- IRR
- 52.2%
- Equity multiple
- 5.93×
- Total profit
- $110,373
- Equity at exit
- $6,917
Cash invested: $22,400 (down + closing). Projections, not guarantees.
Landlord ↔ Tenant lean methodology
- Overall (STATE)
- 87 Strongly Landlord-Friendly
- State Texas
- 87 Strongly Landlord-Friendly · R+5
- County
- — inherits STATE
- City
- — inherits STATE
ZIP-level market 78415
- Rents YoY
- 2.3%
- Active inventory
- 417
- Price-to-rent
- 3.3×
Monthly cashflow live
- Estimated rent
- $2,031 high interval (Pro) →
- Mortgage (P&I)
- −$420
- Tax from tax record
- −$221 /mo · $2,656/yr
- Insurance
- −$33
- HOA
- −$0
- Vacancy / Maint / Mgmt
- −$427
- Net cashflow
- $931
Break-even live
UW: 25.0% down · 7.5% · 30yr · 1.5% tax · 5.0% vac · 8.0% maint · 8.0% mgmt
Financing live
Cash to close
- Down payment
- $20,000
- Closing costs
- $2,400
- Reserves months
- —
- Total cash needed
- —
Loan-product check · same deal, 3 products live
Conventional
25% down · 7.5% · 30yr
- Down + closing
- —
- Monthly P&I
- —
- Monthly cashflow
- —
- DSCR
- —
- Eligible?
- —
Personal DTI + credit; lowest rate.
DSCR
20% down · 8.5% · 30yr
- Down + closing
- —
- Monthly P&I
- —
- Monthly cashflow
- —
- DSCR
- —
- Eligible?
- —
No personal income docs; deal must DSCR.
Hard money
10% down · 12.0% · 12mo
- Down + closing
- —
- Monthly P&I
- —
- Monthly cashflow
- —
- DSCR
- —
- Eligible?
- —
Short-term bridge; refi at stabilization.
Rent comps 11 comps
| Address | Beds | Baths | Sqft | Rent | $/sqft | DOM | Units | Dist |
|---|---|---|---|---|---|---|---|---|
| 5541 Candace St Corpus Christi, TX | 3.0 | 2.0 | 1484 | $1,795 | $1.21 | 13d | 1 | 0.71mi |
| 4241 Green Grove Dr Corpus Christi, TX | 3.0 | 2.0 | 1345 | $1,700 | $1.26 | 43d | 1 | 0.94mi |
| 2930 Water Lily Dr Unit 1268443P Corpus Christi, TX | 3.0 | 2.0 | 2540 | $4,994 | $1.97 | 43d | 1 | 1.07mi |
| 4005 Green Grove Dr Corpus Christi, TX | 3.0 | 2.0 | 1406 | $1,695 | $1.21 | 43d | 1 | 1.18mi |
| 4845 Concord St Corpus Christi, TX | 4.0 | 2.0 | 1437 | $1,750 | $1.22 | 13d | 1 | 1.21mi |
| 2509 Persimmon St Corpus Christi, TX | 3.0 | 2.0 | 1295 | $1,550 | $1.20 | 43d | 1 | 1.29mi |
| 2041 Harvard St Corpus Christi, TX | 3.0 | 2.0 | 1230 | $1,400 | $1.14 | 13d | 1 | 1.31mi |
| 2510 Cresterrace Dr Corpus Christi, TX | 3.0 | 2.0 | 1300 | $1,495 | $1.15 | 43d | 1 | 1.36mi |
| 1522 Cambridge Dr Corpus Christi, TX | 3.0 | 1.5 | 1278 | $1,600 | $1.25 | 43d | 1 | 1.46mi |
| 1618 Birch Pl Corpus Christi, TX | 3.0 | 1.0 | 1558 | $1,500 | $0.96 | 13d | 1 | 1.47mi |
| 4634 Weir Dr Corpus Christi, TX | 3.0 | 2.0 | 1540 | $1,800 | $1.17 | 43d | 1 | 1.49mi |
Listing history 19 events
-
2026-06-18days on market $80,000 Active 99 DOM
-
2026-06-17days on market $80,000 Active 98 DOM
-
2026-06-16days on market $80,000 Active 97 DOM
-
2026-06-15days on market $80,000 Active 96 DOM
-
2026-06-14days on market $80,000 Active 94 DOM
-
2026-06-10days on market $80,000 Active 91 DOM
-
2026-06-09days on market $80,000 Active 90 DOM
-
2026-06-09price $80,000 Active 89 DOM
-
2026-06-08days on market $89,999 Active 89 DOM
-
2026-06-07days on market $89,999 Active 88 DOM
-
2026-06-05days on market $89,999 Active 85 DOM
-
2026-06-03days on market $89,999 Active 84 DOM
-
2026-06-02days on market $89,999 Active 83 DOM
-
2026-06-01days on market $89,999 Active 82 DOM
-
2026-05-31days on market $89,999 Active 81 DOM
-
2026-05-30days on market $89,999 Active 80 DOM
-
2026-03-11$89,999 Active 205-char remark
Show marketing remark (205 chars)
Located near the intersection of SPID and Crosstown Expressway, this 4 bedroom, 2 bath, 2 story house has approximately 1,856 square feet of living space and the lot has over 20,000 square feet. Needs work
-
2025-07-28soldstatus
-
2017-07-11soldstatus
ⓘ Source: listings_history table (triggers on properties + properties_extension) + one-shot
backfill from property_details.listing_events for pre-trigger history.
Tax reassessment forecast TX · Resets to sale price
- Current annual tax
- $2,656 · $221/mo
- Projected year-2 tax
- $2,656 · $221/mo
- Expected delta
- $0/yr ($0/mo · 0.0%)
ⓘ Screening estimate from a state-policy table — verify with the county assessor before closing.
Climate risk First Street
- Flood 6/10 Major FEMA zone X (unshaded) · 69% chance over 30 yrs
- Wildfire 1/10 Low
- Heat 10/10 Extreme 7 d/yr ≥107°F today · 26 d/yr by 30 yrs out
- Wind 9/10 Extreme 99% chance of damaging wind over 30 yrs
- Air quality 1/10 Low 0 unhealthy d/yr today · 0 by 30 yrs out
Nearby sold comps map
Loading sold comps map…
Walkable amenities ~0.75 mi
Loading nearby amenities…
Taxation est. · year 1
- Rental income
- $24,377
- − Mortgage interest
- −$4,481
- − Property taxes
- −$2,656
- − Insurance
- −$400
- − Repairs & maintenance
- −$1,950
- − Management
- −$1,950
- − Depreciation
- −$2,327
- Taxable income
- $10,612
- Est. tax owed @ 24.0%
- −$2,547
- After-tax cash flow
- $8,620/yr
For passive investors: Depreciation is non-cash, so a rental often shows a tax loss while cash-flowing — sheltering income. Rental losses are passive: they offset passive income freely, and up to $25,000/yr can offset ordinary (W-2) income if you actively participate and your MAGI is under $100k (phasing out to $0 by $150k); unused losses carry forward. On sale, claimed depreciation is recaptured at up to 25%, and gains may owe capital-gains tax (a 1031 exchange can defer both). Figures are a year-1 estimate at your 24.0% rate — not tax advice; consult a CPA.
Schools (NCES district)
- District
- Corpus Christi ISD
- NCES district ID
- 4815270
- Math proficiency
- 31% ▼ -18.00%
- Reading proficiency
- 35% ▼ -7.00%
- Median HH income
- $45,672
- Composite
- 28.27/100
- National rank
- #6793
- State rank
- #562 of 826 in TX
Livability — Corpus Christi
- Score
- 78/100
- State rank
- #66
- US rank
- #2404
Category grades
Schools grade is shown separately in the Schools card above.
Census & demographics
- Census place
- Corpus Christi, TX
- County
- Nueces County · 296,836 people
- City population
- 296,836
- Metro
- Corpus Christi, TX
- Population (ZIP)
- 43,080
- Household income
- $54,990
- Rent vs Own
- Severe rent burden
- 1730.0
Population outlook (Nueces County) Hauer SSP2
- Today (2025)
- 418,037 people
- By 2030
- 447,123 · +7.0%
- By 2040
- 505,911 · +21.0%
- By 2050
- 567,522 · +35.8%
- By 2075
- 729,686 · +74.6%
- By 2100
- 847,087 · +102.6%
Race, ethnicity, and origin ACS 2023
- Neighborhood character
- Predominantly Hispanic (83%)
- Race & ethnicity
- Hispanic / Latino 83% Two or more races 41% White 12% Black 3%
- Hispanic origin (detail)
- Mexican 75%
- Foreign-born
- 9% · Canada
- Languages at home
- 59% English-only · Spanish 40%
Political lean MEDSL · Nueces
- 2024 margin
- R (+11.5) · D 43.8% · R 55.3%
- 2008→2024 swing
- -7.1pp toward R · 2008: -4.4pp · 2024: -11.5pp
- All cycles
- 2024: R+11.5 2020: R+2.9 2016: R+1.5 2012: R+3.2 2008: R+4.4
Not yet ingested
- Civics
- —
Market trends
- HPI YoY
- ▼ -173.20%
- Current HPI
- 158.011
- Rent YoY
- ▲ 2.32%
- Metro
- Corpus Christi, TX
- State GDP YoY
- ▲ 3.95%
- F500 in state
- 110
Industry mix (Fortune 500 HQ in TX)
| Industry | F500 HQs | Revenue |
|---|---|---|
| Energy | 16 | $1,198B |
|
||
| Technology | 5 | $198B |
|
||
| Engineering / Construction | 4 | $72B |
|
||
| Energy Services | 3 | $60B |
|
||
| Utilities | 3 | $41B |
|
||
| Healthcare | 2 | $330B |
|
||
Price history
3 events — show timeline
- 2026-03-11 Listed $89,999 CBMLS
- 2025-07-28 Sold (Public Records) — Public Records
- 2017-07-11 Sold (Public Records) — Public Records
Property tax history
+0.5%/yrLatest (2025): $2,656 · +22.1% YoY. Source: county tax records.
Cash-flow waterfall
monthlySold comps — $/sqft
last 12 mo · ≤1 miLoading sold comps…