207 N Fulton Ave · Isola, MS
Flood risk 1/10 · Minimal
- FEMA flood zone
- X (unshaded)
- Chance of flooding over 30 yrs
- 0.0%
- Est. flood insurance / yr
- $507 – $1,088
Fire risk 1/10 · Minimal
- Est. fire insurance / yr
- $1,241 – $2,305
Heat risk 7/10 · Major
- Hot days now (above 111°F)
- 7 days/yr
- Hot days in 30 yrs
- 20 days/yr
Wind risk 6/10 · Moderate
- Chance of severe wind over 30 yrs
- 45.0%
Air-quality risk 1/10 · Minimal
- Unhealthy air days now
- 0 days/yr
- Unhealthy air days in 30 yrs
- 0 days/yr
Risk factors via First Street. Map © Google.
Why this score? — see what drove the D grade
The composite is a weighted blend of 9 inputs, each scored 0–100. Each bar is that input's sub-score; the figure is the points it added to the 100-point composite (weight × sub-score).
- Cash flow +14.6/30.0
- ARV discount +7.5/15.0
- DSCR +4.5/10.0
- 1% rule +4.1/10.0
- Livability +3.0/5.0
- Appreciation +2.7/10.0
- Rent growth +2.5/5.0
- Condition / age +2.5/5.0
- Schools +0.4/10.0
$114,500
🖨 Deal sheet (PDF) 📄 Offer letter ✓ Due diligence
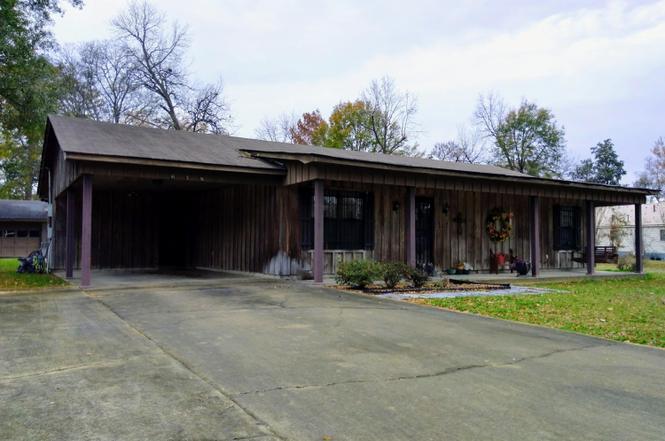
Listing remarks
Perfect location for MS Delta Hunting Cabin, Two Bedroom / Two Bath, Cypress Exterior, +/- 1,912 sq/ft (Adjusted) Slab Foundation, Central HVAC, Gas Heat, Ceramic Tile Flooring, Bonus Room / Sunroom, Large Backyard, Mud/Utility Room, Covered Front Porch, One Car Carport, Spacious Paved Driveway, +/- 700sq/ft Shop w/ Electricity, Utility Shed, Built 1996
Key facts
- Slab foundation
- Central hvac
- Gas heat
Tags
Neighborhood map
What this means for you Summary
Snapshot
- This is a 2-bed/1.0-bath other listed at $114k.
Deal economics
- At list price, monthly cash flow is $28 ($337/yr) — positive.
- The deal already cash-flows at list — no discount required.
- To meet the 1% rule (rent ≥ 1% of price), the offer needs to be $104k (9.4% below list).
- Recommended offer: $104k (9.4% below list) — sets the bar for 1% rule.
Location & tenants
- Location reads 60/100 on livability (#227 in MS) — a middle-class / working-renter tenant base. Strengths: crime A+, cost of living A+, housing A+; Watch: amenities F, commute F, employment F.
- Humphreys County School District (town): math 3% / reading 9% proficiency, ranked #128 of 130 in MS (top 98%) — low school quality limits family demand, transient renter base, plan for 1-2y turnover; 96% free/reduced lunch — lower-income household profile, screen leases tightly.
- Zoned schools: Ida Greene Lower Elementary (math 2% / reading 9%, grade F, #355 of 375 statewide, top 95%, 370 students, 100% FRL); O M Mc Nair Middle School (math 3% / reading 10%, grade F, #171 of 179 statewide, top 97%, 413 students, 100% FRL); Humphreys County High School (math 2% / reading 8%, grade F, #193 of 197 statewide, top 99%, 424 students, 100% FRL) — zoned schools at 100% FRL track the district average.
- Market conditions: 6 active listings in the ZIP.
Forward outlook
- Local home prices are declining (-3.0%/yr); year-one equity from $792 of loan paydown is wiped out by about $3k of value loss. Plan a longer hold.
- Humphreys County population projected at -34% by 2050 — secular population decline; favor cash flow + early exit over multi-decade hold.
Negotiation context
- It's been on market 71 days — a 6% lower offer ($108k) is reasonable based on typical stale-listing flexibility.
- 2 sale attempts; this cycle's ask has dropped $13k (10%) from the opening price — seller is motivated, your offer sets the floor, not the list.
Risks & watch-outs
- Climate carrying-cost: major wind risk, 45% chance of damaging wind over 30y; extreme-heat days projected 7→20/yr by 2055 (HVAC capex compounding) — expect insurance premiums to compound above CPI over the hold.
Questions for the listing agent
- It's been on market 71 days. Have you received any prior offers? Is the seller open to a 9% concession, seller financing, or rate buy-down credit?
- Why hasn't it sold? Are there any deal-killer items the seller is aware of (foundation, flood, title, zoning, code violations)?
- Is there a deadline driving the sale (1031 exchange, divorce, estate, relocation)? That informs how much negotiation room exists.
- Schools are F-rated, which usually means shorter tenancies and higher turnover. Who's the typical renter profile here, and what's been the actual vacancy rate?
- The area grade is low — what's the realistic commute time and amenity access for the typical tenant pool here? Any planned neighborhood developments (good or bad) we should know about?
- What's the average days-on-market for RENTAL listings here right now (not sales)? A rising rental-DOM trend means longer vacancies and softer asking-rent achievability than the comps imply.
- What's the recent tenant-quality profile in this submarket — average credit score on applications, eviction rate, late-payment / NSF rate, and stable-employment percentage? A property-management company in the area should have these aggregated.
- How much new for-sale + rental construction is in the pipeline within 1–3 miles? Heavy new supply typically softens prices + rents 12–24 months out; constrained supply supports both.
Investment metrics
- 1% rule
- 0.91% ✗
- Cap rate
- 6.59%
- Cash-on-cash
- 1.05%
- DSCR
- 1.05
- GRM
- 9.2
CMA / ARV
No comps found within radius.
Projected returns pro-forma
-3.0% appreciation · 3.0% rent growth · sell at horizon
- IRR
- -14.6%
- Equity multiple
- 0.48×
- Total profit
- $-16,749
- Equity at exit
- $17,072
- IRR
- -5.9%
- Equity multiple
- 0.62×
- Total profit
- $-12,217
- Equity at exit
- $9,900
Cash invested: $32,060 (down + closing). Projections, not guarantees.
Landlord ↔ Tenant lean methodology
- Overall (STATE)
- 90 Strongly Landlord-Friendly
- State Mississippi
- 90 Strongly Landlord-Friendly · R+11
- County
- — inherits STATE
- City
- — inherits STATE
ZIP-level market 38754
- Home prices YoY
- -4.1%
- Active inventory
- 6
- Price-to-rent
- 9.2×
Monthly cashflow live
- Estimated rent
- $1,037 medium interval (Pro) →
- Mortgage (P&I)
- −$600
- Tax est. 1.5%
- −$143 /mo · $1,718/yr
- Insurance
- −$48
- HOA
- −$0
- Vacancy / Maint / Mgmt
- −$218
- Net cashflow
- $28
Break-even live
Sensitivity live
| Price | -10% $107 | -5% $68 | +0% $28 | +5% $-11 | +10% $-51 |
|---|---|---|---|---|---|
| Rent | -10% $-54 | -5% $-13 | +0% $28 | +5% $69 | +10% $110 |
| Rate | -1.0pp $86 | -0.5pp $57 | base $28 | +0.5pp $-2 | +1.0pp $-32 |
UW: 25.0% down · 7.5% · 30yr · 1.5% tax · 5.0% vac · 8.0% maint · 8.0% mgmt
Financing live
Cash to close
- Down payment
- $28,625
- Closing costs
- $3,435
- Reserves months
- —
- Total cash needed
- —
Loan-product check · same deal, 3 products live
Conventional
25% down · 7.5% · 30yr
- Down + closing
- —
- Monthly P&I
- —
- Monthly cashflow
- —
- DSCR
- —
- Eligible?
- —
Personal DTI + credit; lowest rate.
DSCR
20% down · 8.5% · 30yr
- Down + closing
- —
- Monthly P&I
- —
- Monthly cashflow
- —
- DSCR
- —
- Eligible?
- —
No personal income docs; deal must DSCR.
Hard money
10% down · 12.0% · 12mo
- Down + closing
- —
- Monthly P&I
- —
- Monthly cashflow
- —
- DSCR
- —
- Eligible?
- —
Short-term bridge; refi at stabilization.
Listing history 6 events
-
2026-03-16status Pending
-
2026-03-12price $114,500
-
2026-03-03status Active
-
2026-02-28status Pending
-
2026-02-11price $121,125
-
2026-01-01$127,500 Active
ⓘ Source: listings_history table (triggers on properties + properties_extension) + one-shot
backfill from property_details.listing_events for pre-trigger history.
Climate risk First Street
- Flood 1/10 Low FEMA zone X (unshaded) · 0% chance over 30 yrs
- Wildfire 1/10 Low
- Heat 7/10 Severe 7 d/yr ≥111°F today · 20 d/yr by 30 yrs out
- Wind 6/10 Major 45% chance of damaging wind over 30 yrs
- Air quality 1/10 Low 0 unhealthy d/yr today · 0 by 30 yrs out
Nearby sold comps map
Loading sold comps map…
Walkable amenities ~0.75 mi
Loading nearby amenities…
Taxation est. · year 1
- Rental income
- $12,446
- − Mortgage interest
- −$6,414
- − Property taxes
- −$1,718
- − Insurance
- −$572
- − Repairs & maintenance
- −$996
- − Management
- −$996
- − Depreciation
- −$3,331
- Taxable loss
- −$1,580
- Est. tax savings @ 24.0%
- +$379
- After-tax cash flow
- $716/yr
For passive investors: Depreciation is non-cash, so a rental often shows a tax loss while cash-flowing — sheltering income. Rental losses are passive: they offset passive income freely, and up to $25,000/yr can offset ordinary (W-2) income if you actively participate and your MAGI is under $100k (phasing out to $0 by $150k); unused losses carry forward. On sale, claimed depreciation is recaptured at up to 25%, and gains may owe capital-gains tax (a 1031 exchange can defer both). Figures are a year-1 estimate at your 24.0% rate — not tax advice; consult a CPA.
Schools (NCES district)
- District
- Humphreys County School District
- NCES district ID
- 2802040
- Math proficiency
- 3% ▼ -13.00%
- Reading proficiency
- 9% ▼ -5.00%
- Median HH income
- $25,369
- Composite
- 3.93/100
- National rank
- #10062
- State rank
- #128 of 130 in MS
Livability — Isola
- Score
- 60/100
- State rank
- #227
- US rank
- #19356
Category grades
Schools grade is shown separately in the Schools card above.
Census & demographics
- Census place
- Isola, MS
- Population (ZIP)
- 1,268
Population outlook (Humphreys County) Hauer SSP2
- Today (2025)
- 7,469 people
- By 2030
- 6,878 · -7.9%
- By 2040
- 5,784 · -22.6%
- By 2050
- 4,906 · -34.3%
- By 2075
- 3,775 · -49.5%
- By 2100
- 3,672 · -50.8%
Race, ethnicity, and origin ACS 2023
- Neighborhood character
- Predominantly Black (82%)
- Race & ethnicity
- Black 82% White 18%
- Common ancestry
- Serbian 2%
Political lean MEDSL · Humphreys
- 2024 margin
- Solid D (+41.9) · D 70.4% · R 28.6% · Other 1.0%
- 2008→2024 swing
- -0.5pp no change · 2008: 42.4pp · 2024: 41.9pp
- All cycles
- 2024: D+41.9 2020: D+45.3 2016: D+48.0 2012: D+52.0 2008: D+42.4
Not yet ingested
- Civics
- —
Market trends
- HPI YoY
- ▼ -4.64%
- Current HPI
- 108.9741
- Rent YoY
- —
- Metro
- —
- State GDP YoY
- —
- F500 in state
- 0
Price history
-10.2% since first listed6 events — show timeline
- 2026-03-16 Pending — MLSU
- 2026-03-12 Price Changed $114,500 MLSU
- 2026-03-03 Relisted — MLSU
- 2026-02-28 Pending — MLSU
- 2026-02-11 Price Changed $121,125 MLSU
- 2026-01-01 Listed $127,500 MLSU
Property tax history
+0.5%/yrLatest (2025): $82 · -0.0% YoY. Source: county tax records.
Cash-flow waterfall
monthlySold comps — $/sqft
last 12 mo · ≤1 miLoading sold comps…