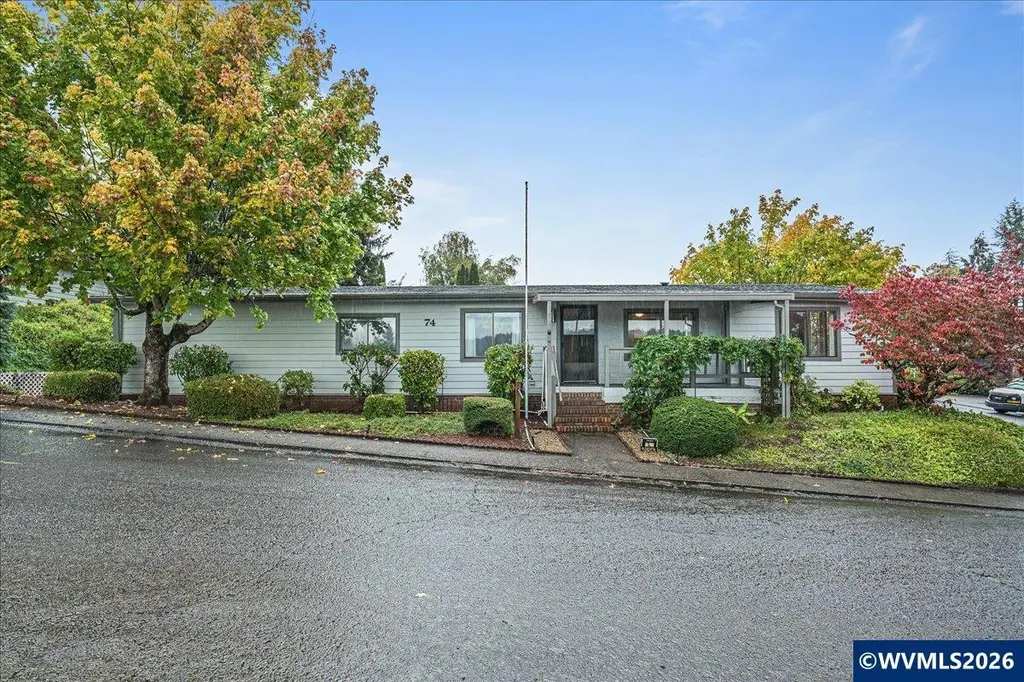
2120 Robins Ln SE #74 · Salem, OR
Flood risk 1/10 · Minimal
- FEMA flood zone
- X (unshaded)
- Chance of flooding over 30 yrs
- 0.0%
- Est. flood insurance / yr
- $507 – $1,088
Fire risk 3/10 · Minor
- Est. fire insurance / yr
- $498 – $926
Heat risk 4/10 · Minor
- Hot days now (above 91°F)
- 7 days/yr
- Hot days in 30 yrs
- 15 days/yr
Wind risk 1/10 · Minimal
- Chance of severe wind over 30 yrs
- —
Air-quality risk 9/10 · Severe
- Unhealthy air days now
- 12 days/yr
- Unhealthy air days in 30 yrs
- 13 days/yr
Risk factors via First Street. Map © Google.
Why this score? — see what drove the C- grade
The composite is a weighted blend of 9 inputs, each scored 0–100. Each bar is that input's sub-score; the figure is the points it added to the 100-point composite (weight × sub-score).
- Cash flow +24.5/30.0
- DSCR +7.9/10.0
- 1% rule +6.3/10.0
- Livability +4.0/5.0
- Schools +3.7/10.0
- Rent growth +2.9/5.0
- Condition / age +2.5/5.0
- ARV discount +0.0/15.0
- Appreciation +0.0/10.0
$210,000
🖨 Deal sheet (PDF) 📄 Offer letter ✓ Due diligence
Listing remarks MLS
Welcome home to this well-maintained corner-lot home in a gated 55+ community. Large windows fill the living and dining areas with natural light and offer a lovely view. Newer carpet in the bedrooms, a spacious primary suite, and an oversized garage with an insulated back area for storage or a workshop. Enjoy the added greenhouse, newer roof and siding, plus a yard with sprinklers and raised garden beds.
Key facts
- Gated community
- Large windows
- Primary suite
Tags
Neighborhood map
What this means for you Summary
Snapshot
- This is a 3-bed/2.0-bath manufactured listed at $210k.
Deal economics
- At list price, monthly cash flow is $429 ($5k/yr) — positive.
- The deal already cash-flows at list — no discount required.
- Meets the 1% rule at list price ($2k rent vs $210k).
- Recommended offer: $197k (6.0% below list) — sets the bar for market timing.
- Cap rate 8.7% vs local median 2.9% in Salem — top-decile yield for the area; either an underpriced asset or a hidden risk that comps aren't pricing in. Stress-test before assuming the spread holds.
Location & tenants
- Location reads 79/100 on livability (#59 in OR, #2,084 nationally) — a middle-class / working-renter tenant base. Strengths: amenities A+, commute A+, housing A+; Watch: schools D, crime F.
- Salem-Keizer SD 24J (urban): math 34% / reading 47% proficiency, ranked #103 of 183 in OR (top 56%) — families likely to look elsewhere, expect single-tenant / working-renter base with shorter leases.
- Market conditions: Rents rising (+1.6%/yr); 272 active listings in the ZIP; 14 comparable units currently listed for rent nearby; rentals lingering (median 44d on market — plan ~5-8 weeks vacancy on turnover, expect pricing pressure); 50% of comp listings sitting > 30 days — soft ceiling on asking rent; solid renter incomes; 1,591 units permitted in Marion County in 2024 (716 in 5+ unit buildings).
Forward outlook
- Local home prices are declining (-3.0%/yr); year-one equity from $1k of loan paydown is wiped out by about $6k of value loss. Plan a longer hold.
- Marion County population projected at +17% by 2050 — long-run rental-demand tailwind backs the buy-and-hold thesis.
Negotiation context
- It's been on market 63 days — a 6% lower offer ($197k) is reasonable based on typical stale-listing flexibility.
- 3 sale attempts since 14y ago with the ask held roughly flat each time — persistent listings suggest the price (not the market) is what's stuck; bring a comps-based counter.
Questions for the listing agent
- It's been on market 63 days. Have you received any prior offers? Is the seller open to a 6% concession, seller financing, or rate buy-down credit?
- Why hasn't it sold? Are there any deal-killer items the seller is aware of (foundation, flood, title, zoning, code violations)?
- Is there a deadline driving the sale (1031 exchange, divorce, estate, relocation)? That informs how much negotiation room exists.
- Schools are D-rated, which usually means shorter tenancies and higher turnover. Who's the typical renter profile here, and what's been the actual vacancy rate?
- Crime grade is F in this area — have there been break-ins, vandalism, or insurance claims at this property in the last 3 years? What carrier currently insures it and at what premium?
- What's the average days-on-market for RENTAL listings here right now (not sales)? A rising rental-DOM trend means longer vacancies and softer asking-rent achievability than the comps imply.
- What's the recent tenant-quality profile in this submarket — average credit score on applications, eviction rate, late-payment / NSF rate, and stable-employment percentage? A property-management company in the area should have these aggregated.
- How much new for-sale + rental construction is in the pipeline within 1–3 miles? Heavy new supply typically softens prices + rents 12–24 months out; constrained supply supports both.
Investment metrics
- 1% rule
- 1.13% ✓
- Cap rate
- 8.75%
- Cash-on-cash
- 8.76%
- DSCR
- 1.39
- GRM
- 7.4
CMA / ARV
- ARV (median comp)
- $144,596
- List price
- $210,000
- Delta
- 45.23%
- Verdict
- OVERPRICED
- Comps
- 20 within 1.0 mi
Show comp detail 12 sales within ~0.75 mi
| Address | Dist | Beds/Ba | Sqft | Sold | Price | $/sf | Match |
|---|---|---|---|---|---|---|---|
| 2000 Robins Ln SE #34 | 0.11mi | 3/2.0 | 1,782 (-2%) | 11mo | $124,000 | $70 | 83 |
| 2120 Robins Ln SE #180 | 0.37mi | 3/2.0 | 1,782 (-2%) | 2mo | $243,000 | $136 | 79 |
| 2120 SE Robins Ln #145 | 0.37mi | 3/2.0 | 1,782 (-2%) | 5mo | $200,000 | $112 | 76 |
| 2000 Robins Ln SE #40 | 0.11mi | 3/2.0 | 1,620 (-10%) | 6mo | $81,200 | $50 | 72 |
| 2000 Robins Ln SE #9 | 0.11mi | 3/2.0 | 1,586 (-12%) | 4mo | $143,000 | $90 | 71 |
| 2120 Robins Ln SE #185 | 0.37mi | 2/2.0 (-1) | 1,728 (-4%) | 5mo | $224,900 | $130 | 66 |
| 2120 Robins Ln SE #101 | 0.00mi | 2/2.0 (-1) | 1,586 (-12%) | 14mo | $100,000 | $63 | 63 |
| 2120 Robins Ln SE #202 | 0.37mi | 3/2.0 | 1,620 (-10%) | 11mo | $194,000 | $120 | 56 |
| 2120 Robins Ln SE #38 | 0.27mi | 2/2.0 (-1) | 1,629 (-10%) | 13mo | $232,500 | $143 | 55 |
| 2120 Robins Ln SE #128 | 0.37mi | 3/2.0 | 1,620 (-10%) | 14mo | $258,000 | $159 | 54 |
| 2120 Robins Ln SE #207 | 0.37mi | 2/2.0 (-1) | 1,593 (-12%) | 10mo | $225,000 | $141 | 50 |
| 2040 Navaho Ct SE | 0.70mi | 2/2.0 (-1) | 1,560 (-14%) | 4mo | $94,999 | $61 | 36 |
Match score weights: distance 35% · size 25% · config 20% · recency 20%. Top-matched comps best support the ARV.
Projected returns pro-forma
-3.0% appreciation · 1.64% rent growth · sell at horizon
- IRR
- -4.6%
- Equity multiple
- 0.83×
- Total profit
- $-9,870
- Equity at exit
- $31,312
- IRR
- 3.5%
- Equity multiple
- 1.24×
- Total profit
- $13,920
- Equity at exit
- $18,157
Cash invested: $58,800 (down + closing). Projections, not guarantees.
Landlord ↔ Tenant lean methodology
- Overall (STATE)
- 28 Tenant-Leaning
- State Oregon
- 28 Tenant-Leaning · D+6
- County
- — inherits STATE
- City
- — inherits STATE
ZIP-level market 97306
- Rents YoY
- 1.6%
- Active inventory
- 272
- Price-to-rent
- 7.4×
Monthly cashflow live
- Estimated rent
- $2,380 high interval (Pro) →
- Mortgage (P&I)
- −$1,101
- Tax est. 1.5%
- −$262 /mo · $3,150/yr
- Insurance
- −$88
- HOA
- −$0
- Vacancy / Maint / Mgmt
- −$500
- Net cashflow
- $429
Break-even live
Sensitivity live
| Price | -10% $574 | -5% $502 | +0% $429 | +5% $357 | +10% $284 |
|---|---|---|---|---|---|
| Rent | -10% $241 | -5% $335 | +0% $429 | +5% $523 | +10% $617 |
| Rate | -1.0pp $535 | -0.5pp $483 | base $429 | +0.5pp $375 | +1.0pp $319 |
UW: 25.0% down · 7.5% · 30yr · 1.5% tax · 5.0% vac · 8.0% maint · 8.0% mgmt
Financing live
Cash to close
- Down payment
- $52,500
- Closing costs
- $6,300
- Reserves months
- —
- Total cash needed
- —
Loan-product check · same deal, 3 products live
Conventional
25% down · 7.5% · 30yr
- Down + closing
- —
- Monthly P&I
- —
- Monthly cashflow
- —
- DSCR
- —
- Eligible?
- —
Personal DTI + credit; lowest rate.
DSCR
20% down · 8.5% · 30yr
- Down + closing
- —
- Monthly P&I
- —
- Monthly cashflow
- —
- DSCR
- —
- Eligible?
- —
No personal income docs; deal must DSCR.
Hard money
10% down · 12.0% · 12mo
- Down + closing
- —
- Monthly P&I
- —
- Monthly cashflow
- —
- DSCR
- —
- Eligible?
- —
Short-term bridge; refi at stabilization.
Rent comps 14 comps
| Address | Beds | Baths | Sqft | Rent | $/sqft | DOM | Units | Dist |
|---|---|---|---|---|---|---|---|---|
| 6127 Blue River Dr SE Salem, OR | 3.0 | 2.5 | 1531 | $2,450 | $1.60 | 44d | 1 | 0.26mi |
| 1951 Madras St SE Salem, OR | 2.0 | 2.5 | 1465 | $1,975 | $1.35 | 21d | 1 | 0.31mi |
| 5943 Blue River Dr SE Salem, OR | 3.0 | 3.0 | 1472 | $2,395 | $1.63 | 44d | 1 | 0.39mi |
| 1544 Fircrest Ct SE Salem, OR | 2.0 | 1.5 | 1296 | $1,850 | $1.43 | 24d | 1 | 0.60mi |
| 6953 Talloc Ave SE Unit 6955 Salem, OR | 3.0 | 2.5 | 1418 | $2,295 | $1.62 | 14d | 1 | 0.78mi |
| 5512 Murray St SE Salem, OR | 3.0 | 2.0 | 1275 | $2,645 | $2.07 | 21d | 1 | 0.82mi |
| 2772 Bastille Ave SE Salem, OR | 3.0 | 2.0 | 1614 | $2,495 | $1.55 | 21d | 1 | 0.90mi |
| 5423 Monterey Dr SE Salem, OR | 3.0 | 2.0 | 1457 | $2,295 | $1.58 | 24d | 1 | 0.94mi |
| 1250 Baxter Rd SE Unit 1276 Salem, OR | 3.0 | 2.5 | 1289 | $2,395 | $1.86 | 14d | 1 | 1.12mi |
| 922 Rees Hill Rd SE Salem, OR | 3.0 | 2.0 | 2333 | $3,995 | $1.71 | 44d | 1 | 1.24mi |
| 6755 Devon Ave SE Salem, OR | 3.0 | 2.0 | 2213 | $3,100 | $1.40 | 44d | 1 | 1.31mi |
| 5031 Big Rock Ct SE Salem, OR | 3.0 | 2.0 | 1314 | $2,700 | $2.05 | 44d | 1 | 1.37mi |
| 5455 Norma Ave SE Salem, OR | 3.0 | 2.0 | 1669 | $2,595 | $1.55 | 44d | 1 | 1.43mi |
| 6011 Sawgrass St SE Salem, OR | 4.0 | 2.5 | 2399 | $3,500 | $1.46 | 44d | 1 | 1.49mi |
Listing history 19 events
-
2026-06-18days on market $210,000 Active 63 DOM
-
2026-06-17days on market $210,000 Active 62 DOM
-
2026-06-16days on market $210,000 Active 61 DOM
-
2026-06-15days on market $210,000 Active 60 DOM
-
2026-06-14days on market $210,000 Active 58 DOM
-
2026-06-10days on market $210,000 Active 55 DOM
-
2026-06-09days on market $210,000 Active 54 DOM
-
2026-06-08days on market $210,000 Active 53 DOM
-
2026-06-07days on market $210,000 Active 52 DOM
-
2026-06-03days on market $210,000 Active 48 DOM
-
2026-06-02days on market $210,000 Active 47 DOM
-
2026-06-01days on market $210,000 Active 46 DOM
-
2026-05-31days on market $210,000 Active 45 DOM
-
2026-05-30days on market $210,000 Active 44 DOM
-
2026-04-16$220,000 Active 407-char remark
Show marketing remark (407 chars)
Welcome home to this well-maintained corner-lot home in a gated 55+ community. Large windows fill the living and dining areas with natural light and offer a lovely view. Newer carpet in the bedrooms, a spacious primary suite, and an oversized garage with an insulated back area for storage or a workshop. Enjoy the added greenhouse, newer roof and siding, plus a yard with sprinklers and raised garden beds.
-
2025-02-21historical
-
2024-10-17$230,000 Active
-
2012-12-07historical
-
2012-10-03$87,500 Active
ⓘ Source: listings_history table (triggers on properties + properties_extension) + one-shot
backfill from property_details.listing_events for pre-trigger history.
Climate risk First Street
- Flood 1/10 Low FEMA zone X (unshaded) · 0% chance over 30 yrs
- Wildfire 3/10 Moderate
- Heat 4/10 Moderate 7 d/yr ≥91°F today · 15 d/yr by 30 yrs out
- Wind 1/10 Low
- Air quality 9/10 Extreme 12 unhealthy d/yr today · 13 by 30 yrs out
Nearby sold comps map
Loading sold comps map…
Walkable amenities ~0.75 mi
Loading nearby amenities…
Taxation est. · year 1
- Rental income
- $28,564
- − Mortgage interest
- −$11,763
- − Property taxes
- −$3,150
- − Insurance
- −$1,050
- − Repairs & maintenance
- −$2,285
- − Management
- −$2,285
- − Depreciation
- −$6,109
- Taxable income
- $1,922
- Est. tax owed @ 24.0%
- −$461
- After-tax cash flow
- $4,689/yr
For passive investors: Depreciation is non-cash, so a rental often shows a tax loss while cash-flowing — sheltering income. Rental losses are passive: they offset passive income freely, and up to $25,000/yr can offset ordinary (W-2) income if you actively participate and your MAGI is under $100k (phasing out to $0 by $150k); unused losses carry forward. On sale, claimed depreciation is recaptured at up to 25%, and gains may owe capital-gains tax (a 1031 exchange can defer both). Figures are a year-1 estimate at your 24.0% rate — not tax advice; consult a CPA.
Schools (NCES district)
- District
- Salem-Keizer SD 24J
- NCES district ID
- 4110820
- Math proficiency
- 34% ▼ -1.00%
- Reading proficiency
- 47% ▼ -2.00%
- Median HH income
- $48,632
- Composite
- 37.16/100
- National rank
- #9017
- State rank
- #103 of 183 in OR
Livability — Salem
- Score
- 79/100
- State rank
- #59
- US rank
- #2084
Category grades
Schools grade is shown separately in the Schools card above.
Census & demographics
- Census place
- Salem, OR
- County
- Marion County · 258,219 people
- City population
- 193,601
- Metro
- Salem, OR
- Population (ZIP)
- 34,383
- Household income
- $101,753
- Rent vs Own
- Severe rent burden
- 1437.0
Population outlook (Marion County) Hauer SSP2
- Today (2025)
- 360,940 people
- By 2030
- 375,178 · +3.9%
- By 2040
- 400,914 · +11.1%
- By 2050
- 422,187 · +17.0%
- By 2075
- 460,305 · +27.5%
- By 2100
- 464,025 · +28.6%
Race, ethnicity, and origin ACS 2023
- Neighborhood character
- Predominantly White (74%)
- Race & ethnicity
- White 74% Hispanic / Latino 12% Two or more races 9% Asian 5% Pacific Islander 2% Black 1%
- Hispanic origin (detail)
- Mexican 9%
- Common ancestry
- Italian 6% Portuguese 5% Slovak 3%
- Foreign-born
- 8% · Canada, China, Vietnam
- Languages at home
- 86% English-only · Spanish 6% Other Asian/Pacific 3% Russian/Polish/Slavic 1%
Political lean MEDSL · Marion
- 2024 margin
- Toss-up / Even · D 47.5% · R 49.5% · Other 3.0%
- 2008→2024 swing
- -4.2pp toward R · 2008: 2.2pp · 2024: -2.0pp
- All cycles
- 2024: R+2.0 2020: D+1.1 2016: R+5.0 2012: R+3.5 2008: D+2.2
Not yet ingested
- Civics
- —
Market trends
- HPI YoY
- ▼ -335.25%
- Current HPI
- 279.7875
- Rent YoY
- ▲ 1.64%
- Metro
- Salem, OR
- State GDP YoY
- ▲ 2.05%
- F500 in state
- 2
Industry mix (Fortune 500 HQ in OR)
| Industry | F500 HQs | Revenue |
|---|---|---|
| Consumer Goods | 1 | $51B |
|
||
Price history
+151.4% since first listed5 events — show timeline
- 2026-04-16 Listed $220,000 WVMLS
- 2025-02-21 Listing Removed — WVMLS
- 2024-10-17 Listed $230,000 WVMLS
- 2012-12-07 Listing Removed — WVMLS
- 2012-10-03 Listed $87,500 WVMLS
Cash-flow waterfall
monthlySold comps — $/sqft
last 12 mo · ≤1 miLoading sold comps…