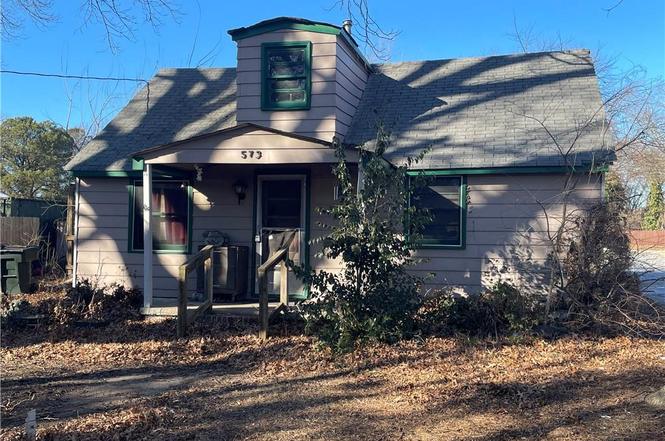
573 Old Point Ave · Hampton, VA
Flood risk 5/10 · Moderate
- FEMA flood zone
- X (unshaded)
- Chance of flooding over 30 yrs
- 0.23%
- Est. flood insurance / yr
- $473 – $860
Fire risk 1/10 · Minimal
- Est. fire insurance / yr
- $666 – $1,236
Heat risk 9/10 · Severe
- Hot days now (above 104°F)
- 7 days/yr
- Hot days in 30 yrs
- 16 days/yr
Wind risk 8/10 · Major
- Chance of severe wind over 30 yrs
- 80.0%
Air-quality risk 2/10 · Minimal
- Unhealthy air days now
- 2 days/yr
- Unhealthy air days in 30 yrs
- 2 days/yr
Risk factors via First Street. Map © Google.
Why this score? — see what drove the B grade
The composite is a weighted blend of 9 inputs, each scored 0–100. Each bar is that input's sub-score; the figure is the points it added to the 100-point composite (weight × sub-score).
- Cash flow +30.0/30.0
- DSCR +10.0/10.0
- 1% rule +9.4/10.0
- ARV discount +7.5/15.0
- Schools +5.5/10.0
- Livability +3.8/5.0
- Rent growth +3.3/5.0
- Condition / age +2.5/5.0
- Appreciation +0.0/10.0
$85,000
🖨 Deal sheet (PDF) 📄 Offer letter ✓ Due diligence
Listing remarks
Investor or builder opportunity with strong redevelopment potential. Property is being sold as-is, where-is, with no repairs to be made by the seller. The existing structure is in poor condition and will require extensive renovation, with potential for a full tear-down and rebuild depending on buyer plans. The primary value lies in the land and future use possibilities. Well-suited for investors, builders, or experienced renovators seeking their next project. Cash or renovation financing recommended.
Key facts
- Built 1953
- Listed 4 days
Neighborhood map
What this means for you Summary
Snapshot
- This is a 2-bed/1.0-bath single-family listed at $85k.
Deal economics
- At list price, monthly cash flow is $327 ($4k/yr) — positive.
- The deal already cash-flows at list — no discount required.
- Meets the 1% rule at list price ($1k rent vs $85k).
- Cap rate 10.9% vs local median 4.5% in Hampton — top-decile yield for the area; either an underpriced asset or a hidden risk that comps aren't pricing in. Stress-test before assuming the spread holds.
Location & tenants
- Location reads 75/100 on livability (#133 in VA, #4,302 nationally) — a middle-class / working-renter tenant base. Strengths: housing A+, health & safety A+, cost of living A; Watch: crime C-, amenities D+, commute F.
- Hampton City Public School District (urban): math 60% / reading 70% proficiency, ranked #40 of 131 in VA (top 30%) — acceptable for families but not a draw, mixed tenant base, ~2y average lease.
- Zoned schools: Captain John Smith Elementary (math 42% / reading 57%, grade D, #742 of 1,108 statewide, top 70%, 393 students, 82% FRL); Phoebus High (math 57% / reading 76%, grade B, #195 of 319 statewide, top 62%, 1,365 students, 86% FRL) — zoned schools average 84% FRL vs 49% district-wide (35 pts higher); higher-poverty schools than district average — tighter screening recommended.
- Market conditions: Rents rising (+3.1%/yr); 80 active listings in the ZIP; 17 comparable units currently listed for rent nearby; rentals at typical pace (median 16d on market — plan ~3-4 weeks tenant-placement turnaround); 68 units permitted in Hampton city in 2024 (0 in 5+ unit buildings).
Forward outlook
- Local home prices are declining (-3.0%/yr); year-one equity from $588 of loan paydown is wiped out by about $3k of value loss. Plan a longer hold.
- Hampton County population projected at -13% by 2050 — secular population decline; favor cash flow + early exit over multi-decade hold.
- At projected returns (-3.0% appreciation + 3.1% rent growth), your $24k cash investment doubles in ~8 years — after that, you're playing with house money.
Negotiation context
- Only 4 days on market — expect competitive offers; lowballing is unlikely to land.
- 2 sale attempts with the ask held roughly flat each time — persistent listings suggest the price (not the market) is what's stuck; bring a comps-based counter.
Risks & watch-outs
- Watch-outs: built in 1953 — expect roof / HVAC / electrical / plumbing capex.
- Climate carrying-cost: moderate flood risk; severe wind risk, 80% chance of damaging wind over 30y; extreme-heat days projected 7→16/yr by 2055 (HVAC capex compounding) — expect insurance premiums to compound above CPI over the hold.
Questions for the listing agent
- Built in 1953 — when were the roof, HVAC, electrical panel, plumbing, and water heater last replaced?
- Is there a deadline driving the sale (1031 exchange, divorce, estate, relocation)? That informs how much negotiation room exists.
- Schools are B-rated — typically a magnet for longer-tenancy family renters. What's the average tenant stay here, and is there a school-zone premium baked into asking?
- What's the average days-on-market for RENTAL listings here right now (not sales)? A rising rental-DOM trend means longer vacancies and softer asking-rent achievability than the comps imply.
- What's the recent tenant-quality profile in this submarket — average credit score on applications, eviction rate, late-payment / NSF rate, and stable-employment percentage? A property-management company in the area should have these aggregated.
- How much new for-sale + rental construction is in the pipeline within 1–3 miles? Heavy new supply typically softens prices + rents 12–24 months out; constrained supply supports both.
Investment metrics
- 1% rule
- 1.44% ✓
- Cap rate
- 10.91%
- Cash-on-cash
- 16.51%
- DSCR
- 1.73
- GRM
- 5.8
CMA / ARV
- ARV (on-the-fly)
- $218,250
- Comps found
- 2
Show comp detail 2 sales within ~0.75 mi
| Address | Dist | Beds/Ba | Sqft | Sold | Price | $/sf | Match |
|---|---|---|---|---|---|---|---|
| 1428 Woodcrest Dr | 0.56mi | 2/1.0 | 705 (-6%) | 8mo | $204,900 | $291 | 58 |
| 617 Renn Rd | 0.71mi | 3/1.0 (+1) | 848 (+13%) | 0mo | $90,000 | $106 | 40 |
Match score weights: distance 35% · size 25% · config 20% · recency 20%. Top-matched comps best support the ARV.
Projected returns pro-forma
-3.0% appreciation · 3.13% rent growth · sell at horizon
- IRR
- 7.8%
- Equity multiple
- 1.31×
- Total profit
- $7,291
- Equity at exit
- $12,674
- IRR
- 17.2%
- Equity multiple
- 2.43×
- Total profit
- $34,071
- Equity at exit
- $7,349
Cash invested: $23,800 (down + closing). Projections, not guarantees.
Landlord ↔ Tenant lean methodology
- Overall (STATE)
- 55 Moderately Landlord-Leaning
- State Virginia
- 55 Moderately Landlord-Leaning · D+2
- County
- — inherits STATE
- City
- — inherits STATE
ZIP-level market 23663
- Home prices YoY
- -4.3%
- Rents YoY
- 3.1%
- Active inventory
- 80
- Price-to-rent
- 5.8×
Monthly cashflow live
- Estimated rent
- $1,227 high interval (Pro) →
- Mortgage (P&I)
- −$446
- Tax from tax record
- −$161 /mo · $1,932/yr
- Insurance
- −$35
- HOA
- −$0
- Vacancy / Maint / Mgmt
- −$258
- Net cashflow
- $327
Break-even live
Sensitivity live
| Price | -10% $376 | -5% $351 | +0% $327 | +5% $303 | +10% $279 |
|---|---|---|---|---|---|
| Rent | -10% $230 | -5% $279 | +0% $327 | +5% $376 | +10% $424 |
| Rate | -1.0pp $370 | -0.5pp $349 | base $327 | +0.5pp $305 | +1.0pp $283 |
UW: 25.0% down · 7.5% · 30yr · 1.5% tax · 5.0% vac · 8.0% maint · 8.0% mgmt
Financing live
Cash to close
- Down payment
- $21,250
- Closing costs
- $2,550
- Reserves months
- —
- Total cash needed
- —
Loan-product check · same deal, 3 products live
Conventional
25% down · 7.5% · 30yr
- Down + closing
- —
- Monthly P&I
- —
- Monthly cashflow
- —
- DSCR
- —
- Eligible?
- —
Personal DTI + credit; lowest rate.
DSCR
20% down · 8.5% · 30yr
- Down + closing
- —
- Monthly P&I
- —
- Monthly cashflow
- —
- DSCR
- —
- Eligible?
- —
No personal income docs; deal must DSCR.
Hard money
10% down · 12.0% · 12mo
- Down + closing
- —
- Monthly P&I
- —
- Monthly cashflow
- —
- DSCR
- —
- Eligible?
- —
Short-term bridge; refi at stabilization.
Rent comps 17 comps
| Address | Beds | Baths | Sqft | Rent | $/sqft | DOM | Units | Dist |
|---|---|---|---|---|---|---|---|---|
| 320 E Mercury Blvd Unit 56 Hampton, VA | 1.0 | 1.0 | 650 | $850 | $1.31 | 18d | 1 | 0.05mi |
| 320 E Mercury Blvd Apt 63 Hampton, VA | 1.0 | 1.0 | 650 | $850 | $1.31 | 44d | 1 | 0.06mi |
| 1115 E Pembroke Ave Hampton, VA | 2.0 | 1.0 | 850 | $1,275 | $1.50 | 2d | 1 | 0.20mi |
| 4 Bainbridge Ave Unit B Hampton, VA | 2.0 | 1.5 | 1050 | $1,550 | $1.48 | 44d | 1 | 0.78mi |
| 234 Washington St Hampton, VA | 2.0 | 1.0 | 1111 | $2,000 | $1.80 | 11d | 1 | 0.81mi |
| 949 N Mallory St Hampton, VA | 2.0 | 1.5 | 1054 | $1,250 | $1.19 | 2d | 1 | 0.83mi |
| 1802 Moger Dr Hampton, VA | 3.0 | 1.0 | 900 | $1,700 | $1.89 | 13d | 1 | 0.90mi |
| 435 Smiley Rd Hampton, VA | 2.0 | 1.0 | 624 | $1,195 | $1.92 | 5d | 1 | 0.92mi |
| 100 Spanish Trl Hampton, VA | 1.0–2.0 | 1.0–1.5 | 812 | $1,450 | $1.79 | 2d | 12 | 1.01mi |
| 28 Monroe Dr Hampton, VA | 3.0 | 1.0 | 1110 | $1,600 | $1.44 | 44d | 1 | 1.32mi |
| 8 Rip Rap Rd Hampton, VA | 2.0 | 1.0 | 1000 | $1,200 | $1.20 | 22d | 1 | 1.32mi |
| 2000 Neville Cir Hampton, VA | 3.0 | 1.0 | 1100 | $1,750 | $1.59 | 44d | 1 | 1.37mi |
| 224 W Queen St Unit 224A Hampton, VA | 1.0 | 1.5 | 1100 | $1,950 | $1.77 | 44d | 1 | 1.38mi |
| 2010 E Pembroke Ave Hampton, VA | 2.0 | 1.0 | 900 | $1,150 | $1.28 | 4d | 1 | 1.41mi |
| 19 Bernard Ave Hampton, VA | 2.0 | 1.0 | 906 | $995 | $1.10 | 22d | 1 | 1.44mi |
| 450 Cedar Dr Hampton, VA | 3.0 | 1.0 | 912 | $1,500 | $1.64 | 12d | 1 | 1.45mi |
| 109 Peachtree Ln Hampton, VA | 3.0 | 2.0 | 984 | $1,795 | $1.82 | 15d | 1 | 1.49mi |
Listing history 4 events
-
2026-02-11status Under Contract
-
2026-02-07$85,000 Active
-
2026-01-25historical
-
2026-01-14$85,000 Active
ⓘ Source: listings_history table (triggers on properties + properties_extension) + one-shot
backfill from property_details.listing_events for pre-trigger history.
Tax reassessment forecast VA · Resets to sale price
- Current annual tax
- $1,932 · $161/mo
- Projected year-2 tax
- $1,932 · $161/mo
- Expected delta
- $0/yr ($0/mo · 0.0%)
ⓘ Screening estimate from a state-policy table — verify with the county assessor before closing.
Climate risk First Street
- Flood 5/10 Major FEMA zone X (unshaded) · 23% chance over 30 yrs
- Wildfire 1/10 Low
- Heat 9/10 Extreme 7 d/yr ≥104°F today · 16 d/yr by 30 yrs out
- Wind 8/10 Severe 80% chance of damaging wind over 30 yrs
- Air quality 2/10 Low 2 unhealthy d/yr today · 2 by 30 yrs out
Nearby sold comps map
Loading sold comps map…
Walkable amenities ~0.75 mi
Loading nearby amenities…
Taxation est. · year 1
- Rental income
- $14,728
- − Mortgage interest
- −$4,761
- − Property taxes
- −$1,932
- − Insurance
- −$425
- − Repairs & maintenance
- −$1,178
- − Management
- −$1,178
- − Depreciation
- −$2,473
- Taxable income
- $2,780
- Est. tax owed @ 24.0%
- −$667
- After-tax cash flow
- $3,261/yr
For passive investors: Depreciation is non-cash, so a rental often shows a tax loss while cash-flowing — sheltering income. Rental losses are passive: they offset passive income freely, and up to $25,000/yr can offset ordinary (W-2) income if you actively participate and your MAGI is under $100k (phasing out to $0 by $150k); unused losses carry forward. On sale, claimed depreciation is recaptured at up to 25%, and gains may owe capital-gains tax (a 1031 exchange can defer both). Figures are a year-1 estimate at your 24.0% rate — not tax advice; consult a CPA.
Schools (NCES district)
- District
- Hampton City Public School District
- NCES district ID
- 5101800
- Math proficiency
- 60% ▼ -21.00%
- Reading proficiency
- 70% ▼ -4.00%
- Median HH income
- $50,089
- Composite
- 55.19/100
- National rank
- #1272
- State rank
- #40 of 131 in VA
Livability — Hampton
- Score
- 75/100
- State rank
- #133
- US rank
- #4302
Category grades
Schools grade is shown separately in the Schools card above.
Census & demographics
- Census place
- Hampton, VA
- County
- Hampton City · 132,421 people
- City population
- 132,421
- Metro
- Virginia Beach-Norfolk-Newport News, VA-NC
- Population (ZIP)
- 14,656
- Household income
- $54,336
- Rent vs Own
- Severe rent burden
- 803.0
Population outlook (Hampton County) Hauer SSP2
- Today (2025)
- 134,055 people
- By 2030
- 131,753 · -1.7%
- By 2040
- 125,017 · -6.7%
- By 2050
- 116,825 · -12.9%
- By 2075
- 97,033 · -27.6%
- By 2100
- 76,188 · -43.2%
Race, ethnicity, and origin ACS 2023
- Neighborhood character
- Diverse neighborhood (Simpson 0.63)
- Race & ethnicity
- Black 48% White 37% Two or more races 11% Hispanic / Latino 5%
- Common ancestry
- Romanian 1% Serbian 1% Lithuanian 1%
- Foreign-born
- 3% · Canada
- Languages at home
- 95% English-only · Spanish 3%
Political lean MEDSL · Hampton
- 2024 margin
- Solid D (+39.9) · D 69.2% · R 29.4% · Other 1.4%
- 2008→2024 swing
- +1.0pp no change · 2008: 38.9pp · 2024: 39.9pp
- All cycles
- 2024: D+39.9 2020: D+42.2 2016: D+37.8 2012: D+45.4 2008: D+38.9
Not yet ingested
- Civics
- —
Market trends
- HPI YoY
- ▼ -14.71%
- Current HPI
- 328.8386
- Rent YoY
- ▲ 3.13%
- Metro
- Virginia Beach-Norfolk-Newport News, VA-NC
- State GDP YoY
- ▲ 2.40%
- F500 in state
- 50
Industry mix (Fortune 500 HQ in VA)
| Industry | F500 HQs | Revenue |
|---|---|---|
| Aerospace / Defense | 4 | $236B |
|
||
| Technology / Defense | 3 | $32B |
|
||
| Financial Services | 2 | $176B |
|
||
| Utilities | 2 | $27B |
|
||
| Insurance | 2 | $25B |
|
||
| Technology | 2 | $15B |
|
||
Price history
+0.0% since first listed4 events — show timeline
- 2026-02-11 Pending — REINMLS
- 2026-02-07 Listed $85,000 REINMLS
- 2026-01-25 Listing Removed — REINMLS
- 2026-01-14 Listed $85,000 REINMLS
Property tax history
+7.7%/yrLatest (2025): $1,932 · -0.4% YoY. Source: county tax records.
Cash-flow waterfall
monthlySold comps — $/sqft
last 12 mo · ≤1 miLoading sold comps…