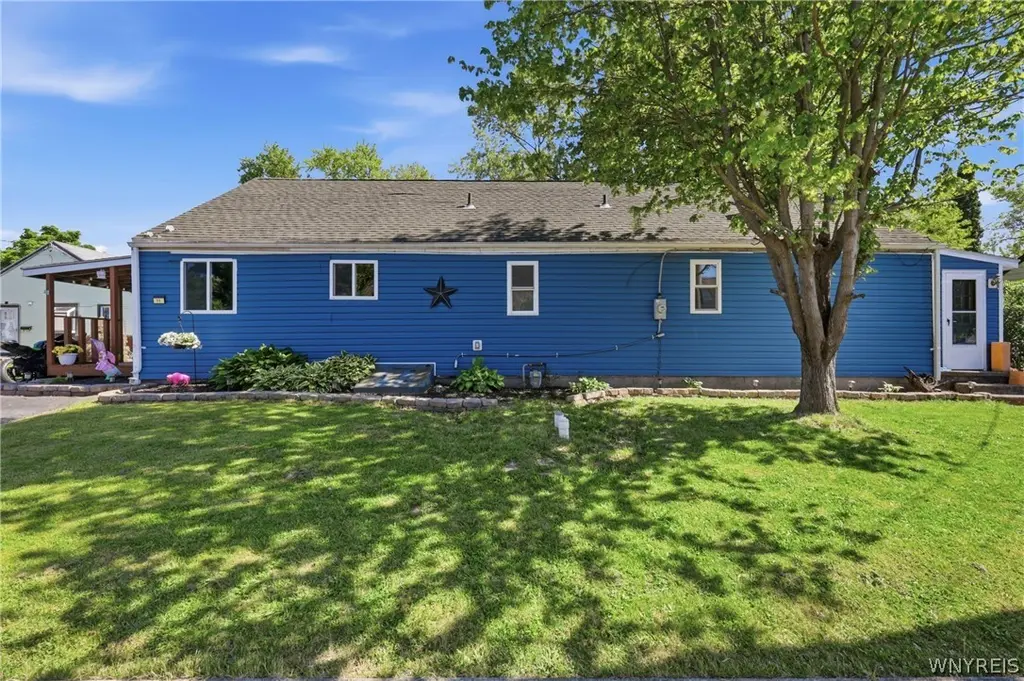
11 Thoreau Ct · Tonawanda Town, NY
Flood risk 1/10 · Minimal
- FEMA flood zone
- X (unshaded)
- Chance of flooding over 30 yrs
- 0.0%
- Est. flood insurance / yr
- $507 – $1,088
Fire risk 1/10 · Minimal
- Est. fire insurance / yr
- $691 – $1,283
Heat risk 2/10 · Minimal
- Hot days now (above 93°F)
- 7 days/yr
- Hot days in 30 yrs
- 15 days/yr
Wind risk 1/10 · Minimal
- Chance of severe wind over 30 yrs
- —
Air-quality risk 3/10 · Minor
- Unhealthy air days now
- 3 days/yr
- Unhealthy air days in 30 yrs
- 4 days/yr
Risk factors via First Street. Map © Google.
Why this score? — see what drove the B grade
The composite is a weighted blend of 9 inputs, each scored 0–100. Each bar is that input's sub-score; the figure is the points it added to the 100-point composite (weight × sub-score).
- Cash flow +30.0/30.0
- 1% rule +10.0/10.0
- DSCR +10.0/10.0
- ARV discount +7.5/15.0
- Rent growth +4.2/5.0
- Schools +3.9/10.0
- Livability +2.5/5.0
- Condition / age +2.5/5.0
- Appreciation +0.0/10.0
$99,900
🖨 Deal sheet (PDF) 📄 Offer letter ✓ Due diligence
Listing remarks
Welcome to 11 Thoreau Ct! This charming 2 bedroom, 1 bath ranch offers comfortable one floor living on a spacious lot in the Town of Tonawanda. Step inside to find a large living room, an updated full bath, and an eat in kitchen with ample cabinet space. The home features a versatile bonus room that can serve as a home office, hobby room, or additional living space. Enjoy the convenience of two separate driveways, providing plenty of off-street parking for vehicles, recreational equipment, or guests. Outside, you'll find a large backyard with a deck, mature trees, and plenty of room for entertaining, gardening, or relaxing. Vinyl siding, updated finishes, and a functional layout make this h
Key facts
- Updated full bath
- Eat in kitchen
- Large backyard
Tags
Property features AI
Exterior
- Parking: No garage
- Utilities: Electricity connected (circuit breakers); Public water connected; Sewer connected
- Home design: Single-story home; Existing construction; Entry level on main floor
- Construction: Vinyl siding; Asphalt roof; Block foundation; Copper and PEX plumbing
- Exterior features: Blacktop driveway; Deck; Partial fence; Rectangular residential lot; City street frontage; Lot dimensions 98 x 95
Interior
- Kitchen: Dishwasher; Gas oven; Gas range; Microwave; Refrigerator
- Bedrooms: Two main-level bedrooms; Bedroom on main level
- Flooring: Carpet; Laminate; Varies
- Bathrooms: One full bathroom (main level)
- Heating & cooling: Gas forced-air heating
- Interior features: Eat-in kitchen; Living/dining room; Sliding glass door(s)
- Laundry & utility: Main-level laundry
Neighborhood map
What this means for you Summary
Snapshot
- This is a 3-bed/2.0-bath single-family listed at $100k.
Deal economics
- At list price, monthly cash flow is $735 ($9k/yr) — positive.
- The deal already cash-flows at list — no discount required.
- Meets the 1% rule at list price ($2k rent vs $100k).
- Recommended offer: $98k (1.5% below list) — sets the bar for market timing.
- Cap rate 15.1% vs local median 4.1% in Tonawanda Town — top-decile yield for the area; either an underpriced asset or a hidden risk that comps aren't pricing in. Stress-test before assuming the spread holds.
Location & tenants
- Location reads: area grade B — affects rentability + tenant quality, not the cash-flow math above.
- Kenmore-Tonawanda Union Free School District (suburban): math 44% / reading 47% proficiency, ranked #453 of 590 in NY (top 77%) — families likely to look elsewhere, expect single-tenant / working-renter base with shorter leases.
- Zoned schools: Holmes Elementary School (math 17% / reading 42%, grade F, #1,729 of 2,108 statewide, top 84%, 281 students, 78% FRL); Herbert Hoover Middle School (math 24% / reading 39%, grade F, #522 of 729 statewide, top 73%, 758 students, 51% FRL); Kenmore West Senior High School (math 74% / reading 57%, grade B, #773 of 1,100 statewide, top 70%, 1,358 students, 51% FRL) — zoned schools average 60% FRL vs 33% district-wide (27 pts higher); higher-poverty schools than district average — tighter screening recommended.
- Market conditions: Rents rising fast (+6.8%/yr); 193 active listings in the ZIP; 7 comparable units currently listed for rent nearby; rentals at typical pace (median 19d on market — plan ~3-4 weeks tenant-placement turnaround); 1,244 units permitted in Erie County in 2024 (563 in 5+ unit buildings).
- This rent runs 33% of the median local income ($71k/yr) — at the standard rent-burdened threshold; future hikes will face affordability resistance.
Forward outlook
- Local home prices are declining (-3.0%/yr); year-one equity from $691 of loan paydown is wiped out by about $3k of value loss. Plan a longer hold.
- At projected returns (-3.0% appreciation + 6.8% rent growth), your $28k cash investment doubles in ~4 years — after that, you're playing with house money.
Negotiation context
- It's been on market 17 days — a 2% lower offer ($98k) is reasonable based on typical stale-listing flexibility.
Risks & watch-outs
- Watch-outs: property tax is 3.3% of price; built in 1941 — expect roof / HVAC / electrical / plumbing capex.
Questions for the listing agent
- Built in 1941 — when were the roof, HVAC, electrical panel, plumbing, and water heater last replaced?
- Property tax is high relative to price — has the assessment been appealed recently, and will the sale trigger a re-assessment?
- Is there a deadline driving the sale (1031 exchange, divorce, estate, relocation)? That informs how much negotiation room exists.
- What's the average days-on-market for RENTAL listings here right now (not sales)? A rising rental-DOM trend means longer vacancies and softer asking-rent achievability than the comps imply.
- What's the recent tenant-quality profile in this submarket — average credit score on applications, eviction rate, late-payment / NSF rate, and stable-employment percentage? A property-management company in the area should have these aggregated.
- How much new for-sale + rental construction is in the pipeline within 1–3 miles? Heavy new supply typically softens prices + rents 12–24 months out; constrained supply supports both.
Investment metrics
- 1% rule
- 1.99% ✓
- Cap rate
- 15.12%
- Cash-on-cash
- 31.54%
- DSCR
- 2.40
- GRM
- 4.2
CMA / ARV
- ARV (on-the-fly)
- $239,772
- Comps found
- 12
Show comp detail 12 sales within ~0.75 mi
| Address | Dist | Beds/Ba | Sqft | Sold | Price | $/sf | Match |
|---|---|---|---|---|---|---|---|
| 275 Mapleview Dr | 0.41mi | 4/1.5 (+1) | 1,355 (-2%) | 1mo | $227,000 | $168 | 70 |
| 42 Parkedge Ct | 0.50mi | 3/1.5 | 1,362 (-1%) | 7mo | $243,000 | $178 | 67 |
| 278 Ensminger Rd | 0.25mi | 2/1.0 (-1) | 1,352 (-2%) | 15mo | $235,000 | $174 | 63 |
| 306 Dupont Ave | 0.58mi | 3/2.0 | 1,368 (-1%) | 19mo | $233,000 | $170 | 56 |
| 250 Dupont Ave | 0.62mi | 3/1.0 | 1,508 (+9%) | 7mo | $220,000 | $146 | 46 |
| 184 Dunlop Ave | 0.69mi | 3/1.0 | 1,354 (-2%) | 22mo | $205,000 | $151 | 43 |
| 56 Ermann Dr | 0.67mi | 3/1.5 | 1,300 (-6%) | 18mo | $210,000 | $162 | 42 |
| 49 Elmview Dr | 0.43mi | 3/2.0 | 1,212 (-12%) | 22mo | $230,000 | $190 | 41 |
| 308 Lowell Rd | 0.74mi | 3/1.0 | 1,249 (-9%) | 6mo | $243,000 | $195 | 41 |
| 253 Rosemont Ave | 0.74mi | 4/2.5 (+1) | 1,396 (+1%) | 21mo | $321,000 | $230 | 39 |
| 210 Dupont Ave | 0.66mi | 3/1.0 | 1,228 (-11%) | 17mo | $120,000 | $98 | 33 |
| 25 Ermann Dr | 0.75mi | 3/1.0 | 1,224 (-11%) | 19mo | $242,500 | $198 | 26 |
Match score weights: distance 35% · size 25% · config 20% · recency 20%. Top-matched comps best support the ARV.
Projected returns pro-forma
-3.0% appreciation · 6.75% rent growth · sell at horizon
- IRR
- 31.1%
- Equity multiple
- 2.38×
- Total profit
- $38,545
- Equity at exit
- $14,895
- IRR
- 40.5%
- Equity multiple
- 5.61×
- Total profit
- $128,895
- Equity at exit
- $8,638
Cash invested: $27,972 (down + closing). Projections, not guarantees.
Landlord ↔ Tenant lean methodology
- Overall (STATE)
- 15 Strongly Tenant-Friendly
- State New York
- 15 Strongly Tenant-Friendly · D+10
- County
- — inherits STATE
- City
- — inherits STATE
ZIP-level market 14150
- Rents YoY
- 6.8%
- Active inventory
- 193
- Price-to-rent
- 4.2×
Monthly cashflow live
- Estimated rent
- $1,991 high interval (Pro) →
- Mortgage (P&I)
- −$524
- Tax from tax record
- −$272 /mo · $3,267/yr
- Insurance
- −$42
- HOA
- −$0
- Vacancy / Maint / Mgmt
- −$418
- Net cashflow
- $735
Break-even live
Sensitivity live
| Price | -10% $792 | -5% $763 | +0% $735 | +5% $707 | +10% $679 |
|---|---|---|---|---|---|
| Rent | -10% $578 | -5% $656 | +0% $735 | +5% $814 | +10% $892 |
| Rate | -1.0pp $785 | -0.5pp $760 | base $735 | +0.5pp $709 | +1.0pp $683 |
UW: 25.0% down · 7.5% · 30yr · 1.5% tax · 5.0% vac · 8.0% maint · 8.0% mgmt
Financing live
Cash to close
- Down payment
- $24,975
- Closing costs
- $2,997
- Reserves months
- —
- Total cash needed
- —
Loan-product check · same deal, 3 products live
Conventional
25% down · 7.5% · 30yr
- Down + closing
- —
- Monthly P&I
- —
- Monthly cashflow
- —
- DSCR
- —
- Eligible?
- —
Personal DTI + credit; lowest rate.
DSCR
20% down · 8.5% · 30yr
- Down + closing
- —
- Monthly P&I
- —
- Monthly cashflow
- —
- DSCR
- —
- Eligible?
- —
No personal income docs; deal must DSCR.
Hard money
10% down · 12.0% · 12mo
- Down + closing
- —
- Monthly P&I
- —
- Monthly cashflow
- —
- DSCR
- —
- Eligible?
- —
Short-term bridge; refi at stabilization.
Rent comps 7 comps
| Address | Beds | Baths | Sqft | Rent | $/sqft | DOM | Units | Dist |
|---|---|---|---|---|---|---|---|---|
| 36-46 Crowell Ct Unit 40 Tonawanda, NY | 3.0 | 1.0 | 1000 | $1,395 | $1.40 | 25d | 1 | 0.29mi |
| 1835 Military Rd Buffalo, NY | 2.0 | 1.0 | 1064 | $2,175 | $2.04 | 18d | 1 | 0.68mi |
| 148 Colonial Ave Buffalo, NY | 4.0 | 2.0 | 1240 | $2,900 | $2.34 | 25d | 1 | 0.96mi |
| 237 W Girard Blvd Buffalo, NY | 4.0 | 1.5 | 1329 | $4,000 | $3.01 | 25d | 1 | 1.30mi |
| 49 Tulane Rd Buffalo, NY | 2.0 | 1.0 | 1100 | $1,600 | $1.45 | 18d | 1 | 1.40mi |
| 62 Seabrook St Buffalo, NY | 4.0 | 1.0 | 1300 | $2,000 | $1.54 | 3d | 1 | 1.46mi |
| 53 Winkler Dr Tonawanda, NY | 3.0 | 1.0 | 1060 | $2,100 | $1.98 | 13d | 1 | 1.48mi |
Listing history 12 events
-
2026-06-21statusdays on market $99,900 Pending 17 DOM
-
2026-06-18days on market $99,900 Active 16 DOM
-
2026-06-17days on market $99,900 Active 15 DOM
-
2026-06-16days on market $99,900 Active 14 DOM
-
2026-06-15days on market $99,900 Active 13 DOM
-
2026-06-13days on market $99,900 Active 11 DOM
-
2026-06-10days on market $99,900 Active 8 DOM
-
2026-06-09days on market $99,900 Active 7 DOM
-
2026-06-08days on market $99,900 Active 6 DOM
-
2026-06-07days on market $99,900 Active 5 DOM
-
2026-06-03remarks 699-char remark
-
2026-06-03$99,900 Active 1 DOM
ⓘ Source: listings_history table (triggers on properties + properties_extension) + one-shot
backfill from property_details.listing_events for pre-trigger history.
Tax reassessment forecast NY · Partial reset (capped growth)
- Current annual tax
- $3,267 · $272/mo
- Projected year-2 tax
- $3,267 · $272/mo
- Expected delta
- $0/yr ($0/mo · 0.0%)
ⓘ Screening estimate from a state-policy table — verify with the county assessor before closing.
Climate risk First Street
- Flood 1/10 Low FEMA zone X (unshaded) · 0% chance over 30 yrs
- Wildfire 1/10 Low
- Heat 2/10 Low 7 d/yr ≥93°F today · 15 d/yr by 30 yrs out
- Wind 1/10 Low
- Air quality 3/10 Moderate 3 unhealthy d/yr today · 4 by 30 yrs out
Nearby sold comps map
Loading sold comps map…
Walkable amenities ~0.75 mi
Loading nearby amenities…
Taxation est. · year 1
- Rental income
- $23,891
- − Mortgage interest
- −$5,596
- − Property taxes
- −$3,267
- − Insurance
- −$500
- − Repairs & maintenance
- −$1,911
- − Management
- −$1,911
- − Depreciation
- −$2,906
- Taxable income
- $7,800
- Est. tax owed @ 24.0%
- −$1,872
- After-tax cash flow
- $6,949/yr
For passive investors: Depreciation is non-cash, so a rental often shows a tax loss while cash-flowing — sheltering income. Rental losses are passive: they offset passive income freely, and up to $25,000/yr can offset ordinary (W-2) income if you actively participate and your MAGI is under $100k (phasing out to $0 by $150k); unused losses carry forward. On sale, claimed depreciation is recaptured at up to 25%, and gains may owe capital-gains tax (a 1031 exchange can defer both). Figures are a year-1 estimate at your 24.0% rate — not tax advice; consult a CPA.
Schools (NCES district)
- District
- Kenmore-Tonawanda Union Free School District
- NCES district ID
- 3616230
- Math proficiency
- 44% ▼ -12.00%
- Reading proficiency
- 47% ▼ -1.00%
- Median HH income
- $51,433
- Composite
- 39.18/100
- National rank
- #4024
- State rank
- #453 of 590 in NY
Livability — Tonawanda Town
No livability data for this city. (Only ~50 U.S. cities are tracked.)
Census & demographics
- Census place
- Tonawanda Town, NY
- County
- Erie County · 714,559 people
- City population
- 63,948
- Metro
- Buffalo-Cheektowaga, NY
- Population (ZIP)
- 41,260
- Household income
- $71,406
- Rent vs Own
- Severe rent burden
- 1427.0
Population outlook (Erie County) Hauer SSP2
- Today (2025)
- 933,037 people
- By 2030
- 935,181 · +0.2%
- By 2040
- 928,531 · -0.5%
- By 2050
- 905,725 · -2.9%
- By 2075
- 834,037 · -10.6%
- By 2100
- 708,033 · -24.1%
Race, ethnicity, and origin ACS 2023
- Neighborhood character
- Predominantly White (87%)
- Race & ethnicity
- White 87% Two or more races 5% Hispanic / Latino 5% Black 4% Asian 2%
- Common ancestry
- Romanian 13% Lithuanian 3% Slovak 2%
- Foreign-born
- 6% · Canada, Philippines, Vietnam
- Languages at home
- 94% English-only · Other Indo-European 2% Spanish 1% Russian/Polish/Slavic 1%
Political lean MEDSL · Erie
- 2024 margin
- Lean D (+9.7) · D 54.8% · R 45.2%
- 2008→2024 swing
- -7.9pp toward R · 2008: 17.5pp · 2024: 9.7pp
- All cycles
- 2024: D+9.7 2020: D+14.7 2016: D+4.8 2012: D+15.6 2008: D+17.5
Not yet ingested
- Civics
- —
Market trends
- HPI YoY
- ▼ -260.43%
- Current HPI
- 334.5893
- Rent YoY
- ▲ 6.75%
- Metro
- Buffalo-Cheektowaga, NY
- State GDP YoY
- ▲ 2.60%
- F500 in state
- 92
Industry mix (Fortune 500 HQ in NY)
| Industry | F500 HQs | Revenue |
|---|---|---|
| Financial Services | 10 | $950B |
|
||
| Consumer Goods | 9 | $162B |
|
||
| Insurance | 4 | $225B |
|
||
| Telecommunications | 2 | $144B |
|
||
| Pharmaceuticals | 2 | $112B |
|
||
| Media / Entertainment | 2 | $69B |
|
||
Price history
1 event — show timeline
- 2026-06-02 Listed $99,900 WNYREIS
Property tax history
+7.2%/yrLatest (2025): $3,267 · +4.4% YoY. Source: county tax records.
Cash-flow waterfall
monthlySold comps — $/sqft
last 12 mo · ≤1 miLoading sold comps…