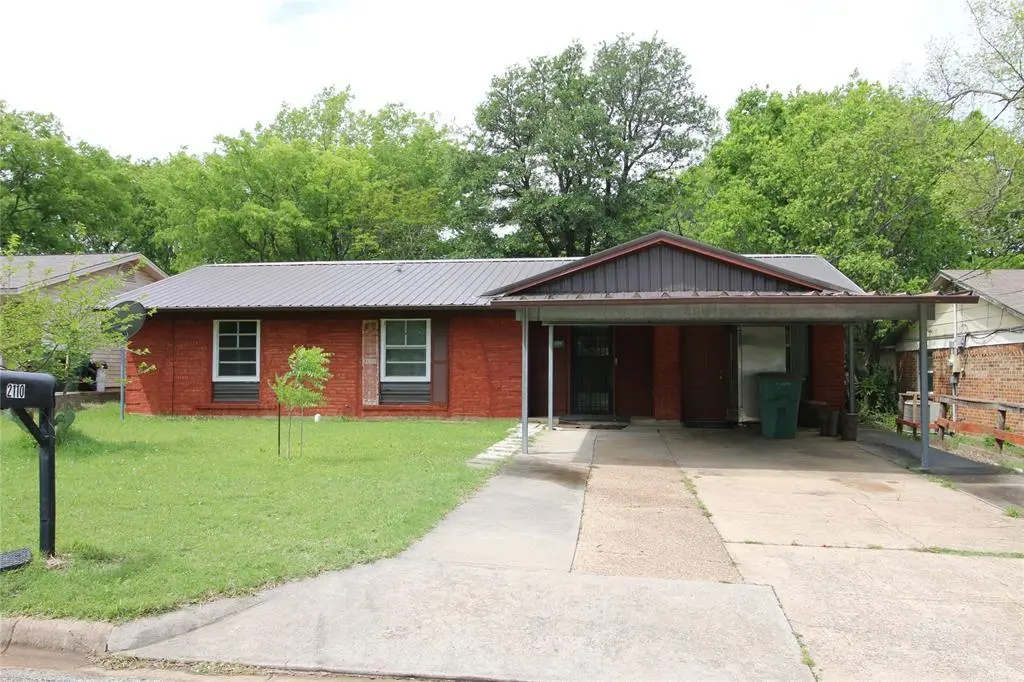
2110 N Duchess Dr · Sherman, TX
Flood risk 1/10 · Minimal
- FEMA flood zone
- X (unshaded)
- Chance of flooding over 30 yrs
- 0.0%
- Est. flood insurance / yr
- $507 – $1,088
Fire risk 7/10 · Major
- Est. fire insurance / yr
- $1,222 – $2,270
Heat risk 6/10 · Moderate
- Hot days now (above 108°F)
- 7 days/yr
- Hot days in 30 yrs
- 22 days/yr
Wind risk 4/10 · Minor
- Chance of severe wind over 30 yrs
- 18.0%
Air-quality risk 2/10 · Minimal
- Unhealthy air days now
- 2 days/yr
- Unhealthy air days in 30 yrs
- 2 days/yr
Risk factors via First Street. Map © Google.
Why this score? — see what drove the D grade
The composite is a weighted blend of 9 inputs, each scored 0–100. Each bar is that input's sub-score; the figure is the points it added to the 100-point composite (weight × sub-score).
- Cash flow +14.2/30.0
- ARV discount +10.1/15.0
- 1% rule +4.4/10.0
- DSCR +4.3/10.0
- Livability +3.1/5.0
- Schools +2.9/10.0
- Condition / age +2.5/5.0
- Rent growth +1.8/5.0
- Appreciation +0.0/10.0
$155,000
🖨 Deal sheet (PDF) 📄 Offer letter ✓ Due diligence
Listing remarks MLS
Nice 3 bedroom, 1 and half bathroom plus a big covered patio has a great potential to live with. The original attached garage was converted to a living area that brings additional space to use. The solid slab foundation and beautiful metal roof support low-maintenance ownership. This is the house that could be rarely found around near countryside area. The property is conveniently located with quick access to US-75, making travel to surrounding cities simple while keeping daily essentials, shopping, dining, and outdoor spaces close by. The big covered patio on the back provides you many functions to enjoy with the countryside living style. Whether you're looking for a place to call home or an opportunity to build long-term value, this house offers a solid base in a well-established area of Sherman.
Key facts
- Metal roof
- Converted garage
- Covered patio
Tags
Neighborhood map
What this means for you Summary
Snapshot
- This is a 3-bed/1.5-bath single-family listed at $155k.
Deal economics
- At list price, monthly cash flow is $24 ($291/yr) — positive.
- The deal already cash-flows at list — no discount required.
- To meet the 1% rule (rent ≥ 1% of price), the offer needs to be $145k (6.2% below list).
- Recommended offer: $145k (6.2% below list) — sets the bar for 1% rule.
- Cap rate 6.5% vs local median 3.7% in Sherman — top-decile yield for the area; either an underpriced asset or a hidden risk that comps aren't pricing in. Stress-test before assuming the spread holds.
Location & tenants
- Location reads 61/100 on livability (#1,027 in TX) — a middle-class / working-renter tenant base. Strengths: cost of living A+, housing A+; Watch: crime C-, employment C-, amenities F.
- Sherman ISD (urban): math 31% / reading 37% proficiency, ranked #546 of 826 in TX (top 66%) — families likely to look elsewhere, expect single-tenant / working-renter base with shorter leases.
- Zoned schools: Percy W Neblett El (math 27% / reading 32%, grade F, #2,525 of 4,322 statewide, top 62%, 559 students, 70% FRL); Piner Middle (math 31% / reading 41%, grade F, #805 of 1,662 statewide, top 50%, 818 students, 75% FRL); Sherman H S (math 28% / reading 44%, grade F, #930 of 1,632 statewide, top 57%, 2,155 students, 70% FRL).
- Market conditions: Rents soft (-2.7%/yr); 479 active listings in the ZIP; 6 comparable units currently listed for rent nearby; rentals at typical pace (median 23d on market — plan ~3-4 weeks tenant-placement turnaround); 2,272 units permitted in Grayson County in 2024 (750 in 5+ unit buildings).
- This rent runs 31% of the median local income ($56k/yr) — at the standard rent-burdened threshold; future hikes will face affordability resistance.
Forward outlook
- Local home prices are declining (-3.0%/yr); year-one equity from $1k of loan paydown is wiped out by about $5k of value loss. Plan a longer hold.
- Grayson County population projected at +12% by 2050 — modest demand growth; plan on rents tracking national, not racing it.
Negotiation context
- It's been on market 66 days — a 6% lower offer ($146k) is reasonable based on typical stale-listing flexibility.
Risks & watch-outs
- Climate carrying-cost: major wildfire risk; extreme-heat days projected 7→22/yr by 2055 (HVAC capex compounding) — expect insurance premiums to compound above CPI over the hold.
Questions for the listing agent
- It's been on market 66 days. Have you received any prior offers? Is the seller open to a 6% concession, seller financing, or rate buy-down credit?
- Built in 1967 — when were the roof, HVAC, electrical panel, plumbing, and water heater last replaced?
- Why hasn't it sold? Are there any deal-killer items the seller is aware of (foundation, flood, title, zoning, code violations)?
- Is there a deadline driving the sale (1031 exchange, divorce, estate, relocation)? That informs how much negotiation room exists.
- Schools are D-rated, which usually means shorter tenancies and higher turnover. Who's the typical renter profile here, and what's been the actual vacancy rate?
- The area grade is low — what's the realistic commute time and amenity access for the typical tenant pool here? Any planned neighborhood developments (good or bad) we should know about?
- What's the average days-on-market for RENTAL listings here right now (not sales)? A rising rental-DOM trend means longer vacancies and softer asking-rent achievability than the comps imply.
- What's the recent tenant-quality profile in this submarket — average credit score on applications, eviction rate, late-payment / NSF rate, and stable-employment percentage? A property-management company in the area should have these aggregated.
- How much new for-sale + rental construction is in the pipeline within 1–3 miles? Heavy new supply typically softens prices + rents 12–24 months out; constrained supply supports both.
Investment metrics
- 1% rule
- 0.94% ✗
- Cap rate
- 6.48%
- Cash-on-cash
- 0.67%
- DSCR
- 1.03
- GRM
- 8.9
CMA / ARV
- ARV (median comp)
- $164,449
- List price
- $155,000
- Delta
- -5.75%
- Verdict
- FAIR
- Comps
- 20 within 1.0 mi
Show comp detail 4 sales within ~0.75 mi
| Address | Dist | Beds/Ba | Sqft | Sold | Price | $/sf | Match |
|---|---|---|---|---|---|---|---|
| 1925 N Ross Ave | 0.24mi | 3/2.0 | 1,056 (+14%) | 12mo | $169,000 | $160 | 53 |
| 1424 N Brents Ave | 0.48mi | 2/1.0 (-1) | 980 (+6%) | 11mo | $125,000 | $128 | 51 |
| 1321 N Ross Ave | 0.56mi | 3/1.0 | 1,027 (+11%) | 20mo | $189,900 | $185 | 36 |
| 1306 N Brents Ave | 0.58mi | 2/1.0 (-1) | 820 (-11%) | 17mo | $159,000 | $194 | 33 |
Match score weights: distance 35% · size 25% · config 20% · recency 20%. Top-matched comps best support the ARV.
Projected returns pro-forma
-3.0% appreciation · 0.0% rent growth · sell at horizon
- IRR
- -18.8%
- Equity multiple
- 0.36×
- Total profit
- $-27,778
- Equity at exit
- $23,111
- IRR
- -19.4%
- Equity multiple
- 0.11×
- Total profit
- $-38,443
- Equity at exit
- $13,402
Cash invested: $43,400 (down + closing). Projections, not guarantees.
Landlord ↔ Tenant lean methodology
- Overall (STATE)
- 87 Strongly Landlord-Friendly
- State Texas
- 87 Strongly Landlord-Friendly · R+5
- County
- — inherits STATE
- City
- — inherits STATE
ZIP-level market 75090
- Home prices YoY
- -20.0%
- Rents YoY
- -2.7%
- Active inventory
- 479
- Price-to-rent
- 8.9×
Monthly cashflow live
- Estimated rent
- $1,454 high interval (Pro) →
- Mortgage (P&I)
- −$813
- Tax from tax record
- −$247 /mo · $2,962/yr
- Insurance
- −$65
- HOA
- −$0
- Vacancy / Maint / Mgmt
- −$305
- Net cashflow
- $24
Break-even live
Sensitivity live
| Price | -10% $112 | -5% $68 | +0% $24 | +5% $-20 | +10% $-63 |
|---|---|---|---|---|---|
| Rent | -10% $-91 | -5% $-33 | +0% $24 | +5% $82 | +10% $139 |
| Rate | -1.0pp $102 | -0.5pp $64 | base $24 | +0.5pp $-16 | +1.0pp $-57 |
UW: 25.0% down · 7.5% · 30yr · 1.5% tax · 5.0% vac · 8.0% maint · 8.0% mgmt
Financing live
Cash to close
- Down payment
- $38,750
- Closing costs
- $4,650
- Reserves months
- —
- Total cash needed
- —
Loan-product check · same deal, 3 products live
Conventional
25% down · 7.5% · 30yr
- Down + closing
- —
- Monthly P&I
- —
- Monthly cashflow
- —
- DSCR
- —
- Eligible?
- —
Personal DTI + credit; lowest rate.
DSCR
20% down · 8.5% · 30yr
- Down + closing
- —
- Monthly P&I
- —
- Monthly cashflow
- —
- DSCR
- —
- Eligible?
- —
No personal income docs; deal must DSCR.
Hard money
10% down · 12.0% · 12mo
- Down + closing
- —
- Monthly P&I
- —
- Monthly cashflow
- —
- DSCR
- —
- Eligible?
- —
Short-term bridge; refi at stabilization.
Rent comps 6 comps
| Address | Beds | Baths | Sqft | Rent | $/sqft | DOM | Units | Dist |
|---|---|---|---|---|---|---|---|---|
| 1600 La Salle Dr Sherman, TX | 2.0 | 1.0–2.0 | 687 | $1,014 | $1.47 | 23d | 15 | 0.74mi |
| 704 Frisco Rd Sherman, TX | 2.0 | 1.0 | 682 | $795 | $1.17 | 45d | 1 | 1.06mi |
| 515 N Colbert Ave Sherman, TX | 2.0 | 1.0 | 707 | $1,250 | $1.77 | 23d | 1 | 1.07mi |
| 1111 Gallagher Dr Sherman, TX | 2.0 | 1.0–2.0 | 1050 | $1,714 | $1.63 | 23d | 26 | 1.20mi |
| 10001 Cedar Rd Tom Bean, TX | 1.0–2.0 | 1.0–2.0 | 969 | $1,560 | $1.61 | 23d | 40 | 1.21mi |
| 108 N Cleveland Ave Sherman, TX | 3.0 | 1.5 | 1060 | $1,200 | $1.13 | 45d | 1 | 1.41mi |
Listing history 20 events
-
2026-06-21days on market $155,000 Active 66 DOM
-
2026-06-19days on market $155,000 Active 64 DOM
-
2026-06-18days on market $155,000 Active 63 DOM
-
2026-06-17days on market $155,000 Active 62 DOM
-
2026-06-16days on market $155,000 Active 61 DOM
-
2026-06-15days on market $155,000 Active 60 DOM
-
2026-06-14days on market $155,000 Active 58 DOM
-
2026-06-13days on market $155,000 Active 57 DOM
-
2026-06-10days on market $155,000 Active 55 DOM
-
2026-06-09days on market $155,000 Active 54 DOM
-
2026-06-08days on market $155,000 Active 53 DOM
-
2026-06-07days on market $155,000 Active 52 DOM
-
2026-06-03days on market $155,000 Active 48 DOM
-
2026-06-02days on market $155,000 Active 47 DOM
-
2026-06-01days on market $155,000 Active 46 DOM
-
2026-05-31days on market $155,000 Active 45 DOM
-
2026-05-30days on market $155,000 Active 44 DOM
-
2026-04-15$155,000 Active 809-char remark
Show marketing remark (809 chars)
Nice 3 bedroom, 1 and half bathroom plus a big covered patio has a great potential to live with. The original attached garage was converted to a living area that brings additional space to use. The solid slab foundation and beautiful metal roof support low-maintenance ownership. This is the house that could be rarely found around near countryside area. The property is conveniently located with quick access to US-75, making travel to surrounding cities simple while keeping daily essentials, shopping, dining, and outdoor spaces close by. The big covered patio on the back provides you many functions to enjoy with the countryside living style. Whether you're looking for a place to call home or an opportunity to build long-term value, this house offers a solid base in a well-established area of Sherman.
-
2015-07-13soldstatus
-
1999-02-22soldstatus
ⓘ Source: listings_history table (triggers on properties + properties_extension) + one-shot
backfill from property_details.listing_events for pre-trigger history.
Tax reassessment forecast TX · Resets to sale price
- Current annual tax
- $2,962 · $247/mo
- Projected year-2 tax
- $2,962 · $247/mo
- Expected delta
- $0/yr ($0/mo · 0.0%)
ⓘ Screening estimate from a state-policy table — verify with the county assessor before closing.
Climate risk First Street
- Flood 1/10 Low FEMA zone X (unshaded) · 0% chance over 30 yrs
- Wildfire 7/10 Severe
- Heat 6/10 Major 7 d/yr ≥108°F today · 22 d/yr by 30 yrs out
- Wind 4/10 Moderate 18% chance of damaging wind over 30 yrs
- Air quality 2/10 Low 2 unhealthy d/yr today · 2 by 30 yrs out
Nearby sold comps map
Loading sold comps map…
Walkable amenities ~0.75 mi
Loading nearby amenities…
Taxation est. · year 1
- Rental income
- $17,445
- − Mortgage interest
- −$8,682
- − Property taxes
- −$2,962
- − Insurance
- −$775
- − Repairs & maintenance
- −$1,396
- − Management
- −$1,396
- − Depreciation
- −$4,509
- Taxable loss
- −$2,274
- Est. tax savings @ 24.0%
- +$546
- After-tax cash flow
- $837/yr
For passive investors: Depreciation is non-cash, so a rental often shows a tax loss while cash-flowing — sheltering income. Rental losses are passive: they offset passive income freely, and up to $25,000/yr can offset ordinary (W-2) income if you actively participate and your MAGI is under $100k (phasing out to $0 by $150k); unused losses carry forward. On sale, claimed depreciation is recaptured at up to 25%, and gains may owe capital-gains tax (a 1031 exchange can defer both). Figures are a year-1 estimate at your 24.0% rate — not tax advice; consult a CPA.
Schools (NCES district)
- District
- Sherman ISD
- NCES district ID
- 4840080
- Math proficiency
- 31% ▼ -9.00%
- Reading proficiency
- 37% ▼ -2.00%
- Median HH income
- $42,587
- Composite
- 28.79/100
- National rank
- #6665
- State rank
- #546 of 826 in TX
Livability — Sherman
- Score
- 61/100
- State rank
- #1027
- US rank
- #18243
Category grades
Schools grade is shown separately in the Schools card above.
Census & demographics
- Census place
- Sherman, TX
- County
- Grayson County · 108,053 people
- City population
- 54,936
- Metro
- Sherman-Denison, TX
- Population (ZIP)
- 26,594
- Household income
- $55,543
- Rent vs Own
- Severe rent burden
- 840.0
Population outlook (Grayson County) Hauer SSP2
- Today (2025)
- 134,540 people
- By 2030
- 138,653 · +3.1%
- By 2040
- 145,958 · +8.5%
- By 2050
- 151,218 · +12.4%
- By 2075
- 161,802 · +20.3%
- By 2100
- 159,036 · +18.2%
Race, ethnicity, and origin ACS 2023
- Neighborhood character
- Diverse neighborhood (Simpson 0.64)
- Race & ethnicity
- White 49% Hispanic / Latino 32% Two or more races 17% Black 11%
- Hispanic origin (detail)
- Mexican 26%
- Common ancestry
- Slovak 2% Romanian 2% Lithuanian 1%
- Foreign-born
- 15% · Canada
- Languages at home
- 73% English-only · Spanish 24% German/W. Germanic 1% Other Indo-European 1%
Political lean MEDSL · Grayson
- 2024 margin
- Solid R (+54.3) · D 22.5% · R 76.7%
- 2008→2024 swing
- -16.4pp toward R · 2008: -37.9pp · 2024: -54.3pp
- All cycles
- 2024: R+54.3 2020: R+49.9 2016: R+53.1 2012: R+48.0 2008: R+37.9
Not yet ingested
- Civics
- —
Market trends
- HPI YoY
- ▼ -69.00%
- Current HPI
- 276.5739
- Rent YoY
- ▼ -2.70%
- Metro
- Sherman-Denison, TX
- State GDP YoY
- ▲ 3.95%
- F500 in state
- 110
Industry mix (Fortune 500 HQ in TX)
| Industry | F500 HQs | Revenue |
|---|---|---|
| Energy | 16 | $1,198B |
|
||
| Technology | 5 | $198B |
|
||
| Engineering / Construction | 4 | $72B |
|
||
| Energy Services | 3 | $60B |
|
||
| Utilities | 3 | $41B |
|
||
| Healthcare | 2 | $330B |
|
||
Price history
3 events — show timeline
- 2026-04-15 Listed $155,000 NTREIS
- 2015-07-13 Sold (Public Records) — Public Records
- 1999-02-22 Sold (Public Records) — Public Records
Property tax history
+7.7%/yrLatest (2025): $2,962 · +1.9% YoY. Source: county tax records.
Cash-flow waterfall
monthlySold comps — $/sqft
last 12 mo · ≤1 miLoading sold comps…