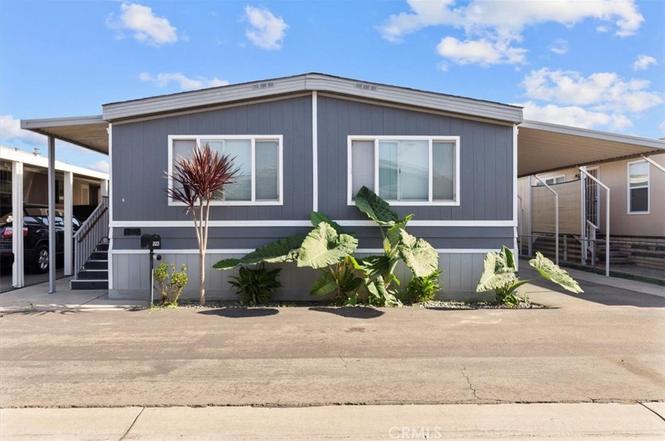
9080 Bloomfield Ave #223 · Cypress, CA
Flood risk 1/10 · Minimal
- FEMA flood zone
- X
- Chance of flooding over 30 yrs
- 0.0%
- Est. flood insurance / yr
- $507 – $1,088
Fire risk 1/10 · Minimal
- Est. fire insurance / yr
- $659 – $1,223
Heat risk 5/10 · Moderate
- Hot days now (above 89°F)
- 7 days/yr
- Hot days in 30 yrs
- 24 days/yr
Wind risk 1/10 · Minimal
- Chance of severe wind over 30 yrs
- —
Air-quality risk 5/10 · Moderate
- Unhealthy air days now
- 7 days/yr
- Unhealthy air days in 30 yrs
- 9 days/yr
Risk factors via First Street. Map © Google.
Why this score? — see what drove the B grade
The composite is a weighted blend of 9 inputs, each scored 0–100. Each bar is that input's sub-score; the figure is the points it added to the 100-point composite (weight × sub-score).
- Cash flow +30.0/30.0
- 1% rule +10.0/10.0
- DSCR +10.0/10.0
- ARV discount +8.7/15.0
- Schools +6.2/10.0
- Livability +3.7/5.0
- Rent growth +2.9/5.0
- Condition / age +2.5/5.0
- Appreciation +0.0/10.0
$185,000
🖨 Deal sheet 📄 Offer letter ✓ Due diligence
Listing remarks
9080 Bloomfield Ave, Space 223 Cypress, CA 90630 Updated 2-bedroom plus den manufactured home in Lincoln Center Mobile Estates in Cypress featuring an open floor plan, abundant natural light, and modern interior finishes. Recent improvements include new flooring, fresh interior paint, and an upgraded kitchen with updated cabinetry, sleek countertops, and ample storage. The spacious layout offers comfortable living areas with an open living and dining space designed for everyday living and entertaining. The den provides flexible space that can function as a home office, guest room, hobby room, or additional living area. Exterior features include a spacious lot with room to relax or garden
Key facts
- Brand-new flooring
- Versatile den
- Upgraded kitchen
Tags
Property features AI
Finance
- Other: Manager approval required for residency; Pets allowed with size, number and breed restrictions; cats may be allowed; Built by Goldenwest
- Financial info: Rent includes pool
- HOA & community: Land lease community (Lincoln Center); Land lease amount $2,600 per month (park provided)
Exterior
- Parking: Located in Lincoln Center park
- Utilities: Public sewer; District/public water
- Home design: Single-story mobile home (12' x 60'); Mobile home remains on property
- Construction: Built year source: Seller
- Exterior features: Private and community pool; Dog park on site
Interior
- Kitchen: Gas oven
- Bathrooms: 2 full bathrooms
- Interior features: One-level home; Entry on main level
- Laundry & utility: Laundry in individual room
Neighborhood map
What this means for you Summary
Snapshot
- This is a 2-bed/2.0-bath manufactured listed at $185k.
Deal economics
- At list price, monthly cash flow is $1k ($16k/yr) — positive.
- The deal already cash-flows at list — no discount required.
- Meets the 1% rule at list price ($3k rent vs $185k).
- Recommended offer: $163k (12.0% below list) — sets the bar for market timing.
- Cap rate 14.8% vs local median 2.2% in Cypress — top-decile yield for the area; either an underpriced asset or a hidden risk that comps aren't pricing in. Stress-test before assuming the spread holds.
Location & tenants
- Location reads 74/100 on livability (#141 in CA, #4,900 nationally) — a middle-class / working-renter tenant base. Strengths: schools A+, employment A+, commute A; Watch: health & safety D, cost of living F.
- Cypress Elementary (suburban): math 67% / reading 69% proficiency, ranked #117 of 1,400 in CA (top 8%) — acceptable for families but not a draw, mixed tenant base, ~2y average lease.
- Market conditions: Rents rising (+1.7%/yr); 70 active listings in the ZIP; 30 comparable units currently listed for rent nearby; rentals leasing fast (median 11d on market — plan ~1-2 weeks tenant-placement turnaround); high-income renter base; 6,974 units permitted in Orange County in 2024 (3,839 in 5+ unit buildings).
- This rent runs 30% of the median local income ($130k/yr) — at the standard rent-burdened threshold; future hikes will face affordability resistance.
Forward outlook
- Local home prices are declining (-3.0%/yr); year-one equity from $1k of loan paydown is wiped out by about $6k of value loss. Plan a longer hold.
- Orange County population projected at +14% by 2050 — modest demand growth; plan on rents tracking national, not racing it.
- At projected returns (-3.0% appreciation + 1.7% rent growth), your $52k cash investment doubles in ~5 years — after that, you're playing with house money.
Negotiation context
- It's been on market 201 days — a 12% lower offer ($163k) is reasonable based on typical stale-listing flexibility.
- 6 sale attempts since 12y ago with the ask held roughly flat each time — persistent listings suggest the price (not the market) is what's stuck; bring a comps-based counter.
Risks & watch-outs
- Climate carrying-cost: extreme-heat days projected 7→24/yr by 2055 (HVAC capex compounding) — expect insurance premiums to compound above CPI over the hold.
Questions for the listing agent
- It's been on market 201 days. Have you received any prior offers? Is the seller open to a 12% concession, seller financing, or rate buy-down credit?
- Built in 1973 — when were the roof, HVAC, electrical panel, plumbing, and water heater last replaced?
- Why hasn't it sold? Are there any deal-killer items the seller is aware of (foundation, flood, title, zoning, code violations)?
- Is there a deadline driving the sale (1031 exchange, divorce, estate, relocation)? That informs how much negotiation room exists.
- Schools are A-rated — typically a magnet for longer-tenancy family renters. What's the average tenant stay here, and is there a school-zone premium baked into asking?
- What's the average days-on-market for RENTAL listings here right now (not sales)? A rising rental-DOM trend means longer vacancies and softer asking-rent achievability than the comps imply.
- What's the recent tenant-quality profile in this submarket — average credit score on applications, eviction rate, late-payment / NSF rate, and stable-employment percentage? A property-management company in the area should have these aggregated.
- How much new for-sale + rental construction is in the pipeline within 1–3 miles? Heavy new supply typically softens prices + rents 12–24 months out; constrained supply supports both.
Investment metrics
- 1% rule
- 1.77% ✓
- Cap rate
- 14.82%
- Cash-on-cash
- 30.44%
- DSCR
- 2.35
- GRM
- 4.7
CMA / ARV
- ARV (on-the-fly)
- $190,080
- Comps found
- 12
Show comp detail 12 sales within ~0.75 mi
| Address | Dist | Beds/Ba | Sqft | Sold | Price | $/sf | Match |
|---|---|---|---|---|---|---|---|
| 9080 Bloomfield Ave #237 | 0.00mi | 3/2.0 (+1) | 1,408 (-2%) | 4mo | $130,000 | $92 | 88 |
| 9080 Bloomfield Ave #192 | 0.12mi | 3/2.0 (+1) | 1,434 (-0%) | 11mo | $218,000 | $152 | 80 |
| 9080 Bloomfield Ave #270 | 0.00mi | 3/2.0 (+1) | 1,580 (+10%) | 1mo | $215,000 | $136 | 78 |
| 22221 Bloomfield Ave #47 | 0.26mi | 2/2.0 | 1,344 (-7%) | 1mo | $275,000 | $205 | 76 |
| 9080 Bloomfield Ave #230 | 0.00mi | 3/2.0 (+1) | 1,272 (-12%) | 1mo | $159,900 | $126 | 74 |
| 22221 Bloomfield #11 | 0.26mi | 2/2.0 | 1,344 (-7%) | 3mo | $200,000 | $149 | 74 |
| 9080 Bloomfield Ave #209 | 0.00mi | 3/2.0 (+1) | 1,248 (-13%) | 3mo | $129,000 | $103 | 71 |
| 9080 Bloomfield Ave #44 | 0.00mi | 3/2.0 (+1) | 1,596 (+11%) | 12mo | $199,000 | $125 | 67 |
| 9080 Bloomfield Ave #11 | 0.00mi | 3/2.0 (+1) | 1,635 (+14%) | 8mo | $210,000 | $128 | 66 |
| 22221 Bloomfield Ave #48 | 0.34mi | 2/2.0 | 1,536 (+7%) | 9mo | $189,900 | $124 | 66 |
| 9080 Bloomfield Ave #193 | 0.00mi | 3/2.0 (+1) | 1,248 (-13%) | 10mo | $165,000 | $132 | 65 |
| 9080 Bloomfield Ave #122 | 0.00mi | 3/2.0 (+1) | 1,248 (-13%) | 10mo | $168,000 | $135 | 65 |
Match score weights: distance 35% · size 25% · config 20% · recency 20%. Top-matched comps best support the ARV.
Projected returns pro-forma
-3.0% appreciation · 1.69% rent growth · sell at horizon
- IRR
- 23.6%
- Equity multiple
- 1.96×
- Total profit
- $49,501
- Equity at exit
- $27,584
- IRR
- 30.7%
- Equity multiple
- 3.59×
- Total profit
- $134,016
- Equity at exit
- $15,995
Cash invested: $51,800 (down + closing). Projections, not guarantees.
Landlord ↔ Tenant lean methodology
- Overall (STATE)
- 18 Strongly Tenant-Friendly
- State California
- 18 Strongly Tenant-Friendly · D+13
- County
- — inherits STATE
- City
- — inherits STATE
ZIP-level market 90630
- Rents YoY
- 1.7%
- Active inventory
- 70
- Price-to-rent
- 4.7×
Monthly cashflow live
- Estimated rent
- $3,282 high interval (Pro) →
- Mortgage (P&I)
- −$970
- Tax est. 1.5%
- −$231 /mo · $2,775/yr
- Insurance
- −$77
- HOA
- −$0
- Vacancy / Maint / Mgmt
- −$689
- Net cashflow
- $1,314
Break-even live
UW: 25.0% down · 7.5% · 30yr · 1.5% tax · 5.0% vac · 8.0% maint · 8.0% mgmt
Financing live
Cash to close
- Down payment
- $46,250
- Closing costs
- $5,550
- Reserves months
- —
- Total cash needed
- —
Loan-product check · same deal, 3 products live
Conventional
25% down · 7.5% · 30yr
- Down + closing
- —
- Monthly P&I
- —
- Monthly cashflow
- —
- DSCR
- —
- Eligible?
- —
Personal DTI + credit; lowest rate.
DSCR
20% down · 8.5% · 30yr
- Down + closing
- —
- Monthly P&I
- —
- Monthly cashflow
- —
- DSCR
- —
- Eligible?
- —
No personal income docs; deal must DSCR.
Hard money
10% down · 12.0% · 12mo
- Down + closing
- —
- Monthly P&I
- —
- Monthly cashflow
- —
- DSCR
- —
- Eligible?
- —
Short-term bridge; refi at stabilization.
Rent comps 30 comps
| Address | Beds | Baths | Sqft | Rent | $/sqft | DOM | Units | Dist |
|---|---|---|---|---|---|---|---|---|
| 4455 Casa Grande Cir Cypress, CA | 1.0–2.0 | 1.0–1.5 | 811 | $2,837 | $3.50 | 1d | 6 | 0.20mi |
| 4550 Lincoln Ave Cypress, CA | 1.0–2.0 | 1.0–2.0 | 860 | $3,225 | $3.75 | 1d | 3 | 0.36mi |
| 8381 E Blithedale St Long Beach, CA | 3.0 | 2.0 | 1314 | $3,600 | $2.74 | 2d | 1 | 0.50mi |
| 12750 Centralia St Lakewood, CA | 2.0 | 1.0–1.5 | 1056 | $3,350 | $3.17 | 4d | 2 | 0.52mi |
| 12750 Centralia St #43 Lakewood, CA | 2.0 | 1.5 | 1056 | $3,500 | $3.31 | 17d | 1 | 0.55mi |
| 9424 Ethel St Cypress, CA | 3.0 | 2.5 | 1780 | $4,300 | $2.42 | 15d | 1 | 0.65mi |
| 9306 Gregory St Cypress, CA | 3.0 | 2.5 | 1840 | $4,500 | $2.45 | 18d | 1 | 0.66mi |
| 22003 Belshire Ave #9 Hawaiian Gardens, CA | 2.0 | 2.0 | 1140 | $2,900 | $2.54 | 44d | 1 | 0.66mi |
| 4801 Merten Ave Cypress, CA | 3.0 | 2.0 | 1500 | $3,875 | $2.58 | 1d | 1 | 0.70mi |
| 4812 Grace Ave Unit C Cypress, CA | 2.0 | 2.0 | 900 | $2,395 | $2.66 | 13d | 1 | 0.80mi |
| 8120 E Turbo St Long Beach, CA | 3.0 | 1.5 | 1120 | $3,900 | $3.48 | 44d | 1 | 0.81mi |
| 8561 Belmont St Unit 6 Cypress, CA | 3.0 | 2.5 | 1265 | $3,695 | $2.92 | 1d | 1 | 0.85mi |
| 8561 Belmont St Unit 7 Cypress, CA | 3.0 | 2.0 | 1320 | $4,145 | $3.14 | 10d | 1 | 0.85mi |
| 20817 Ely Ave Lakewood, CA | 3.0 | 1.0 | 1102 | $3,550 | $3.22 | 2d | 1 | 0.98mi |
| 21526 Juan Ave Hawaiian Gardens, CA | 2.0 | 2.0 | 1200 | $3,000 | $2.50 | 24d | 1 | 0.99mi |
| 12050 226th St Hawaiian Gardens, CA | 3.0 | 2.0 | 1063 | $3,100 | $2.92 | 44d | 1 | 1.03mi |
| 12610 Vandemere St Lakewood, CA | 3.0 | 2.0 | 1056 | $8,250 | $7.81 | 1d | 1 | 1.05mi |
| 12350 Del Amo Blvd Lakewood, CA | 1.0–3.0 | 1.0–2.0 | 866 | $2,616 | $3.02 | 2d | 27 | 1.24mi |
| 5475 Villa Way #34 Cypress, CA | 3.0 | 2.5 | 1374 | $3,600 | $2.62 | 3d | 1 | 1.24mi |
| 5477 Twin Lakes Dr Cypress, CA | 2.0 | 1.0 | 1156 | $2,495 | $2.16 | 1d | 1 | 1.25mi |
| 4002 Bryant Ct Cypress, CA | 3.0 | 1.5 | 1046 | $3,400 | $3.25 | 22d | 1 | 1.25mi |
| 10002 Saint Stephen Cir Cypress, CA | 3.0 | 1.5 | 1205 | $3,700 | $3.07 | 17d | 1 | 1.25mi |
| 8626 Watson St Unit 8650-E Cypress, CA | 2.0 | 1.0 | 900 | $2,350 | $2.61 | 10d | 1 | 1.29mi |
| 8626 Watson St Unit 8644 Cypress, CA | 2.0 | 1.0 | 900 | $2,450 | $2.72 | 1d | 1 | 1.29mi |
| 8791 Walker St Cypress, CA | 1.0–2.0 | 1.0 | 830 | $2,535 | $3.05 | 1d | 8 | 1.30mi |
| 12022 207th St Lakewood, CA | 3.0 | 2.0 | 1088 | $3,950 | $3.63 | 7d | 1 | 1.31mi |
| 12022 207th St Lakewood, CA | 3.0 | 2.0 | 1088 | $3,950 | $3.63 | 24d | 1 | 1.31mi |
| 21525 Pioneer Blvd Lakewood, CA | 2.0 | 2.0 | 910 | $2,595 | $2.85 | 44d | 1 | 1.37mi |
| 20726 Seine Ave Lakewood, CA | 3.0 | 2.0 | 1354 | $3,400 | $2.51 | 21d | 1 | 1.41mi |
| 20810 Arline Ave Apt 14 Lakewood, CA | 2.0 | 1.5 | 896 | $2,495 | $2.78 | 44d | 1 | 1.47mi |
Listing history 24 events
-
2026-06-18days on market $185,000 Active 201 DOM
-
2026-06-17days on market $185,000 Active 200 DOM
-
2026-06-16days on market $185,000 Active 199 DOM
-
2026-06-15days on market $185,000 Active 198 DOM
-
2026-06-13days on market $185,000 Active 196 DOM
-
2026-06-13days on market $185,000 Active 195 DOM
-
2026-06-09days on market $185,000 Active 192 DOM
-
2026-06-08days on market $185,000 Active 191 DOM
-
2026-06-07days on market $185,000 Active 190 DOM
-
2026-06-04days on market $185,000 Active 187 DOM
-
2026-06-03days on market $185,000 Active 186 DOM
-
2026-06-02days on market $185,000 Active 185 DOM
-
2026-06-01days on market $185,000 Active 184 DOM
-
2026-05-31days on market $185,000 Active 183 DOM
-
2026-03-14price $185,000
-
2025-11-29$184,900 Active
-
2025-09-22historical
-
2025-02-24$193,000 Active
-
2022-12-22historical
-
2022-12-20status Active
-
2022-11-19status Active
-
2022-09-23$160,000 Active
-
2015-01-30historical
-
2014-10-28$35,000 Active
ⓘ Source: listings_history table (triggers on properties + properties_extension) + one-shot
backfill from property_details.listing_events for pre-trigger history.
Climate risk First Street
- Flood 1/10 Low FEMA zone X · 0% chance over 30 yrs
- Wildfire 1/10 Low
- Heat 5/10 Major 7 d/yr ≥89°F today · 24 d/yr by 30 yrs out
- Wind 1/10 Low
- Air quality 5/10 Major 7 unhealthy d/yr today · 9 by 30 yrs out
Nearby sold comps map
Loading sold comps map…
Walkable amenities ~0.75 mi
Loading nearby amenities…
Taxation est. · year 1
- Rental income
- $39,382
- − Mortgage interest
- −$10,363
- − Property taxes
- −$2,775
- − Insurance
- −$925
- − Repairs & maintenance
- −$3,151
- − Management
- −$3,151
- − Depreciation
- −$5,382
- Taxable income
- $13,636
- Est. tax owed @ 24.0%
- −$3,273
- After-tax cash flow
- $12,497/yr
For passive investors: Depreciation is non-cash, so a rental often shows a tax loss while cash-flowing — sheltering income. Rental losses are passive: they offset passive income freely, and up to $25,000/yr can offset ordinary (W-2) income if you actively participate and your MAGI is under $100k (phasing out to $0 by $150k); unused losses carry forward. On sale, claimed depreciation is recaptured at up to 25%, and gains may owe capital-gains tax (a 1031 exchange can defer both). Figures are a year-1 estimate at your 24.0% rate — not tax advice; consult a CPA.
Schools (NCES district)
- District
- Cypress Elementary
- NCES district ID
- 0610440
- Math proficiency
- 67% ▲ 1.00%
- Reading proficiency
- 69% ▲ 1.00%
- Median HH income
- $83,769
- Composite
- 62.21/100
- National rank
- #1446
- State rank
- #117 of 1400 in CA
Livability — Cypress
- Score
- 74/100
- State rank
- #141
- US rank
- #4900
Category grades
Schools grade is shown separately in the Schools card above.
Census & demographics
- Census place
- Cypress, CA
- County
- Orange County · 3,096,323 people
- City population
- 49,318
- Metro
- Los Angeles-Long Beach-Anaheim, CA
- Population (ZIP)
- 49,318
- Household income
- $130,154
- Rent vs Own
- Severe rent burden
- 1431.0
Population outlook (Orange County) Hauer SSP2
- Today (2025)
- 3,477,456 people
- By 2030
- 3,613,117 · +3.9%
- By 2040
- 3,835,945 · +10.3%
- By 2050
- 3,968,736 · +14.1%
- By 2075
- 4,097,053 · +17.8%
- By 2100
- 3,903,633 · +12.3%
Race, ethnicity, and origin ACS 2023
- Neighborhood character
- Highly diverse neighborhood (Simpson 0.71)
- Race & ethnicity
- Asian 37% White 31% Hispanic / Latino 22% Two or more races 14% Black 3%
- Hispanic origin (detail)
- Mexican 15%
- Common ancestry
- Lithuanian 2% Iranian 1% Italian 1%
- Foreign-born
- 31% · South Korea, Canada, China
- Languages at home
- 57% English-only · Spanish 12% Korean 11% Chinese 5%
Political lean MEDSL · Orange
- 2024 margin
- Toss-up / Even · D 49.7% · R 47.1% · Other 3.2%
- 2008→2024 swing
- +5.2pp toward D · 2008: -2.6pp · 2024: 2.6pp
- All cycles
- 2024: D+2.6 2020: D+9.0 2016: D+7.7 2012: R+8.3 2008: R+2.6
Not yet ingested
- Civics
- —
Market trends
- HPI YoY
- ▼ -870.99%
- Current HPI
- 402.6083
- Rent YoY
- ▲ 1.69%
- Metro
- Los Angeles-Long Beach-Anaheim, CA
- State GDP YoY
- ▲ 3.21%
- F500 in state
- 116
Industry mix (Fortune 500 HQ in CA)
| Industry | F500 HQs | Revenue |
|---|---|---|
| Technology | 27 | $1,492B |
|
||
| Financial Services | 3 | $174B |
|
||
| Retail | 3 | $44B |
|
||
| Insurance | 3 | $26B |
|
||
| Media / Entertainment | 2 | $115B |
|
||
| Pharmaceuticals / Biotech | 2 | $62B |
|
||
Price history
+428.6% since first listed10 events — show timeline
- 2026-03-14 Price Changed $185,000 CRMLS
- 2025-11-29 Listed $184,900 CRMLS
- 2025-09-22 Listing Removed — CRMLS
- 2025-02-24 Listed $193,000 CRMLS
- 2022-12-22 Listing Removed — CRMLS
- 2022-12-20 Relisted — CRMLS
- 2022-11-19 Relisted — CRMLS
- 2022-09-23 Listed $160,000 CRMLS
- 2015-01-30 Listing Removed — CRMLS
- 2014-10-28 Listed $35,000 CRMLS
Property tax history
+0.2%/yrLatest (2025): $68 · +2.6% YoY. Source: county tax records.
Cash-flow waterfall
monthlySold comps — $/sqft
last 12 mo · ≤1 miLoading sold comps…