 Multi-family
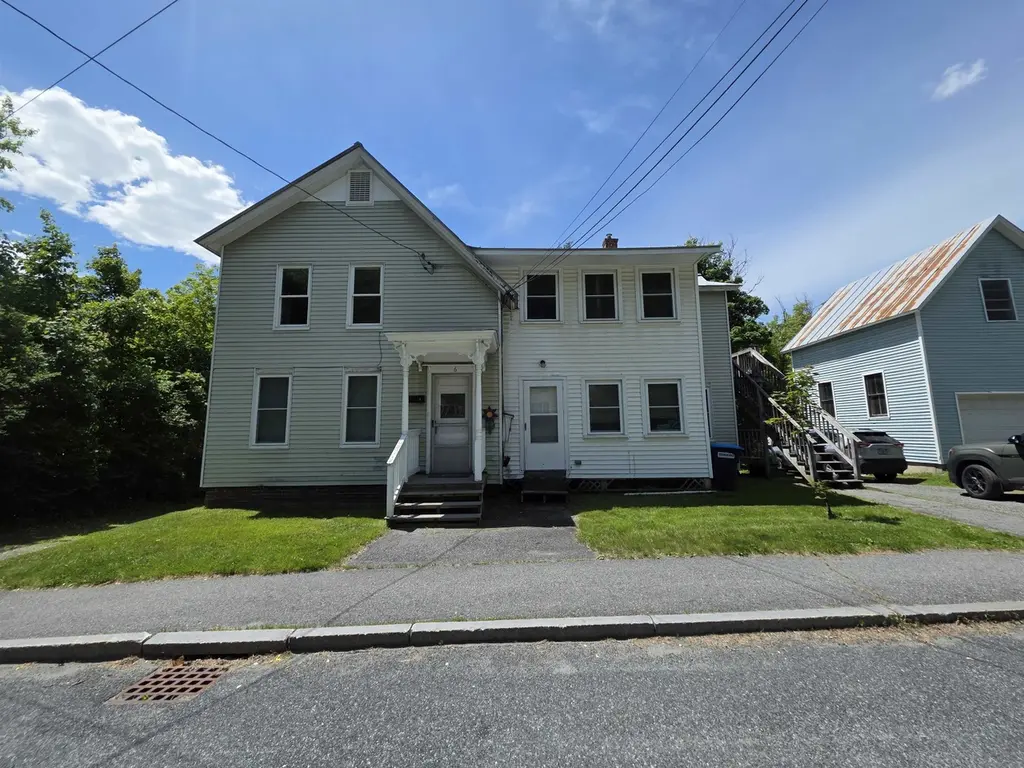
6 Pine St · Lebanon, NH
Flood risk 10/10 · Severe
- FEMA flood zone
- X (unshaded)
- Chance of flooding over 30 yrs
- 0.99%
- Est. flood insurance / yr
- $473 – $860
Fire risk 1/10 · Minimal
- Est. fire insurance / yr
- $507 – $941
Heat risk 3/10 · Minor
- Hot days now (above 91°F)
- 7 days/yr
- Hot days in 30 yrs
- 17 days/yr
Wind risk 2/10 · Minimal
- Chance of severe wind over 30 yrs
- 5.0%
Air-quality risk 1/10 · Minimal
- Unhealthy air days now
- 0 days/yr
- Unhealthy air days in 30 yrs
- 0 days/yr
Risk factors via First Street. Map © Google.
Why this score? — see what drove the C+ grade
The composite is a weighted blend of 9 inputs, each scored 0–100. Each bar is that input's sub-score; the figure is the points it added to the 100-point composite (weight × sub-score).
- Cash flow +25.5/30.0
- DSCR +8.4/10.0
- 1% rule +7.2/10.0
- ARV discount +4.9/15.0
- Schools +4.7/10.0
- Rent growth +4.2/5.0
- Livability +3.4/5.0
- Condition / age +2.5/5.0
- Appreciation +0.0/10.0
$399,000
🖨 Deal sheet 📄 Offer letter ✓ Due diligence
Multi-family units
County records classify this as Multi-Family (2-4 Unit). Listing-text estimate: 1 unit. estimate disagrees with records
Listing remarks MLS
TENANT LEASE UNTIL 8/03, LEVEL BACKYARD, SEPARATE DRIVEWAYS FOR EACH UNIT, NEW STOVES IN 2002. THIS HOUSE IS IN GOOD SHAPE.
Key facts
- Ample natural light
- Easy access to i-89
- Functional layouts
Tags
Property features AI
Finance
- Financial info: Operating expenses include insurance, maintenance, snow removal, trash, and water/sewer; Property configured as two annual-lease units
Exterior
- Parking: Gravel driveway
- Utilities: Public water; Public sewer; Electric: 100 Amp service with circuit breakers; High-speed internet available
- Home design: Multi-family building; Existing construction; Built in 1860
- Construction: Wood frame construction; Asphalt shingle roof; Basement foundation (concrete floor)
- Exterior features: Level lot in town
Interior
- Kitchen: No specific kitchen appliance list provided
- Bedrooms: Two 2-bedroom units (Unit 1 on level 1; Unit 2 on level 2)
- Flooring: Hardwood; Laminate; Vinyl plank
- Bathrooms: Two full bathrooms (one in each unit)
- Heating & cooling: Propane heating with baseboard units; No central cooling
- Interior features: Walk-up basement with concrete floor, interior stairs, unfinished; Multi-family layout (2 units)
- Laundry & utility: Water heater: gas (LP/Bottle)
Neighborhood map
What this means for you Summary
Snapshot
- This is a 4-bed/2.0-bath multifamily listed at $399k.
Deal economics
- At list price, monthly cash flow is $874 ($10k/yr) — positive.
- The deal already cash-flows at list — no discount required.
- Meets the 1% rule at list price ($5k rent vs $399k).
- Cap rate 9.1% vs local median 2.2% in Lebanon — top-decile yield for the area; either an underpriced asset or a hidden risk that comps aren't pricing in. Stress-test before assuming the spread holds.
Location & tenants
- Location reads 68/100 on livability (#59 in NH) — a middle-class / working-renter tenant base. Strengths: employment A+, housing A+, crime A; Watch: health & safety D, amenities F, commute F.
- Lebanon School District (town): math 48% / reading 60% proficiency, ranked #26 of 98 in NH (top 26%) — acceptable for families but not a draw, mixed tenant base, ~2y average lease.
- Market conditions: Rents rising fast (+6.6%/yr); 43 active listings in the ZIP; 1 comparable units currently listed for rent nearby; solid renter incomes; 487 units permitted in Grafton County in 2024 (127 in 5+ unit buildings).
- At $4,871/mo this rent would consume 58% of the median local household income ($101k/yr) (locally 488% of renters already pay >50% of income on rent) — very limited rent-growth headroom before tenants either downsize or default.
Forward outlook
- Local home prices are declining (-3.0%/yr); year-one equity from $3k of loan paydown is wiped out by about $12k of value loss. Plan a longer hold.
- Grafton County population projected at -13% by 2050 — secular population decline; favor cash flow + early exit over multi-decade hold.
- At projected returns (-3.0% appreciation + 6.6% rent growth), your $112k cash investment doubles in ~8 years — after that, you're playing with house money.
Negotiation context
- Only 2 days on market — expect competitive offers; lowballing is unlikely to land.
- 4 sale attempts since 23y ago with the ask held roughly flat each time — persistent listings suggest the price (not the market) is what's stuck; bring a comps-based counter.
- Current owner paid $215k; list at $399k implies a 86% gain — meaningful room to come down on a strong offer.
Risks & watch-outs
- Watch-outs: flood insurance adds $56/mo; built in 1860 — expect roof / HVAC / electrical / plumbing capex.
- Climate carrying-cost: severe flood risk — expect insurance premiums to compound above CPI over the hold.
Questions for the listing agent
- Built in 1860 — when were the roof, HVAC, electrical panel, plumbing, and water heater last replaced?
- What's the actual annual flood-insurance premium (NFIP or private), and is the property in a SFHA with mandatory coverage?
- Is there a deadline driving the sale (1031 exchange, divorce, estate, relocation)? That informs how much negotiation room exists.
- Schools are B-rated — typically a magnet for longer-tenancy family renters. What's the average tenant stay here, and is there a school-zone premium baked into asking?
- What's the average days-on-market for RENTAL listings here right now (not sales)? A rising rental-DOM trend means longer vacancies and softer asking-rent achievability than the comps imply.
- What's the recent tenant-quality profile in this submarket — average credit score on applications, eviction rate, late-payment / NSF rate, and stable-employment percentage? A property-management company in the area should have these aggregated.
- How much new apartment / multifamily construction is in the pipeline within 1–3 miles? Heavy new supply (>2% of stock underway) typically softens rents 12–24 months out; light construction supports rent growth.
Investment metrics
- 1% rule
- 1.22% ✓
- Cap rate
- 9.09%
- Cash-on-cash
- 9.98%
- DSCR
- 1.44
- GRM
- 6.8
CMA / ARV
- ARV (on-the-fly)
- $377,160
- Comps found
- 1
Show comp detail 1 sale within ~0.75 mi
| Address | Dist | Beds/Ba | Sqft | Sold | Price | $/sf | Match |
|---|---|---|---|---|---|---|---|
| 24 Parkhurst St | 0.37mi | 4/3.0 | 1,674 (-7%) | 10mo | $352,000 | $210 | 59 |
Match score weights: distance 35% · size 25% · config 20% · recency 20%. Top-matched comps best support the ARV.
Projected returns pro-forma
-3.0% appreciation · 6.6% rent growth · sell at horizon
- IRR
- 2.1%
- Equity multiple
- 1.08×
- Total profit
- $9,476
- Equity at exit
- $59,492
- IRR
- 15.1%
- Equity multiple
- 2.45×
- Total profit
- $161,530
- Equity at exit
- $34,498
Cash invested: $111,720 (down + closing). Projections, not guarantees.
Landlord ↔ Tenant lean methodology
- Overall (STATE)
- 56 Moderately Landlord-Leaning
- State New Hampshire
- 56 Moderately Landlord-Leaning · D+1
- County
- — inherits STATE
- City
- — inherits STATE
ZIP-level market 03766
- Home prices YoY
- -10.6%
- Rents YoY
- 6.6%
- Active inventory
- 43
- Price-to-rent
- 13.7×
Monthly cashflow live
- Estimated rent
- $4,871 medium interval (Pro) →
- Mortgage (P&I)
- −$2,092
- Tax from tax record
- −$660 /mo · $7,923/yr
- Insurance
- −$166
- Flood insurance flood zone
- −$56 /mo · $666/yr
- HOA
- −$0
- Vacancy / Maint / Mgmt
- −$1,023
- Net cashflow
- $874
Break-even live
2-unit breakdown (identical units grouped — click to expand)
| Units | Beds | Baths | Est. rent |
|---|---|---|---|
| 2× units | 2 | 1 | $4,870 |
| #1 | 2 | 1 | $2,435 |
| #2 | 2 | 1 | $2,435 |
| Total (2 units) | $4,871 | ||
UW: 25.0% down · 7.5% · 30yr · 1.5% tax · 5.0% vac · 8.0% maint · 8.0% mgmt
Financing live
Cash to close
- Down payment
- $99,750
- Closing costs
- $11,970
- Reserves months
- —
- Total cash needed
- —
Loan-product check · same deal, 3 products live
Conventional
25% down · 7.5% · 30yr
- Down + closing
- —
- Monthly P&I
- —
- Monthly cashflow
- —
- DSCR
- —
- Eligible?
- —
Personal DTI + credit; lowest rate.
DSCR
20% down · 8.5% · 30yr
- Down + closing
- —
- Monthly P&I
- —
- Monthly cashflow
- —
- DSCR
- —
- Eligible?
- —
No personal income docs; deal must DSCR.
Hard money
10% down · 12.0% · 12mo
- Down + closing
- —
- Monthly P&I
- —
- Monthly cashflow
- —
- DSCR
- —
- Eligible?
- —
Short-term bridge; refi at stabilization.
Rent comps 1 comps
| Address | Beds | Baths | Sqft | Rent | $/sqft | DOM | Units | Dist |
|---|---|---|---|---|---|---|---|---|
| 3 Kinne St Unit A Lebanon, NH | 3.0 | 1.0 | 1400 | $3,200 | $2.29 | 43d | 1 | 1.14mi |
Listing history 9 events
-
2026-06-19days on market $399,000 Active 2 DOM
-
2026-06-17days on market $399,000 Active 1 DOM
-
2026-06-17days on market $399,000 Active 9 DOM
-
2026-06-16days on market $399,000 Active 8 DOM
-
2026-06-15days on market $399,000 Active 7 DOM
-
2026-06-14days on market $399,000 Active 5 DOM
-
2026-06-12days on market $399,000 Active 4 DOM
-
2026-06-09remarks 699-char remark
-
2026-06-09$399,000 Active 1 DOM
ⓘ Source: listings_history table (triggers on properties + properties_extension) + one-shot
backfill from property_details.listing_events for pre-trigger history.
Tax reassessment forecast NH · Partial reset (capped growth)
- Current annual tax
- $7,923 · $660/mo
- Projected year-2 tax
- $8,311 · $693/mo
- Expected delta
- +$388/yr (+$32/mo · 4.9%)
ⓘ Screening estimate from a state-policy table — verify with the county assessor before closing.
Climate risk First Street
- Flood 10/10 Extreme FEMA zone X (unshaded) · 99% chance over 30 yrs
- Wildfire 1/10 Low
- Heat 3/10 Moderate 7 d/yr ≥91°F today · 17 d/yr by 30 yrs out
- Wind 2/10 Low 5% chance of damaging wind over 30 yrs
- Air quality 1/10 Low 0 unhealthy d/yr today · 0 by 30 yrs out
Nearby sold comps map
Loading sold comps map…
Walkable amenities ~0.75 mi
Loading nearby amenities…
Taxation est. · year 1
- Rental income
- $58,452
- − Mortgage interest
- −$22,350
- − Property taxes
- −$7,923
- − Insurance
- −$2,662
- − Repairs & maintenance
- −$4,676
- − Management
- −$4,676
- − Depreciation
- −$11,607
- Taxable income
- $4,558
- Est. tax owed @ 24.0%
- −$1,094
- After-tax cash flow
- $9,390/yr
For passive investors: Depreciation is non-cash, so a rental often shows a tax loss while cash-flowing — sheltering income. Rental losses are passive: they offset passive income freely, and up to $25,000/yr can offset ordinary (W-2) income if you actively participate and your MAGI is under $100k (phasing out to $0 by $150k); unused losses carry forward. On sale, claimed depreciation is recaptured at up to 25%, and gains may owe capital-gains tax (a 1031 exchange can defer both). Figures are a year-1 estimate at your 24.0% rate — not tax advice; consult a CPA.
Schools (NCES district)
- District
- Lebanon School District
- NCES district ID
- 3304230
- Math proficiency
- 48% ▼ -12.00%
- Reading proficiency
- 60% ▼ -6.00%
- Median HH income
- $56,648
- Composite
- 46.7/100
- National rank
- #2401
- State rank
- #26 of 98 in NH
Livability — Lebanon
- Score
- 68/100
- State rank
- #59
- US rank
- #9879
Category grades
Schools grade is shown separately in the Schools card above.
Census & demographics
- Census place
- Lebanon, NH
- County
- Grafton County · 11,195 people
- City population
- 11,195
- Metro
- Lebanon, NH-VT
- Population (ZIP)
- 11,195
- Household income
- $100,881
- Rent vs Own
- Severe rent burden
- 488.0
Population outlook (Grafton County) Hauer SSP2
- Today (2025)
- 88,798 people
- By 2030
- 87,131 · -1.9%
- By 2040
- 82,000 · -7.7%
- By 2050
- 77,064 · -13.2%
- By 2075
- 68,769 · -22.6%
- By 2100
- 61,631 · -30.6%
Race, ethnicity, and origin ACS 2023
- Neighborhood character
- Predominantly White (87%)
- Race & ethnicity
- White 87% Asian 5% Two or more races 4% Hispanic / Latino 3%
- Common ancestry
- Lithuanian 9% Slovak 4% Romanian 4%
- Foreign-born
- 9% · China, Canada
- Languages at home
- 89% English-only · Other Indo-European 3% Spanish 2% French/Haitian/Cajun 1%
Political lean MEDSL · Grafton
- 2024 margin
- D (+19.9) · D 59.4% · R 39.4% · Other 1.2%
- 2008→2024 swing
- -7.8pp toward R · 2008: 27.7pp · 2024: 19.9pp
- All cycles
- 2024: D+19.9 2020: D+24.6 2016: D+19.0 2012: D+23.8 2008: D+27.7
Not yet ingested
- Civics
- —
Market trends
- HPI YoY
- ▼ -43.72%
- Current HPI
- 368.6264
- Rent YoY
- ▲ 6.60%
- Metro
- Lebanon, NH-VT
- State GDP YoY
- —
- F500 in state
- 0
Price history
+121.8% since first listed13 events — show timeline
- 2026-06-08 Listed $399,000 PrimeMLS
- 2026-04-02 Rental Removed $1,895 SHOWMOJO
- 2026-03-04 Price Changed $1,895 SHOWMOJO
- 2026-02-15 Listed for Rent $1,950 SHOWMOJO
- 2019-07-15 Sold (MLS) $215,000 PrimeMLS
- 2019-06-26 Sold (Public Records) $215,000 Public Records
- 2019-04-28 Contingent — PrimeMLS
- 2019-04-19 Price Changed $225,000 PrimeMLS
- 2019-04-05 Listed $235,000 PrimeMLS
- 2003-08-21 Sold (Public Records) $176,000 Public Records
- 2003-08-20 Sold (MLS) $176,000 PrimeMLS
- 2003-06-10 Delisted — PrimeMLS
- 2003-04-24 Listed $179,900 PrimeMLS
Property tax history
+5.1%/yrLatest (2025): $7,923 · +6.3% YoY. Source: county tax records.
Cash-flow waterfall
monthlySold comps — $/sqft
last 12 mo · ≤1 miLoading sold comps…