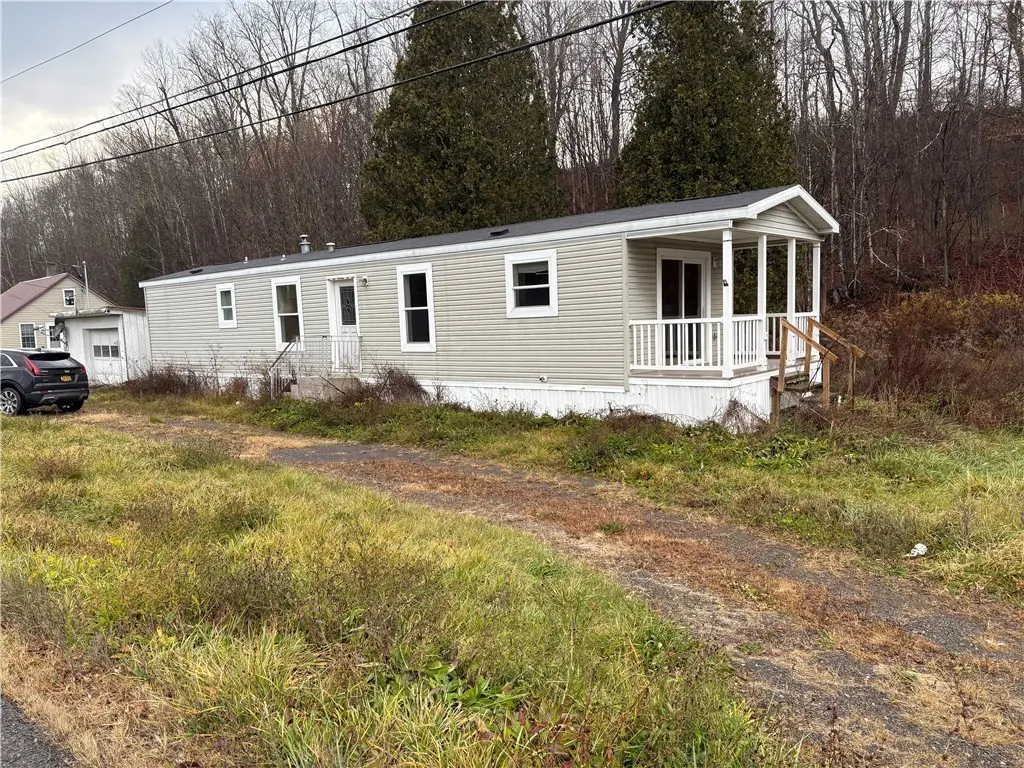
3195 State Highway 23 · Norwich, NY
Flood risk 9/10 · Severe
- FEMA flood zone
- X (unshaded)
- Chance of flooding over 30 yrs
- 0.99%
- Est. flood insurance / yr
- $473 – $860
Fire risk 1/10 · Minimal
- Est. fire insurance / yr
- $691 – $1,283
Heat risk 2/10 · Minimal
- Hot days now (above 90°F)
- 7 days/yr
- Hot days in 30 yrs
- 17 days/yr
Wind risk 2/10 · Minimal
- Chance of severe wind over 30 yrs
- 1.0%
Air-quality risk 1/10 · Minimal
- Unhealthy air days now
- 0 days/yr
- Unhealthy air days in 30 yrs
- 0 days/yr
Risk factors via First Street. Map © Google.
Why this score? — see what drove the C- grade
The composite is a weighted blend of 9 inputs, each scored 0–100. Each bar is that input's sub-score; the figure is the points it added to the 100-point composite (weight × sub-score).
- Cash flow +14.4/30.0
- Appreciation +10.0/10.0
- ARV discount +7.5/15.0
- DSCR +4.4/10.0
- 1% rule +3.9/10.0
- Schools +3.6/10.0
- Livability +3.5/5.0
- Rent growth +2.5/5.0
- Condition / age +2.5/5.0
$95,000
🖨 Deal sheet 📄 Offer letter ✓ Due diligence
Listing remarks MLS
2.39 Acres with 2016 year old Mobil Home 3 Bedrooms Nice Bright Open Kitchen-Living Room With Sliding Patio Door to Side Porch, Garage and Shed! Just Minutes to Norwich Also Tax Map #95.-1-21.5
Key facts
- 0.77 acre lot
- Garage
- Built 2016
Neighborhood map
What this means for you Summary
Snapshot
- This is a 2-bed/1.0-bath manufactured listed at $95k.
Deal economics
- At list price, monthly cash flow is $-36 ($-432/yr) — negative.
- To cash-flow at today's rent, offer at most $89k (6.7% below list).
- To meet the 1% rule (rent ≥ 1% of price), the offer needs to be $84k (11.4% below list).
- Recommended offer: $84k (12.0% below list) — sets the bar for market timing.
- Cap rate 6.5% vs local median 4.1% in Norwich — top-decile yield for the area; either an underpriced asset or a hidden risk that comps aren't pricing in. Stress-test before assuming the spread holds.
Location & tenants
- Location reads 70/100 on livability (#447 in NY) — a middle-class / working-renter tenant base. Strengths: cost of living A+, housing A+, health & safety A+; Watch: crime D, amenities F, commute F.
- Norwich City School District (town): math 42% / reading 43% proficiency, ranked #498 of 590 in NY (top 84%) — families likely to look elsewhere, expect single-tenant / working-renter base with shorter leases.
- Market conditions: 5 active listings in the ZIP; 151 units permitted in Chenango County in 2024 (96 in 5+ unit buildings).
Forward outlook
- In year one you build about $10k of equity ($657 loan paydown + $10k appreciation (10.0% local appreciation)).
- Chenango County population projected at -26% by 2050 — secular population decline; favor cash flow + early exit over multi-decade hold.
- At projected returns (10.0% appreciation + 3.0% rent growth), your $27k cash investment doubles in ~3 years — after that, you're playing with house money.
- By year 4, paydown + projected appreciation supports a ~$36k cash-out refi (75% LTV) — recoverable capital for the next deal without selling this one.
Negotiation context
- It's been on market 197 days — a 12% lower offer ($84k) is reasonable based on typical stale-listing flexibility.
- Current owner paid $5k; list at $95k implies a 1800% gain — meaningful room to come down on a strong offer.
Risks & watch-outs
- Watch-outs: flood insurance adds $56/mo.
- Climate carrying-cost: severe flood risk — expect insurance premiums to compound above CPI over the hold.
Questions for the listing agent
- What do current leases actually rent for vs. the listed asking? Can we see a recent rent roll and the last 12 months of T-12 income?
- It's been on market 197 days. Have you received any prior offers? Is the seller open to a 12% concession, seller financing, or rate buy-down credit?
- What's the actual annual flood-insurance premium (NFIP or private), and is the property in a SFHA with mandatory coverage?
- Why hasn't it sold? Are there any deal-killer items the seller is aware of (foundation, flood, title, zoning, code violations)?
- Is there a deadline driving the sale (1031 exchange, divorce, estate, relocation)? That informs how much negotiation room exists.
- Crime grade is D in this area — have there been break-ins, vandalism, or insurance claims at this property in the last 3 years? What carrier currently insures it and at what premium?
- What's the average days-on-market for RENTAL listings here right now (not sales)? A rising rental-DOM trend means longer vacancies and softer asking-rent achievability than the comps imply.
- What's the recent tenant-quality profile in this submarket — average credit score on applications, eviction rate, late-payment / NSF rate, and stable-employment percentage? A property-management company in the area should have these aggregated.
- How much new for-sale + rental construction is in the pipeline within 1–3 miles? Heavy new supply typically softens prices + rents 12–24 months out; constrained supply supports both.
Investment metrics
- 1% rule
- 0.89% ✗
- Cap rate
- 6.54%
- Cash-on-cash
- 0.88%
- DSCR
- 1.04
- GRM
- 9.4
CMA / ARV
No comps found within radius.
Projected returns pro-forma
10.0% appreciation · 3.0% rent growth · sell at horizon
- IRR
- 23.1%
- Equity multiple
- 2.86×
- Total profit
- $49,489
- Equity at exit
- $85,584
- IRR
- 20.6%
- Equity multiple
- 6.55×
- Total profit
- $147,618
- Equity at exit
- $184,564
Cash invested: $26,600 (down + closing). Projections, not guarantees.
Landlord ↔ Tenant lean methodology
- Overall (STATE)
- 15 Strongly Tenant-Friendly
- State New York
- 15 Strongly Tenant-Friendly · D+10
- County
- — inherits STATE
- City
- — inherits STATE
ZIP-level market 13844
- Home prices YoY
- 5.9%
- Active inventory
- 5
- Price-to-rent
- 9.4×
Monthly cashflow live
- Estimated rent
- $842 medium interval (Pro) →
- Mortgage (P&I)
- −$498
- Tax from tax record
- −$108 /mo · $1,295/yr
- Insurance
- −$40
- Flood insurance flood zone
- −$56 /mo · $666/yr
- HOA
- −$0
- Vacancy / Maint / Mgmt
- −$177
- Net cashflow
- $-36
Break-even live
UW: 25.0% down · 7.5% · 30yr · 1.5% tax · 5.0% vac · 8.0% maint · 8.0% mgmt
Financing live
Cash to close
- Down payment
- $23,750
- Closing costs
- $2,850
- Reserves months
- —
- Total cash needed
- —
Loan-product check · same deal, 3 products live
Conventional
25% down · 7.5% · 30yr
- Down + closing
- —
- Monthly P&I
- —
- Monthly cashflow
- —
- DSCR
- —
- Eligible?
- —
Personal DTI + credit; lowest rate.
DSCR
20% down · 8.5% · 30yr
- Down + closing
- —
- Monthly P&I
- —
- Monthly cashflow
- —
- DSCR
- —
- Eligible?
- —
No personal income docs; deal must DSCR.
Hard money
10% down · 12.0% · 12mo
- Down + closing
- —
- Monthly P&I
- —
- Monthly cashflow
- —
- DSCR
- —
- Eligible?
- —
Short-term bridge; refi at stabilization.
Listing history 5 events
-
2026-05-06historical Active Under Contract 195-char remark
Show marketing remark (195 chars)
2.39 Acres with 2016 year old Mobil Home 3 Bedrooms Nice Bright Open Kitchen-Living Room With Sliding Patio Door to Side Porch, Garage and Shed! Just Minutes to Norwich Also Tax Map #95.-1-21.5
-
2026-03-12price $95,000 195-char remark
Show marketing remark (195 chars)
2.39 Acres with 2016 year old Mobil Home 3 Bedrooms Nice Bright Open Kitchen-Living Room With Sliding Patio Door to Side Porch, Garage and Shed! Just Minutes to Norwich Also Tax Map #95.-1-21.5
-
2025-11-18price $110,000 195-char remark
Show marketing remark (195 chars)
2.39 Acres with 2016 year old Mobil Home 3 Bedrooms Nice Bright Open Kitchen-Living Room With Sliding Patio Door to Side Porch, Garage and Shed! Just Minutes to Norwich Also Tax Map #95.-1-21.5
-
2025-11-10$129,900 Active 195-char remark
Show marketing remark (195 chars)
2.39 Acres with 2016 year old Mobil Home 3 Bedrooms Nice Bright Open Kitchen-Living Room With Sliding Patio Door to Side Porch, Garage and Shed! Just Minutes to Norwich Also Tax Map #95.-1-21.5
-
2004-07-13soldstatus $5,000
ⓘ Source: listings_history table (triggers on properties + properties_extension) + one-shot
backfill from property_details.listing_events for pre-trigger history.
Tax reassessment forecast NY · Partial reset (capped growth)
- Current annual tax
- $1,295 · $108/mo
- Projected year-2 tax
- $1,450 · $121/mo
- Expected delta
- +$155/yr (+$13/mo · 12.0%)
ⓘ Screening estimate from a state-policy table — verify with the county assessor before closing.
Climate risk First Street
- Flood 9/10 Extreme FEMA zone X (unshaded) · 99% chance over 30 yrs
- Wildfire 1/10 Low
- Heat 2/10 Low 7 d/yr ≥90°F today · 17 d/yr by 30 yrs out
- Wind 2/10 Low 100% chance of damaging wind over 30 yrs
- Air quality 1/10 Low 0 unhealthy d/yr today · 0 by 30 yrs out
Nearby sold comps map
Loading sold comps map…
Walkable amenities ~0.75 mi
Loading nearby amenities…
Taxation est. · year 1
- Rental income
- $10,105
- − Mortgage interest
- −$5,321
- − Property taxes
- −$1,295
- − Insurance
- −$1,142
- − Repairs & maintenance
- −$808
- − Management
- −$808
- − Depreciation
- −$2,764
- Taxable loss
- −$2,033
- Est. tax savings @ 24.0%
- +$488
- After-tax cash flow
- $56/yr
For passive investors: Depreciation is non-cash, so a rental often shows a tax loss while cash-flowing — sheltering income. Rental losses are passive: they offset passive income freely, and up to $25,000/yr can offset ordinary (W-2) income if you actively participate and your MAGI is under $100k (phasing out to $0 by $150k); unused losses carry forward. On sale, claimed depreciation is recaptured at up to 25%, and gains may owe capital-gains tax (a 1031 exchange can defer both). Figures are a year-1 estimate at your 24.0% rate — not tax advice; consult a CPA.
Schools (NCES district)
- District
- Norwich City School District
- NCES district ID
- 3621330
- Math proficiency
- 42% ▼ -13.00%
- Reading proficiency
- 43% ▲ 1.00%
- Median HH income
- $40,687
- Composite
- 35.68/100
- National rank
- #4874
- State rank
- #498 of 590 in NY
Livability — Norwich
- Score
- 70/100
- State rank
- #447
- US rank
- #7857
Category grades
Schools grade is shown separately in the Schools card above.
Census & demographics
- City population
- 12,855
- Population (ZIP)
- 543
Population outlook (Chenango County) Hauer SSP2
- Today (2025)
- 45,669 people
- By 2030
- 43,484 · -4.8%
- By 2040
- 38,774 · -15.1%
- By 2050
- 34,000 · -25.6%
- By 2075
- 24,637 · -46.1%
- By 2100
- 16,452 · -64.0%
Race, ethnicity, and origin ACS 2023
- Neighborhood character
- Predominantly White (98%)
- Race & ethnicity
- White 98% Two or more races 2%
- Common ancestry
- Romanian 3% Scotch-Irish 1% Danish 1%
- Foreign-born
- 1%
- Languages at home
- 99% English-only · German/W. Germanic 1%
Political lean MEDSL · Chenango
- 2024 margin
- Strong R (+27.2) · D 36.4% · R 63.6%
- 2008→2024 swing
- -26.1pp toward R · 2008: -1.1pp · 2024: -27.2pp
- All cycles
- 2024: R+27.2 2020: R+23.3 2016: R+28.1 2012: R+3.4 2008: R+1.1
Not yet ingested
- Civics
- —
Market trends
- HPI YoY
- ▲ 22.70%
- Current HPI
- 407.7205
- Rent YoY
- —
- Metro
- —
- State GDP YoY
- ▲ 2.60%
- F500 in state
- 92
Industry mix (Fortune 500 HQ in NY)
| Industry | F500 HQs | Revenue |
|---|---|---|
| Financial Services | 10 | $950B |
|
||
| Consumer Goods | 9 | $162B |
|
||
| Insurance | 4 | $225B |
|
||
| Telecommunications | 2 | $144B |
|
||
| Pharmaceuticals | 2 | $112B |
|
||
| Media / Entertainment | 2 | $69B |
|
||
Price history
+1800.0% since first listed5 events — show timeline
- 2026-05-06 Contingent — UNYREIS
- 2026-03-12 Price Changed $95,000 UNYREIS
- 2025-11-18 Price Changed $110,000 UNYREIS
- 2025-11-10 Listed $129,900 UNYREIS
- 2004-07-13 Sold (Public Records) $5,000 Public Records
Property tax history
+16.1%/yrLatest (2025): $1,295 · +250.6% YoY. Source: county tax records.
Cash-flow waterfall
monthlySold comps — $/sqft
last 12 mo · ≤1 miLoading sold comps…