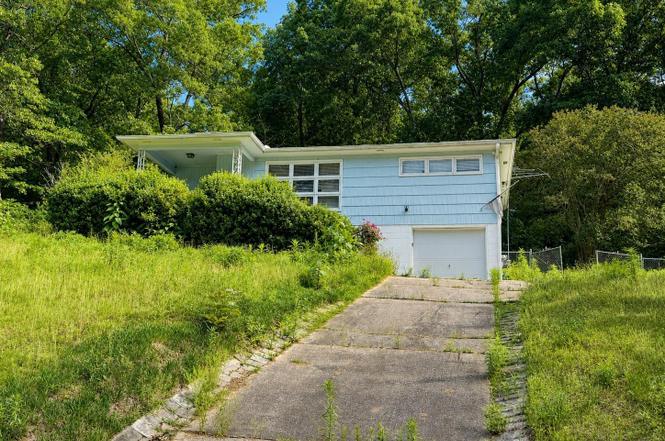
200 15th Ct NW · Center Point, AL
Flood risk 1/10 · Minimal
- FEMA flood zone
- X (unshaded)
- Chance of flooding over 30 yrs
- 0.0%
- Est. flood insurance / yr
- $473 – $860
Fire risk 3/10 · Minor
- Est. fire insurance / yr
- $916 – $1,700
Heat risk 5/10 · Moderate
- Hot days now (above 106°F)
- 7 days/yr
- Hot days in 30 yrs
- 18 days/yr
Wind risk 6/10 · Moderate
- Chance of severe wind over 30 yrs
- 27.0%
Air-quality risk 5/10 · Moderate
- Unhealthy air days now
- 7 days/yr
- Unhealthy air days in 30 yrs
- 9 days/yr
Risk factors via First Street. Map © Google.
Why this score? — see what drove the B- grade
The composite is a weighted blend of 9 inputs, each scored 0–100. Each bar is that input's sub-score; the figure is the points it added to the 100-point composite (weight × sub-score).
- Cash flow +30.0/30.0
- DSCR +10.0/10.0
- 1% rule +9.4/10.0
- ARV discount +9.4/15.0
- Rent growth +3.3/5.0
- Livability +3.2/5.0
- Condition / age +2.5/5.0
- Schools +1.8/10.0
- Appreciation +0.0/10.0
$87,500
🖨 Deal sheet 📄 Offer letter ✓ Due diligence
Listing remarks MLS
Another great one in Center Point offering a well-manicured, mature, and fenced lawn with irrigation system! This 3 bedroom, 1 bath, and move in ready home has smooth ceilings and wood flooring throughout. Living room flooring is newer. The kitchen offers plenty of cabinets, tiled back splash, a vented hood, and dishwasher. * HVAC 2012, Furnace Heater 2007, Roof 2005. Septic has two tanks. 1 for the bath and 1 for the kitchen. Septic cleaned 2020. Home has solid wood exterior doors and storm/security doors with 3 point locks and a Security system. All this and home is convenient to shopping, dining, and all Center Point Pkwy has to offer!
Key facts
- 0.44 acre lot
- Garage
- Built 1957
Property features AI
Finance
- Other: Property in Reese King subdivision; Approximately 0.44 acre lot; Not in a flood plain
- Financial info: Fire fee charged yearly
Exterior
- Parking: Front garage entry; Basement parking; Driveway parking; Total of 1 garage space
- Utilities: Public water; Septic system; Gas water heater; Internet availability unknown
- Home design: Existing home; Basement foundation; Shingle exterior construction
- Construction: Shingle construction; Basement foundation (concrete block)
- Exterior features: Fenced yard; Open patio
Interior
- Kitchen: Laminate countertops; Electric stove
- Bedrooms: Bedrooms located on main level
- Flooring: Hardwood laminate; Tile; Vinyl
- Bathrooms: One full bathroom with tub/shower combo (main level)
- Heating & cooling: Central heating; Central cooling
- Interior features: Smooth ceilings; Unfinished basement (concrete block foundation); Main living area reported as 1,014; Unfinished basement area about 700
- Laundry & utility: Laundry room on main level; Washer hookup; Electric dryer hookup; Gas water heater
Neighborhood map
What this means for you Summary
Snapshot
- This is a 3-bed/2.0-bath single-family listed at $88k.
Deal economics
- At list price, monthly cash flow is $393 ($5k/yr) — positive.
- The deal already cash-flows at list — no discount required.
- Meets the 1% rule at list price ($1k rent vs $88k).
- Cap rate 11.7% vs local median 7.3% in Center Point — top-decile yield for the area; either an underpriced asset or a hidden risk that comps aren't pricing in. Stress-test before assuming the spread holds.
Location & tenants
- Location reads 63/100 on livability (#193 in AL) — a middle-class / working-renter tenant base. Strengths: cost of living A+, commute A, housing A; Watch: crime D, amenities F, employment F.
- Jefferson County (suburban): math 9% / reading 32% proficiency, ranked #104 of 129 in AL (top 81%) — low school quality limits family demand, transient renter base, plan for 1-2y turnover.
- Zoned schools: Center Point Elementary School (618 students, 82% FRL); Center Point High School (math 2% / reading 2%, grade F, #291 of 305 statewide, top 100%, 774 students, 91% FRL) — zoned schools average 86% FRL vs 49% district-wide (38 pts higher); higher-poverty schools than district average — tighter screening recommended.
- Zoned-school proficiency averages 2% at this address vs 20% district-wide (-18 pts) — the specific schools serving this property underperform the Jefferson County average; the district grade overstates school quality for this exact location.
- Market conditions: Rents rising (+3.0%/yr); 334 active listings in the ZIP; 40 comparable units currently listed for rent nearby; rentals at typical pace (median 24d on market — plan ~3-4 weeks tenant-placement turnaround); 2,114 units permitted in Jefferson County in 2024 (556 in 5+ unit buildings).
Forward outlook
- Local home prices are declining (-3.0%/yr); year-one equity from $605 of loan paydown is wiped out by about $3k of value loss. Plan a longer hold.
- Jefferson County population projected to shrink 4% by 2050 — rents likely to lag national; underwrite the cash flow, not the appreciation.
- At projected returns (-3.0% appreciation + 3.0% rent growth), your $24k cash investment doubles in ~7 years — after that, you're playing with house money.
Negotiation context
- Only 1 days on market — expect competitive offers; lowballing is unlikely to land.
- 2 sale attempts since 4y ago with the ask held roughly flat each time — persistent listings suggest the price (not the market) is what's stuck; bring a comps-based counter.
Risks & watch-outs
- Watch-outs: built in 1957 — expect roof / HVAC / electrical / plumbing capex.
- Climate carrying-cost: major wind risk, 27% chance of damaging wind over 30y; extreme-heat days projected 7→18/yr by 2055 (HVAC capex compounding) — expect insurance premiums to compound above CPI over the hold.
Questions for the listing agent
- Built in 1957 — when were the roof, HVAC, electrical panel, plumbing, and water heater last replaced?
- Is there a deadline driving the sale (1031 exchange, divorce, estate, relocation)? That informs how much negotiation room exists.
- Schools are F-rated, which usually means shorter tenancies and higher turnover. Who's the typical renter profile here, and what's been the actual vacancy rate?
- Crime grade is D in this area — have there been break-ins, vandalism, or insurance claims at this property in the last 3 years? What carrier currently insures it and at what premium?
- What's the average days-on-market for RENTAL listings here right now (not sales)? A rising rental-DOM trend means longer vacancies and softer asking-rent achievability than the comps imply.
- What's the recent tenant-quality profile in this submarket — average credit score on applications, eviction rate, late-payment / NSF rate, and stable-employment percentage? A property-management company in the area should have these aggregated.
- How much new for-sale + rental construction is in the pipeline within 1–3 miles? Heavy new supply typically softens prices + rents 12–24 months out; constrained supply supports both.
Investment metrics
- 1% rule
- 1.44% ✓
- Cap rate
- 11.69%
- Cash-on-cash
- 19.27%
- DSCR
- 1.86
- GRM
- 5.8
CMA / ARV
- ARV (on-the-fly)
- $91,260
- Comps found
- 12
Show comp detail 12 sales within ~0.75 mi
| Address | Dist | Beds/Ba | Sqft | Sold | Price | $/sf | Match |
|---|---|---|---|---|---|---|---|
| 1640 1st St NE | 0.41mi | 3/1.0 | 1,090 (+8%) | 4mo | $105,000 | $96 | 62 |
| 1628 1st St NW | 0.32mi | 3/1.0 | 1,124 (+11%) | 7mo | $79,900 | $71 | 57 |
| 232 Navajo Trl | 0.71mi | 3/1.5 | 1,000 (-1%) | 8mo | $116,500 | $117 | 56 |
| 341 Argonne Dr NE | 0.74mi | 3/1.0 | 1,040 (+3%) | 3mo | $94,000 | $90 | 55 |
| 424 13th Ct NW | 0.51mi | 3/1.0 | 1,118 (+10%) | 1mo | $92,500 | $83 | 54 |
| 1317 5th Pl NW | 0.63mi | 3/1.0 | 1,086 (+7%) | 1mo | $92,500 | $85 | 54 |
| 409 13th Ct NW | 0.50mi | 3/1.5 | 1,118 (+10%) | 6mo | $98,672 | $88 | 52 |
| 1720 2nd St NE | 0.62mi | 3/1.5 | 1,099 (+8%) | 4mo | $65,000 | $59 | 51 |
| 1640 4th Way NW | 0.49mi | 3/1.0 | 1,144 (+13%) | 4mo | $149,900 | $131 | 48 |
| 417 NW 18th Ct | 0.67mi | 2/1.0 (-1) | 972 (-4%) | 8mo | $100,000 | $103 | 46 |
| 112 19th Ave NW | 0.70mi | 3/1.5 | 1,142 (+13%) | 2mo | $108,500 | $95 | 43 |
| 308 13th Ave NW | 0.58mi | 3/1.0 | 1,144 (+13%) | 7mo | $87,500 | $76 | 42 |
Match score weights: distance 35% · size 25% · config 20% · recency 20%. Top-matched comps best support the ARV.
Projected returns pro-forma
-3.0% appreciation · 3.04% rent growth · sell at horizon
- IRR
- 11.3%
- Equity multiple
- 1.45×
- Total profit
- $10,946
- Equity at exit
- $13,047
- IRR
- 20.3%
- Equity multiple
- 2.72×
- Total profit
- $42,071
- Equity at exit
- $7,565
Cash invested: $24,500 (down + closing). Projections, not guarantees.
Landlord ↔ Tenant lean methodology
- Overall (STATE)
- 90 Strongly Landlord-Friendly
- State Alabama
- 90 Strongly Landlord-Friendly · R+15
- County
- — inherits STATE
- City
- — inherits STATE
ZIP-level market 35215
- Home prices YoY
- -34.4%
- Rents YoY
- 3.0%
- Active inventory
- 334
- Price-to-rent
- 5.8×
Monthly cashflow live
- Estimated rent
- $1,258 high interval (Pro) →
- Mortgage (P&I)
- −$459
- Tax from tax record
- −$105 /mo · $1,257/yr
- Insurance
- −$36
- HOA
- −$0
- Vacancy / Maint / Mgmt
- −$264
- Net cashflow
- $393
Break-even live
UW: 25.0% down · 7.5% · 30yr · 1.5% tax · 5.0% vac · 8.0% maint · 8.0% mgmt
Financing live
Cash to close
- Down payment
- $21,875
- Closing costs
- $2,625
- Reserves months
- —
- Total cash needed
- —
Loan-product check · same deal, 3 products live
Conventional
25% down · 7.5% · 30yr
- Down + closing
- —
- Monthly P&I
- —
- Monthly cashflow
- —
- DSCR
- —
- Eligible?
- —
Personal DTI + credit; lowest rate.
DSCR
20% down · 8.5% · 30yr
- Down + closing
- —
- Monthly P&I
- —
- Monthly cashflow
- —
- DSCR
- —
- Eligible?
- —
No personal income docs; deal must DSCR.
Hard money
10% down · 12.0% · 12mo
- Down + closing
- —
- Monthly P&I
- —
- Monthly cashflow
- —
- DSCR
- —
- Eligible?
- —
Short-term bridge; refi at stabilization.
Rent comps 40 comps
| Address | Beds | Baths | Sqft | Rent | $/sqft | DOM | Units | Dist |
|---|---|---|---|---|---|---|---|---|
| 1617 3rd Pl NW Center Point, AL | 3.0 | 2.0 | 1404 | $1,150 | $0.82 | 23d | 1 | 0.28mi |
| 1541 Charter East Cir NE Birmingham, AL | 1.0–2.0 | 1.0–1.5 | 807 | $1,095 | $1.36 | 2d | 8 | 0.29mi |
| 1628 1st St NW Center Point, AL | 3.0 | 1.0 | 1124 | $1,150 | $1.02 | 43d | 1 | 0.35mi |
| 434 15th Ter NW Center Point, AL | 3.0 | 2.0 | 1053 | $1,200 | $1.14 | 43d | 1 | 0.35mi |
| 1629 1st St NW Center Point, AL | 3.0 | 1.0 | 900 | $1,025 | $1.14 | 23d | 1 | 0.36mi |
| 324 13th Ter NW Center Point, AL | 3.0 | 1.5 | 1418 | $1,295 | $0.91 | 23d | 1 | 0.40mi |
| 1628 1st St NE Center Point, AL | 3.0 | 1.0 | 1027 | $1,165 | $1.13 | 43d | 1 | 0.40mi |
| 108 13th Ave NW Center Point, AL | 4.0 | 2.0 | 1444 | $1,265 | $0.88 | 23d | 1 | 0.43mi |
| 405 13th Ct NW Center Point, AL | 4.0 | 1.5 | 1248 | $1,415 | $1.13 | 21d | 1 | 0.46mi |
| 1237 Linwood St Birmingham, AL | 3.0 | 1.5 | 1066 | $995 | $0.93 | 43d | 1 | 0.52mi |
| 500 15th Ave NW Center Point, AL | 3.0 | 1.0 | 1079 | $1,050 | $0.97 | 3d | 1 | 0.52mi |
| 1700 4th Pl NW Center Point, AL | 3.0 | 1.0 | 914 | $1,075 | $1.18 | 23d | 1 | 0.54mi |
| 405 18th Ave NW Center Point, AL | 3.0 | 2.0 | 1162 | $1,299 | $1.12 | 43d | 1 | 0.56mi |
| 1712 4th Pl NW Center Point, AL | 3.0 | 1.0 | 1182 | $1,150 | $0.97 | 23d | 1 | 0.56mi |
| 1612 Glenwood St NW Center Point, AL | 4.0 | 3.0 | 1344 | $1,480 | $1.10 | 23d | 1 | 0.56mi |
| 1356 5th Pl NW Center Point, AL | 3.0 | 1.0 | 1064 | $1,105 | $1.04 | 43d | 1 | 0.56mi |
| 1333 5th Pl NW Center Point, AL | 3.0 | 2.0 | 1056 | $1,275 | $1.21 | 43d | 1 | 0.57mi |
| 239 Lake Drive Cir NE Birmingham, AL | 3.0 | 1.0 | 1159 | $1,125 | $0.97 | 3d | 1 | 0.58mi |
| 1225 Birchwood St Birmingham, AL | 3.0 | 2.0 | 1092 | $1,175 | $1.08 | 3d | 1 | 0.58mi |
| 241 Lake Drive Cir NE Birmingham, AL | 2.0 | 1.0 | 1358 | $1,025 | $0.75 | 2d | 1 | 0.59mi |
| 400 13th Ave NW Birmingham, AL | 2.0 | 1.0 | 1100 | $890 | $0.81 | 43d | 1 | 0.61mi |
| 1328 5th Pl NW Center Point, AL | 3.0 | 1.0 | 1250 | $1,050 | $0.84 | 16d | 1 | 0.61mi |
| 1232 Oakwood St Birmingham, AL | 3.0 | 1.5 | 1301 | $1,223 | $0.94 | 23d | 1 | 0.61mi |
| 224 13th Ave NE Birmingham, AL | 3.0 | 1.5 | 1213 | $1,273 | $1.05 | 21d | 1 | 0.61mi |
| 1305 5th Pl NW Center Point, AL | 3.0 | 2.0 | 1092 | $1,200 | $1.10 | 43d | 1 | 0.62mi |
| 305 18th Ct NW Center Point, AL | 3.0 | 1.5 | 1270 | $1,100 | $0.87 | 43d | 1 | 0.62mi |
| 213 Meadwood Dr NE Center Point, AL | 3.0 | 1.0 | 1194 | $995 | $0.83 | 43d | 1 | 0.63mi |
| 1301 5th Pl NW Center Point, AL | 3.0 | 1.0 | 1170 | $1,100 | $0.94 | 3d | 1 | 0.64mi |
| 1153 Linwood St Birmingham, AL | 3.0 | 2.0 | 1250 | $1,295 | $1.04 | 3d | 1 | 0.64mi |
| 1720 2nd St NE Center Point, AL | 3.0 | 2.0 | 1100 | $1,400 | $1.27 | 43d | 1 | 0.65mi |
| 113 19th Ave NW Center Point, AL | 3.0 | 2.0 | 1407 | $1,250 | $0.89 | 11d | 1 | 0.70mi |
| 621 15th Ave NW Birmingham, AL | 4.0 | 2.0 | 1070 | $1,200 | $1.12 | 16d | 1 | 0.74mi |
| 1905 2nd St NW Center Point, AL | 3.0 | 1.0 | 1258 | $1,395 | $1.11 | 43d | 1 | 0.74mi |
| 120 Shawnee Ln NW Birmingham, AL | 3.0 | 1.0 | 1120 | $1,075 | $0.96 | 43d | 1 | 0.75mi |
| 341 Argonne Dr NE Center Point, AL | 3.0 | 1.0 | 1040 | $1,300 | $1.25 | 3d | 1 | 0.76mi |
| 107 Sterling Ct NW Center Point, AL | 2.0 | 1.5–2.0 | 1026 | $1,062 | $1.04 | 3d | 4 | 0.79mi |
| 1732 6th St NW Center Point, AL | 3.0 | 1.5 | 1300 | $1,250 | $0.96 | 3d | 1 | 0.80mi |
| 433 Orchid Rd Birmingham, AL | 3.0 | 1.0 | 1162 | $1,255 | $1.08 | 16d | 1 | 0.92mi |
| 1340 Orlando Cir NE Birmingham, AL | 3.0 | 2.0 | 1329 | $1,166 | $0.88 | 23d | 1 | 0.95mi |
| 424 Tupelo Way Center Point, AL | 4.0 | 2.0 | 1233 | $1,300 | $1.05 | 43d | 1 | 1.00mi |
Listing history 2 events
-
2026-06-18remarks 532-char remark
-
2026-06-18$87,500 Active 1 DOM
ⓘ Source: listings_history table (triggers on properties + properties_extension) + one-shot
backfill from property_details.listing_events for pre-trigger history.
Tax reassessment forecast AL · Resets to sale price
- Current annual tax
- $1,257 · $105/mo
- Projected year-2 tax
- $1,257 · $105/mo
- Expected delta
- $0/yr ($0/mo · 0.0%)
ⓘ Screening estimate from a state-policy table — verify with the county assessor before closing.
Climate risk First Street
- Flood 1/10 Low FEMA zone X (unshaded) · 0% chance over 30 yrs
- Wildfire 3/10 Moderate
- Heat 5/10 Major 7 d/yr ≥106°F today · 18 d/yr by 30 yrs out
- Wind 6/10 Major 27% chance of damaging wind over 30 yrs
- Air quality 5/10 Major 7 unhealthy d/yr today · 9 by 30 yrs out
Nearby sold comps map
Loading sold comps map…
Walkable amenities ~0.75 mi
Loading nearby amenities…
Taxation est. · year 1
- Rental income
- $15,092
- − Mortgage interest
- −$4,901
- − Property taxes
- −$1,257
- − Insurance
- −$438
- − Repairs & maintenance
- −$1,207
- − Management
- −$1,207
- − Depreciation
- −$2,545
- Taxable income
- $3,535
- Est. tax owed @ 24.0%
- −$848
- After-tax cash flow
- $3,873/yr
For passive investors: Depreciation is non-cash, so a rental often shows a tax loss while cash-flowing — sheltering income. Rental losses are passive: they offset passive income freely, and up to $25,000/yr can offset ordinary (W-2) income if you actively participate and your MAGI is under $100k (phasing out to $0 by $150k); unused losses carry forward. On sale, claimed depreciation is recaptured at up to 25%, and gains may owe capital-gains tax (a 1031 exchange can defer both). Figures are a year-1 estimate at your 24.0% rate — not tax advice; consult a CPA.
Schools (NCES district)
- District
- Jefferson County
- NCES district ID
- 0101920
- Math proficiency
- 9% ▼ -24.00%
- Reading proficiency
- 32% ▼ -5.00%
- Median HH income
- $51,712
- Composite
- 18.4/100
- National rank
- #8937
- State rank
- #104 of 129 in AL
Livability — Center Point
- Score
- 63/100
- State rank
- #193
- US rank
- #15671
Category grades
Schools grade is shown separately in the Schools card above.
Census & demographics
- Census place
- Center Point, AL
- County
- Jefferson County · 527,445 people
- City population
- 43,903
- Metro
- Birmingham-Hoover, AL
- Population (ZIP)
- 43,903
- Household income
- $52,793
- Rent vs Own
- Severe rent burden
- 1729.0
Population outlook (Jefferson County) Hauer SSP2
- Today (2025)
- 669,185 people
- By 2030
- 669,694 · +0.1%
- By 2040
- 661,388 · -1.2%
- By 2050
- 643,086 · -3.9%
- By 2075
- 577,267 · -13.7%
- By 2100
- 474,758 · -29.1%
Race, ethnicity, and origin ACS 2023
- Neighborhood character
- Predominantly Black (75%)
- Race & ethnicity
- Black 75% White 15% Hispanic / Latino 7% Two or more races 3%
- Hispanic origin (detail)
- Mexican 4%
- Common ancestry
- Lithuanian 1% Italian 1% Slovak 1%
- Foreign-born
- 4% · Canada
- Languages at home
- 92% English-only · Spanish 7%
Political lean MEDSL · Jefferson
- 2024 margin
- D (+10.4) · D 54.6% · R 44.2% · Other 1.2%
- 2008→2024 swing
- +5.4pp toward D · 2008: 5.1pp · 2024: 10.4pp
- All cycles
- 2024: D+10.4 2020: D+13.2 2016: D+7.2 2012: D+6.0 2008: D+5.1
Not yet ingested
- Civics
- —
Market trends
- HPI YoY
- ▼ -112.97%
- Current HPI
- 215.0607
- Rent YoY
- ▲ 3.04%
- Metro
- Birmingham-Hoover, AL
- State GDP YoY
- ▲ 2.94%
- F500 in state
- 4
Industry mix (Fortune 500 HQ in AL)
| Industry | F500 HQs | Revenue |
|---|---|---|
| Financial Services | 1 | $8B |
|
||
| Healthcare | 1 | $5B |
|
||
Price history
+230.2% since first listed5 events — show timeline
- 2026-06-15 Listed $87,500 Greater Alabama MLS
- 2022-05-06 Sold (MLS) $113,000 Greater Alabama MLS
- 2022-04-19 Contingent — Greater Alabama MLS
- 2022-04-14 Listed $119,900 Greater Alabama MLS
- 1976-11-02 Sold (Public Records) $26,500 Public Records
Property tax history
+12.7%/yrLatest (2025): $1,257 · +6.9% YoY. Source: county tax records.
Cash-flow waterfall
monthlySold comps — $/sqft
last 12 mo · ≤1 miLoading sold comps…