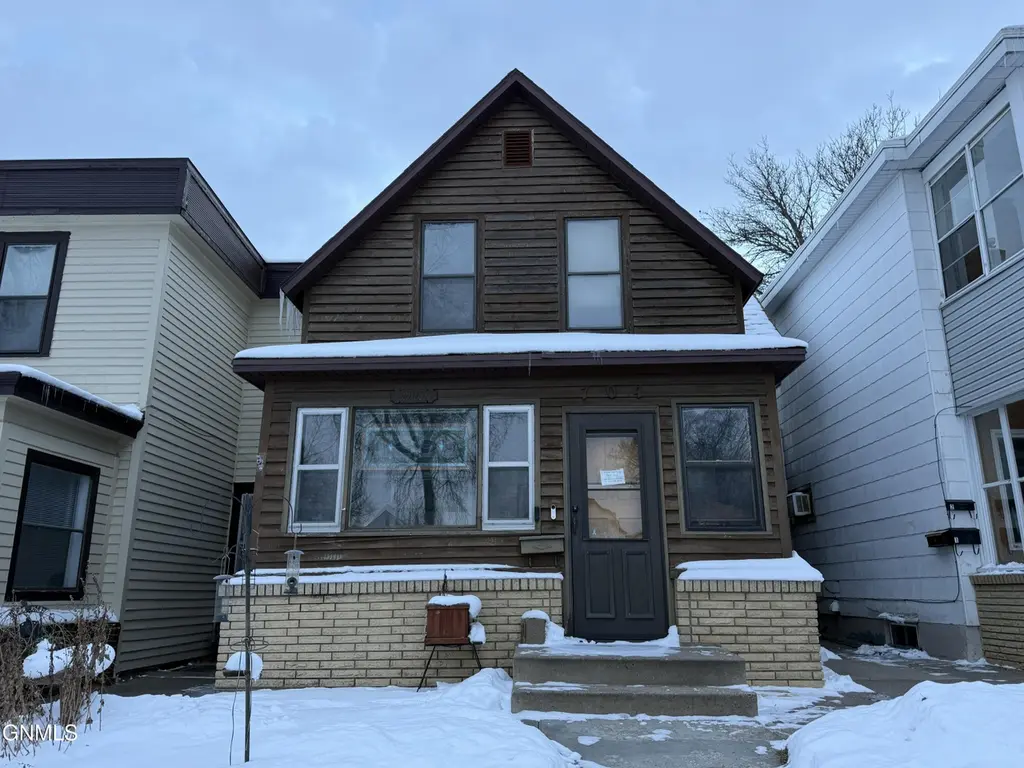
704 N 6th St · Bismarck, ND
Flood risk 1/10 · Minimal
- FEMA flood zone
- X (unshaded)
- Chance of flooding over 30 yrs
- 0.0%
- Est. flood insurance / yr
- $473 – $860
Fire risk 1/10 · Minimal
- Est. fire insurance / yr
- $1,289 – $2,393
Heat risk 2/10 · Minimal
- Hot days now (above 97°F)
- 7 days/yr
- Hot days in 30 yrs
- 12 days/yr
Wind risk 2/10 · Minimal
- Chance of severe wind over 30 yrs
- —
Air-quality risk 4/10 · Minor
- Unhealthy air days now
- 5 days/yr
- Unhealthy air days in 30 yrs
- 5 days/yr
Risk factors via First Street. Map © Google.
Why this score? — see what drove the C+ grade
The composite is a weighted blend of 9 inputs, each scored 0–100. Each bar is that input's sub-score; the figure is the points it added to the 100-point composite (weight × sub-score).
- Cash flow +22.0/30.0
- ARV discount +15.0/15.0
- DSCR +7.0/10.0
- 1% rule +5.0/10.0
- Rent growth +5.0/5.0
- Livability +4.0/5.0
- Schools +3.7/10.0
- Condition / age +2.5/5.0
- Appreciation +0.0/10.0
$125,000
🖨 Deal sheet (PDF) 📄 Offer letter ✓ Due diligence
Key facts
- 3,500 sq ft lot
- Garage
- Built 1912
Neighborhood map
What this means for you Summary
Snapshot
- This is a 3-bed/1.0-bath single-family listed at $125k.
Deal economics
- At list price, monthly cash flow is $200 ($2k/yr) — positive.
- The deal already cash-flows at list — no discount required.
- Meets the 1% rule at list price ($1k rent vs $125k).
- Cap rate 8.2% vs local median 3.1% in Bismarck — top-decile yield for the area; either an underpriced asset or a hidden risk that comps aren't pricing in. Stress-test before assuming the spread holds.
Location & tenants
- Location reads 79/100 on livability (#5 in ND, #2,213 nationally) — a middle-class / working-renter tenant base. Strengths: housing A+, health & safety A+, cost of living A; Watch: crime C-, amenities D+, commute F.
- Bismarck 1 (urban): math 41% / reading 42% proficiency, ranked #25 of 53 in ND (top 47%) — families likely to look elsewhere, expect single-tenant / working-renter base with shorter leases; only 19% free/reduced lunch — higher-income household profile.
- Market conditions: Rents rising fast (+10.8%/yr); 127 active listings in the ZIP; 13 comparable units currently listed for rent nearby; rentals at typical pace (median 22d on market — plan ~3-4 weeks tenant-placement turnaround); 259 units permitted in Burleigh County in 2024 (0 in 5+ unit buildings).
Forward outlook
- Local home prices are declining (-3.0%/yr); year-one equity from $864 of loan paydown is wiped out by about $4k of value loss. Plan a longer hold.
- Burleigh County population projected at +61% by 2050 — long-run rental-demand tailwind backs the buy-and-hold thesis.
- At projected returns (-3.0% appreciation + 8.0% rent growth), your $35k cash investment doubles in ~9 years — after that, you're playing with house money.
Negotiation context
- Only 5 days on market — expect competitive offers; lowballing is unlikely to land.
Risks & watch-outs
- Watch-outs: built in 1912 — expect roof / HVAC / electrical / plumbing capex.
Questions for the listing agent
- Built in 1912 — when were the roof, HVAC, electrical panel, plumbing, and water heater last replaced?
- Is there a deadline driving the sale (1031 exchange, divorce, estate, relocation)? That informs how much negotiation room exists.
- Schools are B-rated — typically a magnet for longer-tenancy family renters. What's the average tenant stay here, and is there a school-zone premium baked into asking?
- What's the average days-on-market for RENTAL listings here right now (not sales)? A rising rental-DOM trend means longer vacancies and softer asking-rent achievability than the comps imply.
- What's the recent tenant-quality profile in this submarket — average credit score on applications, eviction rate, late-payment / NSF rate, and stable-employment percentage? A property-management company in the area should have these aggregated.
- How much new for-sale + rental construction is in the pipeline within 1–3 miles? Heavy new supply typically softens prices + rents 12–24 months out; constrained supply supports both.
Investment metrics
- 1% rule
- 1.00% ✓
- Cap rate
- 8.21%
- Cash-on-cash
- 6.84%
- DSCR
- 1.30
- GRM
- 8.3
CMA / ARV
- ARV (on-the-fly)
- $214,452
- Comps found
- 12
Show comp detail 12 sales within ~0.75 mi
| Address | Dist | Beds/Ba | Sqft | Sold | Price | $/sf | Match |
|---|---|---|---|---|---|---|---|
| 704 N 6th St | 0.00mi | 3/1.0 | 1,332 (0%) | 1mo | $125,000 | $94 | 99 |
| 815 11th St N | 0.40mi | 3/2.0 | 1,320 (-1%) | 3mo | $204,900 | $155 | 73 |
| 608 N 3rd St | 0.22mi | 4/3.0 (+1) | 1,332 (0%) | 9mo | $75,000 | $56 | 69 |
| 1120 C Ave E | 0.43mi | 3/1.5 | 1,369 (+3%) | 9mo | $204,900 | $150 | 65 |
| 1023 N 7th St | 0.30mi | 4/2.0 (+1) | 1,296 (-3%) | 12mo | $229,000 | $177 | 62 |
| 803 N 11th St | 0.39mi | 3/1.5 | 1,245 (-6%) | 12mo | $230,000 | $185 | 58 |
| 825 N 2nd St | 0.28mi | 4/2.0 (+1) | 1,464 (+10%) | 6mo | $235,000 | $161 | 56 |
| 1407 Thayer Ave | 0.70mi | 3/2.0 | 1,414 (+6%) | 0mo | $249,000 | $176 | 53 |
| 410 14 St | 0.61mi | 2/1.0 (-1) | 1,394 (+5%) | 12mo | $215,000 | $154 | 48 |
| 500 W Ave C W | 0.68mi | 3/2.0 | 1,249 (-6%) | 9mo | $229,900 | $184 | 46 |
| 1313 E Rosser Ave | 0.61mi | 2/2.0 (-1) | 1,266 (-5%) | 11mo | $160,000 | $126 | 45 |
| 827 13th St | 0.54mi | 3/2.0 | 1,194 (-10%) | 12mo | $239,900 | $201 | 44 |
Match score weights: distance 35% · size 25% · config 20% · recency 20%. Top-matched comps best support the ARV.
Projected returns pro-forma
-3.0% appreciation · 8.0% rent growth · sell at horizon
- IRR
- -0.7%
- Equity multiple
- 0.97×
- Total profit
- $-949
- Equity at exit
- $18,638
- IRR
- 13.4%
- Equity multiple
- 2.30×
- Total profit
- $45,580
- Equity at exit
- $10,808
Cash invested: $35,000 (down + closing). Projections, not guarantees.
Landlord ↔ Tenant lean methodology
- Overall (STATE)
- 82 Strongly Landlord-Friendly
- State North Dakota
- 82 Strongly Landlord-Friendly · R+20
- County
- — inherits STATE
- City
- — inherits STATE
ZIP-level market 58501
- Rents YoY
- 10.8%
- Active inventory
- 127
- Price-to-rent
- 8.3×
Monthly cashflow live
- Estimated rent
- $1,253 high interval (Pro) →
- Mortgage (P&I)
- −$656
- Tax from tax record
- −$83 /mo · $997/yr
- Insurance
- −$52
- HOA
- −$0
- Vacancy / Maint / Mgmt
- −$263
- Net cashflow
- $200
Break-even live
Sensitivity live
| Price | -10% $270 | -5% $235 | +0% $200 | +5% $164 | +10% $129 |
|---|---|---|---|---|---|
| Rent | -10% $101 | -5% $150 | +0% $200 | +5% $249 | +10% $299 |
| Rate | -1.0pp $262 | -0.5pp $231 | base $200 | +0.5pp $167 | +1.0pp $134 |
UW: 25.0% down · 7.5% · 30yr · 1.5% tax · 5.0% vac · 8.0% maint · 8.0% mgmt
Financing live
Cash to close
- Down payment
- $31,250
- Closing costs
- $3,750
- Reserves months
- —
- Total cash needed
- —
Loan-product check · same deal, 3 products live
Conventional
25% down · 7.5% · 30yr
- Down + closing
- —
- Monthly P&I
- —
- Monthly cashflow
- —
- DSCR
- —
- Eligible?
- —
Personal DTI + credit; lowest rate.
DSCR
20% down · 8.5% · 30yr
- Down + closing
- —
- Monthly P&I
- —
- Monthly cashflow
- —
- DSCR
- —
- Eligible?
- —
No personal income docs; deal must DSCR.
Hard money
10% down · 12.0% · 12mo
- Down + closing
- —
- Monthly P&I
- —
- Monthly cashflow
- —
- DSCR
- —
- Eligible?
- —
Short-term bridge; refi at stabilization.
Rent comps 13 comps
| Address | Beds | Baths | Sqft | Rent | $/sqft | DOM | Units | Dist |
|---|---|---|---|---|---|---|---|---|
| 407 N 12th St Unit 3/4 Bismarck, ND | 2.0 | 1.0 | 1100 | $1,200 | $1.09 | 22d | 1 | 0.50mi |
| 1121 N 12th St Unit Main Bismarck, ND | 3.0 | 1.0 | 1600 | $1,500 | $0.94 | 22d | 1 | 0.59mi |
| 1020 N 15th St Bismarck, ND | 2.0 | 1.0 | 1200 | $1,400 | $1.17 | 22d | 1 | 0.69mi |
| 505 1/2 S 10th St Bismarck, ND | 3.0 | 1.0 | 1500 | $1,600 | $1.07 | 22d | 1 | 0.83mi |
| 201 E Arbor Ave Bismarck, ND | 2.0 | 1.0 | 1100 | $995 | $0.90 | 22d | 1 | 1.11mi |
| 215 E Arbor Ave Unit 201-302E Bismarck, ND | 2.0 | 1.0 | 1100 | $995 | $0.90 | 22d | 1 | 1.12mi |
| 215 E Arbor Ave Unit 205-305G Bismarck, ND | 2.0 | 2.0 | 1031 | $995 | $0.97 | 22d | 1 | 1.12mi |
| 205 E Arbor Ave Bismarck, ND | 2.0 | 2.0 | 1031 | $995 | $0.97 | 22d | 1 | 1.14mi |
| 700 N 22nd St Bismarck, ND | 2.0 | 1.0 | 1000 | $1,500 | $1.50 | 22d | 1 | 1.14mi |
| 2220 East Avenue A Unit 1/2 Bismarck, ND | 3.0 | 1.0 | 1227 | $1,150 | $0.94 | 22d | 1 | 1.22mi |
| 172 Boise Ave Bismarck, ND | 2.0 | 1.0 | 1200 | $1,050 | $0.88 | 22d | 1 | 1.27mi |
| 2027 N 16th St Bismarck, ND | 1.0–2.0 | 1.0–1.5 | 875 | $995 | $1.14 | 22d | 9 | 1.32mi |
| 2316 E Broadway Ave Bismarck, ND | 3.0 | 1.0 | 1113 | $1,250 | $1.12 | 22d | 1 | 1.33mi |
Listing history 2 events
-
2026-04-28status Pending
-
2026-04-23$125,000 Active
ⓘ Source: listings_history table (triggers on properties + properties_extension) + one-shot
backfill from property_details.listing_events for pre-trigger history.
Tax reassessment forecast ND · Resets to sale price
- Current annual tax
- $997 · $83/mo
- Projected year-2 tax
- $1,225 · $102/mo
- Expected delta
- +$228/yr (+$19/mo · 22.9%)
ⓘ Screening estimate from a state-policy table — verify with the county assessor before closing.
Climate risk First Street
- Flood 1/10 Low FEMA zone X (unshaded) · 0% chance over 30 yrs
- Wildfire 1/10 Low
- Heat 2/10 Low 7 d/yr ≥97°F today · 12 d/yr by 30 yrs out
- Wind 2/10 Low
- Air quality 4/10 Moderate 5 unhealthy d/yr today · 5 by 30 yrs out
Nearby sold comps map
Loading sold comps map…
Walkable amenities ~0.75 mi
Loading nearby amenities…
Taxation est. · year 1
- Rental income
- $15,041
- − Mortgage interest
- −$7,002
- − Property taxes
- −$997
- − Insurance
- −$625
- − Repairs & maintenance
- −$1,203
- − Management
- −$1,203
- − Depreciation
- −$3,636
- Taxable income
- $374
- Est. tax owed @ 24.0%
- −$90
- After-tax cash flow
- $2,305/yr
For passive investors: Depreciation is non-cash, so a rental often shows a tax loss while cash-flowing — sheltering income. Rental losses are passive: they offset passive income freely, and up to $25,000/yr can offset ordinary (W-2) income if you actively participate and your MAGI is under $100k (phasing out to $0 by $150k); unused losses carry forward. On sale, claimed depreciation is recaptured at up to 25%, and gains may owe capital-gains tax (a 1031 exchange can defer both). Figures are a year-1 estimate at your 24.0% rate — not tax advice; consult a CPA.
Schools (NCES district)
- District
- Bismarck 1
- NCES district ID
- 3800014
- Math proficiency
- 41% ▼ -5.00%
- Reading proficiency
- 42% ▼ -6.00%
- Median HH income
- $60,649
- Composite
- 36.76/100
- National rank
- #4577
- State rank
- #25 of 53 in ND
Livability — Bismarck
- Score
- 79/100
- State rank
- #5
- US rank
- #2213
Category grades
Schools grade is shown separately in the Schools card above.
Census & demographics
- Census place
- Bismarck, ND
- County
- Burleigh County · 97,300 people
- City population
- 97,300
- Metro
- Bismarck, ND
- Population (ZIP)
- 29,405
- Household income
- $68,755
- Rent vs Own
- Severe rent burden
- 865.0
Population outlook (Burleigh County) Hauer SSP2
- Today (2025)
- 119,359 people
- By 2030
- 133,047 · +11.5%
- By 2040
- 161,545 · +35.3%
- By 2050
- 191,960 · +60.8%
- By 2075
- 274,569 · +130.0%
- By 2100
- 350,910 · +194.0%
Race, ethnicity, and origin ACS 2023
- Neighborhood character
- Predominantly White (82%)
- Race & ethnicity
- White 82% Native American 5% Two or more races 5% Black 4% Hispanic / Latino 4%
- Common ancestry
- Portuguese 14% Scotch-Irish 3% Lithuanian 3%
- Foreign-born
- 4% · Canada
- Languages at home
- 96% English-only · Spanish 2%
Political lean MEDSL · Burleigh
- 2024 margin
- Solid R (+43.2) · D 27.5% · R 70.7% · Other 1.8%
- 2008→2024 swing
- -19.7pp toward R · 2008: -23.6pp · 2024: -43.2pp
- All cycles
- 2024: R+43.2 2020: R+40.2 2016: R+46.1 2012: R+32.1 2008: R+23.6
Not yet ingested
- Civics
- —
Market trends
- HPI YoY
- ▼ -260.24%
- Current HPI
- 218.67
- Rent YoY
- ▲ 10.82%
- Metro
- Bismarck, ND
- State GDP YoY
- ▲ 2.09%
- F500 in state
- 2
Industry mix (Fortune 500 HQ in ND)
| Industry | F500 HQs | Revenue |
|---|---|---|
| Utilities / Construction | 1 | $6B |
|
||
Price history
2 events — show timeline
- 2026-04-28 Pending — GNMLS
- 2026-04-23 Listed $125,000 GNMLS
Property tax history
+0.4%/yrLatest (2025): $997 · -37.3% YoY. Source: county tax records.
Cash-flow waterfall
monthlySold comps — $/sqft
last 12 mo · ≤1 miLoading sold comps…