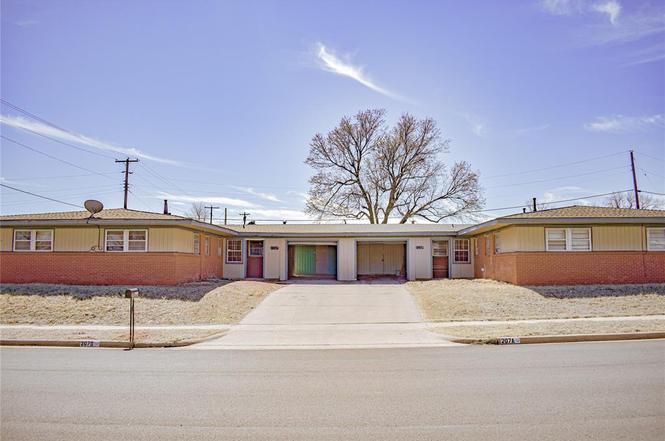
207 Pioneer Way · Burns Flat, OK
Flood risk 1/10 · Minimal
- FEMA flood zone
- X (unshaded)
- Chance of flooding over 30 yrs
- 0.0%
- Est. flood insurance / yr
- $507 – $1,088
Fire risk 3/10 · Minor
- Est. fire insurance / yr
- $2,463 – $4,575
Heat risk 6/10 · Moderate
- Hot days now (above 105°F)
- 7 days/yr
- Hot days in 30 yrs
- 20 days/yr
Wind risk 2/10 · Minimal
- Chance of severe wind over 30 yrs
- 3.0%
Air-quality risk 1/10 · Minimal
- Unhealthy air days now
- 0 days/yr
- Unhealthy air days in 30 yrs
- 0 days/yr
Risk factors via First Street. Map © Google.
Why this score? — see what drove the D+ grade
The composite is a weighted blend of 9 inputs, each scored 0–100. Each bar is that input's sub-score; the figure is the points it added to the 100-point composite (weight × sub-score).
- Cash flow +18.9/30.0
- DSCR +6.0/10.0
- Appreciation +5.6/10.0
- 1% rule +5.0/10.0
- Livability +3.3/5.0
- Rent growth +2.5/5.0
- Condition / age +2.5/5.0
- Schools +1.6/10.0
- ARV discount +0.0/15.0
$115,000
🖨 Deal sheet 📄 Offer letter ✓ Due diligence
Listing remarks
2 Duplexes for sale in Burns Flat, OK. Each side has 3 bedrooms and 2 baths. Fenced yards and attached garages make this income producing property a great investment. Thinking of house hacking, this would be the perfect property. Nice sized living rooms and bedrooms with little work needed. Central heat and air, one side has original hard work floors. Side A is move in ready! Corner Lot! Burns Flat, Oklahoma has many exciting things coming; get ahead of everyone. Call to see today!
Key facts
- Fenced yards
- Attached garages
- Corner lot
Tags
Property features AI
Finance
- Financial info: Cash or conventional financing accepted; Loan qualification allowed; Not assumable
- HOA & community: No mandatory association dues
Exterior
- Parking: Concrete driveway; 1-car garage
- Home design: Residential half duplex; Single-story; Existing property; Located in the Indian Trails addition; Homestead eligible
- Construction: Brick and frame construction; Composition roof; Combination foundation; Built previously (existing)
- Exterior features: Open patio; Porch; Corner lot
Interior
- Kitchen: Gas range/oven
- Bedrooms: 3 bedrooms
- Bathrooms: 2 full bathrooms
- Interior features: One living area; No fireplace
Neighborhood map
What this means for you Summary
Snapshot
- This is a 3-bed/2.0-bath single-family listed at $115k.
Deal economics
- At list price, monthly cash flow is $118 ($1k/yr) — positive.
- The deal already cash-flows at list — no discount required.
- Meets the 1% rule at list price ($1k rent vs $115k).
- Recommended offer: $101k (12.0% below list) — sets the bar for market timing.
Location & tenants
- Location reads 66/100 on livability (#122 in OK) — a middle-class / working-renter tenant base. Strengths: crime A+, cost of living A+, housing A+; Watch: employment D, amenities F, commute F.
- Burns Flat-Dill City (rural): math 15% / reading 22% proficiency, ranked #183 of 270 in OK (top 68%) — low school quality limits family demand, transient renter base, plan for 1-2y turnover; 65% free/reduced lunch — lower-income household profile, screen leases tightly.
- Zoned schools: Will Rogers Es (math 13% / reading 19%, grade F, #582 of 845 statewide, top 69%, 366 students, 0% FRL); Burns Flat-Dill City Hs (math 24% / reading 44%, grade F, #48 of 447 statewide, top 14%, 127 students, 0% FRL) — zoned schools average 0% FRL vs 65% district-wide (65 pts lower); this property's tenant base skews higher-income than the district average.
- Market conditions: 14 active listings in the ZIP; 1 units permitted in Washita County in 2024 (0 in 5+ unit buildings).
Forward outlook
- In year one you build about $2k of equity ($795 loan paydown + $1k appreciation (1.3% local appreciation)).
- Washita County population projected at +5% by 2050 — modest demand growth; plan on rents tracking national, not racing it.
- At projected returns (1.3% appreciation + 3.0% rent growth), your $32k cash investment doubles in ~7 years — after that, you're playing with house money.
Negotiation context
- It's been on market 456 days — a 12% lower offer ($101k) is reasonable based on typical stale-listing flexibility.
- 2 sale attempts; this cycle's ask has dropped $25k (18%) from the opening price — seller is motivated, your offer sets the floor, not the list.
- Current owner paid $18k; list at $115k implies a 522% gain — meaningful room to come down on a strong offer.
Risks & watch-outs
- Watch-outs: built in 1958 — expect roof / HVAC / electrical / plumbing capex.
- Climate carrying-cost: extreme-heat days projected 7→20/yr by 2055 (HVAC capex compounding) — expect insurance premiums to compound above CPI over the hold.
Questions for the listing agent
- It's been on market 456 days. Have you received any prior offers? Is the seller open to a 12% concession, seller financing, or rate buy-down credit?
- Built in 1958 — when were the roof, HVAC, electrical panel, plumbing, and water heater last replaced?
- Why hasn't it sold? Are there any deal-killer items the seller is aware of (foundation, flood, title, zoning, code violations)?
- Is there a deadline driving the sale (1031 exchange, divorce, estate, relocation)? That informs how much negotiation room exists.
- Schools are F-rated, which usually means shorter tenancies and higher turnover. Who's the typical renter profile here, and what's been the actual vacancy rate?
- The area grade is low — what's the realistic commute time and amenity access for the typical tenant pool here? Any planned neighborhood developments (good or bad) we should know about?
- What's the average days-on-market for RENTAL listings here right now (not sales)? A rising rental-DOM trend means longer vacancies and softer asking-rent achievability than the comps imply.
- What's the recent tenant-quality profile in this submarket — average credit score on applications, eviction rate, late-payment / NSF rate, and stable-employment percentage? A property-management company in the area should have these aggregated.
- How much new for-sale + rental construction is in the pipeline within 1–3 miles? Heavy new supply typically softens prices + rents 12–24 months out; constrained supply supports both.
Investment metrics
- 1% rule
- 1.00% ✓
- Cap rate
- 7.52%
- Cash-on-cash
- 4.39%
- DSCR
- 1.20
- GRM
- 8.3
CMA / ARV
- ARV (on-the-fly)
- $84,546
- Comps found
- 1
Show comp detail 1 sale within ~0.75 mi
| Address | Dist | Beds/Ba | Sqft | Sold | Price | $/sf | Match |
|---|---|---|---|---|---|---|---|
| 308 Cherokee Trl | 0.17mi | 3/1.0 | 1,235 (-11%) | 21mo | $75,000 | $61 | 52 |
Match score weights: distance 35% · size 25% · config 20% · recency 20%. Top-matched comps best support the ARV.
Projected returns pro-forma
1.26% appreciation · 3.0% rent growth · sell at horizon
- IRR
- 6.7%
- Equity multiple
- 1.35×
- Total profit
- $11,127
- Equity at exit
- $40,817
- IRR
- 10.6%
- Equity multiple
- 2.33×
- Total profit
- $42,830
- Equity at exit
- $55,468
Cash invested: $32,200 (down + closing). Projections, not guarantees.
Landlord ↔ Tenant lean methodology
- Overall (STATE)
- 83 Strongly Landlord-Friendly
- State Oklahoma
- 83 Strongly Landlord-Friendly · R+20
- County
- — inherits STATE
- City
- — inherits STATE
ZIP-level market 73647
- Home prices YoY
- 0.8%
- Active inventory
- 14
- Price-to-rent
- 8.3×
Monthly cashflow live
- Estimated rent
- $1,155 medium interval (Pro) →
- Mortgage (P&I)
- −$603
- Tax est. 1.5%
- −$144 /mo · $1,725/yr
- Insurance
- −$48
- HOA
- −$0
- Vacancy / Maint / Mgmt
- −$243
- Net cashflow
- $118
Break-even live
UW: 25.0% down · 7.5% · 30yr · 1.5% tax · 5.0% vac · 8.0% maint · 8.0% mgmt
Financing live
Cash to close
- Down payment
- $28,750
- Closing costs
- $3,450
- Reserves months
- —
- Total cash needed
- —
Loan-product check · same deal, 3 products live
Conventional
25% down · 7.5% · 30yr
- Down + closing
- —
- Monthly P&I
- —
- Monthly cashflow
- —
- DSCR
- —
- Eligible?
- —
Personal DTI + credit; lowest rate.
DSCR
20% down · 8.5% · 30yr
- Down + closing
- —
- Monthly P&I
- —
- Monthly cashflow
- —
- DSCR
- —
- Eligible?
- —
No personal income docs; deal must DSCR.
Hard money
10% down · 12.0% · 12mo
- Down + closing
- —
- Monthly P&I
- —
- Monthly cashflow
- —
- DSCR
- —
- Eligible?
- —
Short-term bridge; refi at stabilization.
Listing history 21 events
-
2026-06-18days on market $115,000 Active 456 DOM
-
2026-06-17days on market $115,000 Active 455 DOM
-
2026-06-16days on market $115,000 Active 454 DOM
-
2026-06-15days on market $115,000 Active 453 DOM
-
2026-06-13days on market $115,000 Active 451 DOM
-
2026-06-12days on market $115,000 Active 450 DOM
-
2026-06-09days on market $115,000 Active 447 DOM
-
2026-06-08days on market $115,000 Active 446 DOM
-
2026-06-08days on market $115,000 Active 445 DOM
-
2026-06-05days on market $115,000 Active 443 DOM
-
2026-06-04days on market $115,000 Active 441 DOM
-
2026-06-02days on market $115,000 Active 440 DOM
-
2026-06-01days on market $115,000 Active 439 DOM
-
2026-05-31days on market $115,000 Active 438 DOM
-
2026-04-06status Active
-
2026-04-06price $115,000
-
2026-03-31historical
-
2025-12-01price $130,000
-
2025-09-17price $135,000
-
2025-03-14$140,000 Active
-
2009-07-08soldstatus $18,500
ⓘ Source: listings_history table (triggers on properties + properties_extension) + one-shot
backfill from property_details.listing_events for pre-trigger history.
Climate risk First Street
- Flood 1/10 Low FEMA zone X (unshaded) · 0% chance over 30 yrs
- Wildfire 3/10 Moderate
- Heat 6/10 Major 7 d/yr ≥105°F today · 20 d/yr by 30 yrs out
- Wind 2/10 Low 3% chance of damaging wind over 30 yrs
- Air quality 1/10 Low 0 unhealthy d/yr today · 0 by 30 yrs out
Nearby sold comps map
Loading sold comps map…
Walkable amenities ~0.75 mi
Loading nearby amenities…
Taxation est. · year 1
- Rental income
- $13,860
- − Mortgage interest
- −$6,442
- − Property taxes
- −$1,725
- − Insurance
- −$575
- − Repairs & maintenance
- −$1,109
- − Management
- −$1,109
- − Depreciation
- −$3,345
- Taxable loss
- −$445
- Est. tax savings @ 24.0%
- +$107
- After-tax cash flow
- $1,519/yr
For passive investors: Depreciation is non-cash, so a rental often shows a tax loss while cash-flowing — sheltering income. Rental losses are passive: they offset passive income freely, and up to $25,000/yr can offset ordinary (W-2) income if you actively participate and your MAGI is under $100k (phasing out to $0 by $150k); unused losses carry forward. On sale, claimed depreciation is recaptured at up to 25%, and gains may owe capital-gains tax (a 1031 exchange can defer both). Figures are a year-1 estimate at your 24.0% rate — not tax advice; consult a CPA.
Schools (NCES district)
- District
- Burns Flat-Dill City
- NCES district ID
- 4000014
- Math proficiency
- 15% ▼ -2.00%
- Reading proficiency
- 22% ▲ 4.00%
- Median HH income
- $45,907
- Composite
- 16.25/100
- National rank
- #9221
- State rank
- #183 of 270 in OK
Livability — Burns Flat
- Score
- 66/100
- State rank
- #122
- US rank
- #12117
Category grades
Schools grade is shown separately in the Schools card above.
Census & demographics
- Census place
- Burns Flat, OK
- City population
- 1,968
- Population (ZIP)
- 691
Population outlook (Washita County) Hauer SSP2
- Today (2025)
- 12,143 people
- By 2030
- 12,276 · +1.1%
- By 2040
- 12,522 · +3.1%
- By 2050
- 12,740 · +4.9%
- By 2075
- 13,198 · +8.7%
- By 2100
- 13,189 · +8.6%
Race, ethnicity, and origin ACS 2023
- Neighborhood character
- Predominantly White (90%)
- Race & ethnicity
- White 90% Two or more races 7% Hispanic / Latino 3% Native American 1%
- Common ancestry
- Iranian 3% Serbian 3% Slovak 2%
- Foreign-born
- 1% · Canada
- Languages at home
- 98% English-only · Spanish 1% Other Indo-European 1%
Political lean MEDSL · Washita
- 2024 margin
- Solid R (+74.8) · D 11.8% · R 86.6% · Other 1.5%
- 2008→2024 swing
- -18.9pp toward R · 2008: -55.9pp · 2024: -74.8pp
- All cycles
- 2024: R+74.8 2020: R+73.0 2016: R+70.5 2012: R+61.8 2008: R+55.9
Not yet ingested
- Civics
- —
Market trends
- HPI YoY
- ▲ 1.26%
- Current HPI
- 168.3314
- Rent YoY
- —
- Metro
- —
- State GDP YoY
- ▲ 1.55%
- F500 in state
- 6
Industry mix (Fortune 500 HQ in OK)
| Industry | F500 HQs | Revenue |
|---|---|---|
| Energy | 3 | $48B |
|
||
Price history
+521.6% since first listed7 events — show timeline
- 2026-04-06 Relisted — MLSOK
- 2026-04-06 Price Changed $115,000 MLSOK
- 2026-03-31 Listing Removed — MLSOK
- 2025-12-01 Price Changed $130,000 MLSOK
- 2025-09-17 Price Changed $135,000 MLSOK
- 2025-03-14 Listed $140,000 MLSOK
- 2009-07-08 Sold (Public Records) $18,500 Public Records
Property tax history
+2.8%/yrLatest (2025): $227 · +7.6% YoY. Source: county tax records.
Cash-flow waterfall
monthlySold comps — $/sqft
last 12 mo · ≤1 miLoading sold comps…