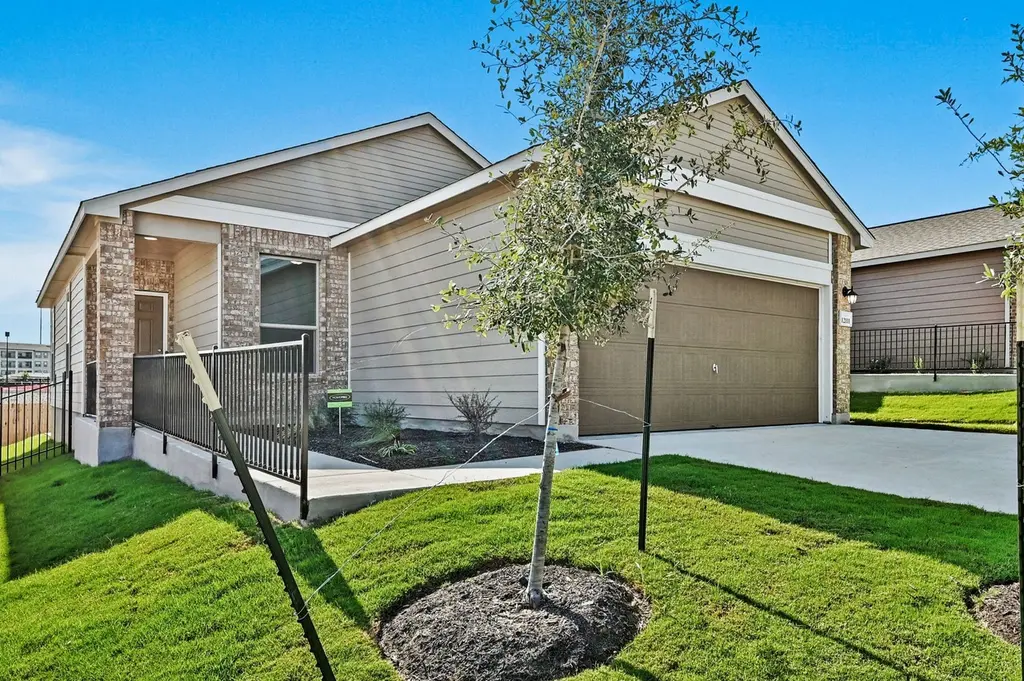
12111 Cantabria Rd · Austin, TX
Flood risk No data
- FEMA flood zone
- —
- Chance of flooding over 30 yrs
- —
- Est. flood insurance / yr
- —
Fire risk No data
- Est. fire insurance / yr
- —
Heat risk No data
- Hot days now (above threshold)
- —
- Hot days in 30 yrs
- —
Wind risk No data
- Chance of severe wind over 30 yrs
- —
Air-quality risk No data
- Unhealthy air days now
- —
- Unhealthy air days in 30 yrs
- —
Risk factors via First Street. Map © Google.
Why this score? — see what drove the D- grade
The composite is a weighted blend of 9 inputs, each scored 0–100. Each bar is that input's sub-score; the figure is the points it added to the 100-point composite (weight × sub-score).
- ARV discount +15.0/15.0
- Cash flow +8.0/30.0
- Livability +4.1/5.0
- Schools +3.4/10.0
- 1% rule +2.9/10.0
- Condition / age +2.5/5.0
- DSCR +2.1/10.0
- Rent growth +1.8/5.0
- Appreciation +0.0/10.0
$249,999
🖨 Deal sheet (PDF) 📄 Offer letter ✓ Due diligence
Listing remarks MLS
Welcome to this beautiful move-in-ready new construction home located in the desirable Estancia community in South Austin. This thoughtfully designed single-story home features 3 bedrooms, 2 bathrooms, and a one-car garage. The open-concept floor plan creates a bright and inviting living space that flows seamlessly between the kitchen, dining, and living areas—perfect for everyday living and entertaining. Enjoy a private fenced yard ideal for relaxing, outdoor gatherings, or family time. With modern finishes and a functional layout, this home offers comfort, convenience, and great family living in one of South Austin’s growing communities with easy access to shopping, dining, and major roadways. Affordable Housing restrictions apply, buyer must not exceed 80% MFI and be income certified in order to purchase.
Key facts
- New construction
- Modern finishes
- Private fenced yard
Tags
Neighborhood map
What this means for you Summary
Snapshot
- This is a 3-bed/2.0-bath condo listed at $250k.
Deal economics
- At list price, monthly cash flow is $-255 ($-3k/yr) — negative.
- To cash-flow at today's rent, offer at most $213k (14.8% below list).
- To meet the 1% rule (rent ≥ 1% of price), the offer needs to be $197k (21.2% below list).
- Recommended offer: $197k (21.2% below list) — sets the bar for 1% rule.
- Cap rate 5.1% vs local median 1.8% in Austin — top-decile yield for the area; either an underpriced asset or a hidden risk that comps aren't pricing in. Stress-test before assuming the spread holds.
Location & tenants
- Location reads 82/100 on livability (#16 in TX, #1,208 nationally) — a professional / high-income tenant draw. Strengths: amenities A+, commute A+, employment A+; Watch: cost of living D, crime F.
- Austin ISD (urban): math 33% / reading 44% proficiency, ranked #431 of 826 in TX (top 52%) — families likely to look elsewhere, expect single-tenant / working-renter base with shorter leases.
- Market conditions: Rents soft (-2.7%/yr); 275 active listings in the ZIP; 40 comparable units currently listed for rent nearby; rentals leasing fast (median 5d on market — plan ~1-2 weeks tenant-placement turnaround); high-income renter base; 17,121 units permitted in Travis County in 2024 (11,963 in 5+ unit buildings).
Forward outlook
- Local home prices are declining (-3.0%/yr); year-one equity from $2k of loan paydown is wiped out by about $8k of value loss. Plan a longer hold.
- Travis County population projected at +60% by 2050 — long-run rental-demand tailwind backs the buy-and-hold thesis.
Negotiation context
- It's been on market 106 days — a 9% lower offer ($227k) is reasonable based on typical stale-listing flexibility.
Questions for the listing agent
- What do current leases actually rent for vs. the listed asking? Can we see a recent rent roll and the last 12 months of T-12 income?
- It's been on market 106 days. Have you received any prior offers? Is the seller open to a 21% concession, seller financing, or rate buy-down credit?
- What does the HOA fee cover, when was the last increase, and are there any pending special assessments or reserve-fund shortfalls?
- Any open or pending special assessments — roof, HVAC, plumbing, elevator, façade? What's the per-unit balance and payoff schedule, and is the seller paying it off at close or rolling it to the buyer?
- Why hasn't it sold? Are there any deal-killer items the seller is aware of (foundation, flood, title, zoning, code violations)?
- Is there a deadline driving the sale (1031 exchange, divorce, estate, relocation)? That informs how much negotiation room exists.
- Crime grade is F in this area — have there been break-ins, vandalism, or insurance claims at this property in the last 3 years? What carrier currently insures it and at what premium?
- The area grade is low — what's the realistic commute time and amenity access for the typical tenant pool here? Any planned neighborhood developments (good or bad) we should know about?
- What's the average days-on-market for RENTAL listings here right now (not sales)? A rising rental-DOM trend means longer vacancies and softer asking-rent achievability than the comps imply.
- What's the recent tenant-quality profile in this submarket — average credit score on applications, eviction rate, late-payment / NSF rate, and stable-employment percentage? A property-management company in the area should have these aggregated.
- How much new apartment / multifamily construction is in the pipeline within 1–3 miles? Heavy new supply (>2% of stock underway) typically softens rents 12–24 months out; light construction supports rent growth.
Investment metrics
- 1% rule
- 0.79% ✗
- Cap rate
- 5.07%
- Cash-on-cash
- -4.37%
- DSCR
- 0.81
- GRM
- 10.6
CMA / ARV
- ARV (median comp)
- $369,716
- List price
- $249,999
- Delta
- -32.38%
- Verdict
- UNDERPRICED
- Comps
- 20 within 1.0 mi
Projected returns pro-forma
-3.0% appreciation · 0.0% rent growth · sell at horizon
- IRR
- -27.2%
- Equity multiple
- 0.11×
- Total profit
- $-62,440
- Equity at exit
- $37,276
- IRR
- -41.9%
- Equity multiple
- -0.39×
- Total profit
- $-97,257
- Equity at exit
- $21,615
Cash invested: $70,000 (down + closing). Projections, not guarantees.
Landlord ↔ Tenant lean methodology
- Overall (STATE)
- 87 Strongly Landlord-Friendly
- State Texas
- 87 Strongly Landlord-Friendly · R+5
- County
- — inherits STATE
- City
- — inherits STATE
ZIP-level market 78748
- Rents YoY
- -2.7%
- Active inventory
- 275
- Price-to-rent
- 10.6×
Monthly cashflow live
- Estimated rent
- $1,969 high interval (Pro) →
- Mortgage (P&I)
- −$1,311
- Tax est. 1.5%
- −$312 /mo · $3,750/yr
- Insurance
- −$104
- HOA
- −$83
- Vacancy / Maint / Mgmt
- −$414
- Net cashflow
- $-255
Break-even live
Sensitivity live
| Price | -10% $-82 | -5% $-169 | +0% $-255 | +5% $-341 | +10% $-428 |
|---|---|---|---|---|---|
| Rent | -10% $-411 | -5% $-333 | +0% $-255 | +5% $-177 | +10% $-99 |
| Rate | -1.0pp $-129 | -0.5pp $-191 | base $-255 | +0.5pp $-320 | +1.0pp $-386 |
UW: 25.0% down · 7.5% · 30yr · 1.5% tax · 5.0% vac · 8.0% maint · 8.0% mgmt
Financing live
Cash to close
- Down payment
- $62,500
- Closing costs
- $7,500
- Reserves months
- —
- Total cash needed
- —
Loan-product check · same deal, 3 products live
Conventional
25% down · 7.5% · 30yr
- Down + closing
- —
- Monthly P&I
- —
- Monthly cashflow
- —
- DSCR
- —
- Eligible?
- —
Personal DTI + credit; lowest rate.
DSCR
20% down · 8.5% · 30yr
- Down + closing
- —
- Monthly P&I
- —
- Monthly cashflow
- —
- DSCR
- —
- Eligible?
- —
No personal income docs; deal must DSCR.
Hard money
10% down · 12.0% · 12mo
- Down + closing
- —
- Monthly P&I
- —
- Monthly cashflow
- —
- DSCR
- —
- Eligible?
- —
Short-term bridge; refi at stabilization.
Rent comps 40 comps
| Address | Beds | Baths | Sqft | Rent | $/sqft | DOM | Units | Dist |
|---|---|---|---|---|---|---|---|---|
| 601 Puerta Vallarta Ln Austin, TX | 3.0 | 2.0 | 1843 | $2,490 | $1.35 | 45d | 1 | 0.22mi |
| 12000 S Interstate 35 Austin, TX | 1.0–4.0 | 1.0–4.0 | 1294 | $1,989 | $1.54 | 0d | 37 | 0.24mi |
| 820 Camino Vaquero Pkwy Austin, TX | 1.0–3.0 | 1.0–2.0 | 1039 | $2,053 | $1.98 | 0d | 39 | 0.33mi |
| 12234 Heatherly Dr Austin, TX | 1.0–2.0 | 1.0–2.0 | 817 | $1,730 | $2.12 | 0d | 58 | 0.41mi |
| 1200 Estancia Pkwy Austin, TX | 3.0 | 1.0–2.0 | 922 | $2,170 | $2.35 | 0d | 27 | 0.41mi |
| 827 Camino Vaquero Pkwy Manchaca, TX | 3.0 | 1.0–2.0 | 982 | $2,549 | $2.59 | 0d | 44 | 0.44mi |
| 12001 Heatherly Dr Austin, TX | 2.0 | 1.0–2.0 | 912 | $1,616 | $1.77 | 0d | 38 | 0.53mi |
| 1901 Onion Creek Pkwy Austin, TX | 1.0–3.0 | 1.0–2.0 | 1045 | $1,844 | $1.76 | 0d | 19 | 0.56mi |
| 2213 Cascades Ave Austin, TX | 1.0–3.0 | 1.0–2.0 | 970 | $2,280 | $2.35 | 6d | 38 | 0.63mi |
| 2333 Cascades Ave Austin, TX | 1.0–3.0 | 1.0–2.0 | 959 | $1,520 | $1.58 | 0d | 15 | 0.68mi |
| 1906 Onion Creek Pkwy Austin, TX | 3.0 | 2.0 | 1265 | $1,768 | $1.40 | 45d | 1 | 0.69mi |
| 11410 Old San Antonio Rd Manchaca, TX | 3.0 | 3.0 | 1503 | $2,359 | $1.57 | 0d | 9 | 0.71mi |
| 11425 Pastini Cir Manchaca, TX | 3.0 | 3.0 | 1360 | $2,199 | $1.62 | 25d | 1 | 0.73mi |
| 12800 Old San Antonio Rd Unit A Manchaca, TX | 2.0 | 1.5 | 924 | $1,650 | $1.79 | 25d | 1 | 0.74mi |
| 11409 Pastini Cir Manchaca, TX | 3.0 | 3.0 | 1360 | $2,199 | $1.62 | 25d | 1 | 0.74mi |
| 12803 Stanford Dr Austin, TX | 3.0 | 2.0 | 1740 | $2,450 | $1.41 | 16d | 1 | 0.75mi |
| 702 Blackwell Ave Apt B Manchaca, TX | 2.0 | 2.0 | 1050 | $1,650 | $1.57 | 45d | 1 | 0.76mi |
| 2000 Onion Creek Pkwy Austin, TX | 1.0–2.0 | 1.0–2.0 | 872 | $2,181 | $2.50 | 0d | 45 | 0.76mi |
| 1900 Onion Creek Pkwy Austin, TX | 1.0–3.0 | 1.0–2.0 | 989 | $1,953 | $1.97 | 0d | 20 | 0.79mi |
| 11301 Farrah Austin, TX | 3.0 | 1.0–2.0 | 919 | $2,032 | $2.21 | 0d | 35 | 0.82mi |
| 11509 Autumn Ash Dr Manchaca, TX | 3.0 | 2.0 | 1352 | $2,100 | $1.55 | 45d | 1 | 0.83mi |
| 11609 Dillon Falls Dr Austin, TX | 3.0 | 2.0 | 1373 | $2,250 | $1.64 | 14d | 1 | 0.89mi |
| 11609 Dillon Falls Dr Austin, TX | 3.0 | 2.0 | 1373 | $2,250 | $1.64 | 5d | 1 | 0.89mi |
| 1100 Avenida Mercado St Manchaca, TX | 2.0–4.0 | 2.0 | 1090 | $1,318 | $1.21 | 5d | 1 | 0.90mi |
| 600 Farm to Market 1626 Austin, TX | 1.0–2.0 | 1.0–2.0 | 910 | $1,720 | $1.89 | 0d | 26 | 1.02mi |
| 11118 S 1st St Austin, TX | 3.0 | 3.0 | 1360 | $2,197 | $1.62 | 45d | 1 | 1.07mi |
| 4907 Escape Rivera Dr Austin, TX | 3.0 | 2.0 | 1718 | $2,350 | $1.37 | 19d | 1 | 1.08mi |
| 11509 Sombrero Dr Austin, TX | 3.0 | 2.0 | 1834 | $2,195 | $1.20 | 0d | 1 | 1.09mi |
| 11509 Sombrero Dr Austin, TX | 3.0 | 2.0 | 1834 | $2,225 | $1.21 | 19d | 1 | 1.09mi |
| 11007 S 1st St Austin, TX | 3.0 | 2.0 | 1308 | $1,728 | $1.32 | 45d | 1 | 1.11mi |
| 10819 Crown Colony Dr #31 Austin, TX | 2.0 | 2.5 | 1207 | $1,850 | $1.53 | 45d | 1 | 1.12mi |
| 11001 S 1st St Austin, TX | 1.0–3.0 | 1.0–2.0 | 1057 | $1,643 | $1.55 | 0d | 19 | 1.13mi |
| 801 Steel Timber Dr Unit 611 Manchaca, TX | 2.0 | 2.0 | 1015 | $1,469 | $1.45 | 14d | 1 | 1.13mi |
| 801 Steel Timber Dr Unit 711 Manchaca, TX | 3.0 | 2.0 | 1401 | $2,124 | $1.52 | 14d | 1 | 1.13mi |
| 801 Steel Timber Dr Unit 834 Manchaca, TX | 3.0 | 2.0 | 1401 | $2,124 | $1.52 | 0d | 1 | 1.13mi |
| 801 Steel Timber Dr Unit 858 Manchaca, TX | 2.0 | 2.0 | 1015 | $1,469 | $1.45 | 0d | 1 | 1.13mi |
| 13207 Easley Dr Unit 1039127P Manchaca, TX | 4.0 | 2.0 | 1797 | $7,182 | $4.00 | 0d | 1 | 1.23mi |
| 10801 S Interstate 35 Austin, TX | 2.0 | 2.0 | 1142 | $1,856 | $1.63 | 45d | 1 | 1.31mi |
| 10801 S Interstate 35 Frontage Rd Unit 10858 Austin, TX | 2.0 | 2.0 | 1142 | $1,201 | $1.05 | 0d | 1 | 1.31mi |
| 10801 S Interstate 35 Frontage Rd Unit 3018 Austin, TX | 3.0 | 2.0 | 1545 | $2,065 | $1.34 | 12d | 1 | 1.31mi |
HOA detail condo
- Monthly dues
- $83 · $996/yr
- Assessments
- None detected in remarks — confirm with the listing agent.
Listing history 15 events
-
2026-06-21days on market $249,999 Active 106 DOM
-
2026-06-18days on market $249,999 Active 103 DOM
-
2026-06-17days on market $249,999 Active 102 DOM
-
2026-06-16days on market $249,999 Active 101 DOM
-
2026-06-15days on market $249,999 Active 100 DOM
-
2026-06-13days on market $249,999 Active 98 DOM
-
2026-06-09days on market $249,999 Active 94 DOM
-
2026-06-08days on market $249,999 Active 93 DOM
-
2026-06-07days on market $249,999 Active 92 DOM
-
2026-06-05days on market $249,999 Active 89 DOM
-
2026-06-03days on market $249,999 Active 88 DOM
-
2026-06-02days on market $249,999 Active 87 DOM
-
2026-06-01days on market $249,999 Active 86 DOM
-
2026-05-31days on market $249,999 Active 85 DOM
-
2026-03-07$249,999 Active 831-char remark
Show marketing remark (831 chars)
Welcome to this beautiful move-in-ready new construction home located in the desirable Estancia community in South Austin. This thoughtfully designed single-story home features 3 bedrooms, 2 bathrooms, and a one-car garage. The open-concept floor plan creates a bright and inviting living space that flows seamlessly between the kitchen, dining, and living areas—perfect for everyday living and entertaining. Enjoy a private fenced yard ideal for relaxing, outdoor gatherings, or family time. With modern finishes and a functional layout, this home offers comfort, convenience, and great family living in one of South Austin’s growing communities with easy access to shopping, dining, and major roadways. Affordable Housing restrictions apply, buyer must not exceed 80% MFI and be income certified in order to purchase.
ⓘ Source: listings_history table (triggers on properties + properties_extension) + one-shot
backfill from property_details.listing_events for pre-trigger history.
Nearby sold comps map
Loading sold comps map…
Walkable amenities ~0.75 mi
Loading nearby amenities…
Taxation est. · year 1
- Rental income
- $23,631
- − Mortgage interest
- −$14,004
- − Property taxes
- −$3,750
- − Insurance
- −$1,250
- − Repairs & maintenance
- −$1,890
- − Management
- −$1,890
- − HOA
- −$996
- − Depreciation
- −$7,273
- Taxable loss
- −$7,422
- Est. tax savings @ 24.0%
- +$1,781
- After-tax cash flow
- $-1,278/yr
For passive investors: Depreciation is non-cash, so a rental often shows a tax loss while cash-flowing — sheltering income. Rental losses are passive: they offset passive income freely, and up to $25,000/yr can offset ordinary (W-2) income if you actively participate and your MAGI is under $100k (phasing out to $0 by $150k); unused losses carry forward. On sale, claimed depreciation is recaptured at up to 25%, and gains may owe capital-gains tax (a 1031 exchange can defer both). Figures are a year-1 estimate at your 24.0% rate — not tax advice; consult a CPA.
Schools (NCES district)
- District
- Austin ISD
- NCES district ID
- 4808940
- Math proficiency
- 33% ▼ -19.00%
- Reading proficiency
- 44% ▼ -7.00%
- Median HH income
- $54,627
- Composite
- 33.65/100
- National rank
- #5397
- State rank
- #431 of 826 in TX
Livability — Austin
- Score
- 82/100
- State rank
- #16
- US rank
- #1208
Category grades
Schools grade is shown separately in the Schools card above.
Census & demographics
- Census place
- Austin, TX
- County
- Travis County · 1,299,254 people
- City population
- 1,066,854
- Metro
- Austin-Round Rock-Georgetown, TX
- Population (ZIP)
- 55,631
- Household income
- $115,213
- Rent vs Own
- Severe rent burden
- 2066.0
Population outlook (Travis County) Hauer SSP2
- Today (2025)
- 1,545,133 people
- By 2030
- 1,729,269 · +11.9%
- By 2040
- 2,097,596 · +35.8%
- By 2050
- 2,463,890 · +59.5%
- By 2075
- 3,249,374 · +110.3%
- By 2100
- 3,801,868 · +146.1%
Race, ethnicity, and origin ACS 2023
- Neighborhood character
- Diverse neighborhood (Simpson 0.63)
- Race & ethnicity
- White 49% Hispanic / Latino 35% Two or more races 17% Asian 5% Black 5%
- Hispanic origin (detail)
- Mexican 28%
- Common ancestry
- Lithuanian 2% Italian 2% Slovak 2%
- Foreign-born
- 10% · Canada, China, South Korea
- Languages at home
- 81% English-only · Spanish 15% Other Indo-European 1% Chinese 1%
Political lean MEDSL · Travis
- 2024 margin
- Solid D (+39.3) · D 68.8% · R 29.4% · Other 1.8%
- 2008→2024 swing
- +9.9pp toward D · 2008: 29.4pp · 2024: 39.3pp
- All cycles
- 2024: D+39.3 2020: D+45.0 2016: D+38.9 2012: D+23.9 2008: D+29.4
Not yet ingested
- Civics
- —
Market trends
- HPI YoY
- ▼ -427.12%
- Current HPI
- 234.9355
- Rent YoY
- ▼ -2.66%
- Metro
- Austin-Round Rock-Georgetown, TX
- State GDP YoY
- ▲ 3.95%
- F500 in state
- 110
Industry mix (Fortune 500 HQ in TX)
| Industry | F500 HQs | Revenue |
|---|---|---|
| Energy | 16 | $1,198B |
|
||
| Technology | 5 | $198B |
|
||
| Engineering / Construction | 4 | $72B |
|
||
| Energy Services | 3 | $60B |
|
||
| Utilities | 3 | $41B |
|
||
| Healthcare | 2 | $330B |
|
||
Price history
1 event — show timeline
- 2026-03-07 Listed $249,999 Unlock MLS
Cash-flow waterfall
monthlySold comps — $/sqft
last 12 mo · ≤1 miLoading sold comps…