106 Windmere Dr · Colonial Heights, VA
Flood risk 1/10 · Minimal
- FEMA flood zone
- X (unshaded)
- Chance of flooding over 30 yrs
- 0.0%
- Est. flood insurance / yr
- $507 – $1,088
Fire risk 2/10 · Minimal
- Est. fire insurance / yr
- $666 – $1,236
Heat risk 8/10 · Major
- Hot days now (above 110°F)
- 7 days/yr
- Hot days in 30 yrs
- 16 days/yr
Wind risk 6/10 · Moderate
- Chance of severe wind over 30 yrs
- 38.0%
Air-quality risk 2/10 · Minimal
- Unhealthy air days now
- 0 days/yr
- Unhealthy air days in 30 yrs
- 1 days/yr
Risk factors via First Street. Map © Google.
Why this score? — see what drove the C- grade
The composite is a weighted blend of 9 inputs, each scored 0–100. Each bar is that input's sub-score; the figure is the points it added to the 100-point composite (weight × sub-score).
- ARV discount +15.0/15.0
- Cash flow +13.3/30.0
- Schools +4.9/10.0
- Rent growth +4.4/5.0
- DSCR +4.0/10.0
- 1% rule +3.8/10.0
- Livability +3.7/5.0
- Condition / age +2.5/5.0
- Appreciation +0.0/10.0
$199,990
🖨 Deal sheet 📄 Offer letter ✓ Due diligence
Listing remarks
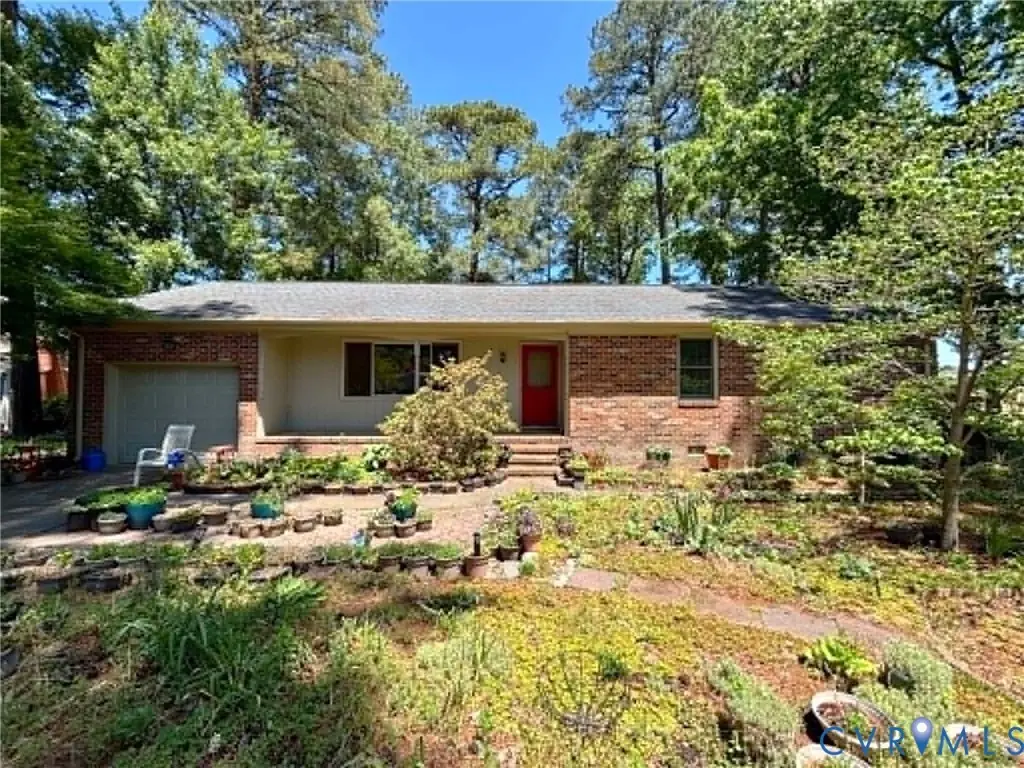
Great investment opportunity! This brick rancher offers 1,338 square feet including hardwood floors, newer windows, roof replaced in 2015, a nice screened porch, rear patio, lots of landscaping, a large almost half-acre fenced yard, and a 1-car garage. Flip the property and sell it, fix it up and move in, renovate and rent it out - lots of possibilities! Located in the Huntington subdivision near Tussing Elementary, this home has a lot to offer, lots of curb appeal, and is on a quiet street that's also convenient to surrounding schools, parks, and cities - check it out! Property is sold in AS-IS condition.
Key facts
- Brick rancher
- Fenced yard
- Newer windows
Tags
Property features AI
Finance
- Other: Lot is approximately 0.45 acre; Zoning: R2; Above-grade finished area: 1,338 (area value provided)
- Financial info: Financial details not provided
- HOA & community: HOA/community details not provided
Exterior
- Parking: Attached garage (1 car)
- Security: Security details not provided
- Utilities: Public water; Public sewer
- Home design: Single-story home; Resale property
- Construction: Brick construction; Composition roof; Built (actual year not provided)
- Exterior features: Rear porch; Patio; Screened porch
Interior
- Kitchen: Kitchen details not provided
- Bedrooms: Bedrooms information not provided
- Flooring: Flooring details not provided
- Bathrooms: 2 full bathrooms; One full bath on the first level with tub & shower
- Heating & cooling: Baseboard electric heating
- Interior features: Masonry fireplace (1)
- Laundry & utility: Laundry details not provided
Neighborhood map
What this means for you Summary
Snapshot
- This is a 3-bed/2.0-bath single-family listed at $200k.
Deal economics
- At list price, monthly cash flow is $1 ($8/yr) — positive.
- The deal already cash-flows at list — no discount required.
- To meet the 1% rule (rent ≥ 1% of price), the offer needs to be $175k (12.3% below list).
- Recommended offer: $175k (12.3% below list) — sets the bar for 1% rule.
- Cap rate 6.3% vs local median 4.2% in Colonial Heights — top-decile yield for the area; either an underpriced asset or a hidden risk that comps aren't pricing in. Stress-test before assuming the spread holds.
Location & tenants
- Location reads 74/100 on livability (#146 in VA, #4,726 nationally) — a middle-class / working-renter tenant base. Strengths: cost of living A+, housing A+, health & safety A+; Watch: employment C-, amenities D, crime F.
- Colonial Heights City Public School District (suburban): math 52% / reading 64% proficiency, ranked #67 of 131 in VA (top 51%) — acceptable for families but not a draw, mixed tenant base, ~2y average lease.
- Market conditions: Rents rising fast (+7.5%/yr); 124 active listings in the ZIP; 1 comparable units currently listed for rent nearby; solid renter incomes; 17 units permitted in Colonial Heights city in 2024 (0 in 5+ unit buildings).
Forward outlook
- Local home prices are declining (-3.0%/yr); year-one equity from $1k of loan paydown is wiped out by about $6k of value loss. Plan a longer hold.
- Colonial Heights County population projected at +15% by 2050 — long-run rental-demand tailwind backs the buy-and-hold thesis.
Negotiation context
- Only 9 days on market — expect competitive offers; lowballing is unlikely to land.
Risks & watch-outs
- Climate carrying-cost: major wind risk, 38% chance of damaging wind over 30y; extreme-heat days projected 7→16/yr by 2055 (HVAC capex compounding) — expect insurance premiums to compound above CPI over the hold.
Questions for the listing agent
- Built in 1971 — when were the roof, HVAC, electrical panel, plumbing, and water heater last replaced?
- Is there a deadline driving the sale (1031 exchange, divorce, estate, relocation)? That informs how much negotiation room exists.
- Schools are A-rated — typically a magnet for longer-tenancy family renters. What's the average tenant stay here, and is there a school-zone premium baked into asking?
- Crime grade is F in this area — have there been break-ins, vandalism, or insurance claims at this property in the last 3 years? What carrier currently insures it and at what premium?
- What's the average days-on-market for RENTAL listings here right now (not sales)? A rising rental-DOM trend means longer vacancies and softer asking-rent achievability than the comps imply.
- What's the recent tenant-quality profile in this submarket — average credit score on applications, eviction rate, late-payment / NSF rate, and stable-employment percentage? A property-management company in the area should have these aggregated.
- How much new for-sale + rental construction is in the pipeline within 1–3 miles? Heavy new supply typically softens prices + rents 12–24 months out; constrained supply supports both.
Investment metrics
- 1% rule
- 0.88% ✗
- Cap rate
- 6.30%
- Cash-on-cash
- 0.01%
- DSCR
- 1.00
- GRM
- 9.5
CMA / ARV
- ARV (median comp)
- $292,306
- List price
- $199,990
- Delta
- -31.58%
- Verdict
- UNDERPRICED
- Comps
- 20 within 1.0 mi
Show comp detail 12 sales within ~0.75 mi
| Address | Dist | Beds/Ba | Sqft | Sold | Price | $/sf | Match |
|---|---|---|---|---|---|---|---|
| 106 Windmere Dr | 0.00mi | 3/2.0 | 1,338 (0%) | 0mo | $203,217 | $152 | 100 |
| 203 Windmere Dr | 0.05mi | 3/1.5 | 1,426 (+7%) | 7mo | $316,000 | $222 | 79 |
| 3885 Perthshire Ln | 0.49mi | 3/2.0 | 1,345 (+0%) | 2mo | $335,000 | $249 | 74 |
| 115 Huntington Rd | 0.18mi | 3/1.5 | 1,482 (+11%) | 6mo | $314,950 | $213 | 67 |
| 1030 Briarcliffe Dr | 0.38mi | 3/1.5 | 1,248 (-7%) | 4mo | $270,000 | $216 | 66 |
| 1267 Briarcliffe Dr | 0.45mi | 3/2.0 | 1,426 (+7%) | 6mo | $345,000 | $242 | 63 |
| 5106 Conduit Rd | 0.29mi | 3/2.0 | 1,148 (-14%) | 1mo | $289,900 | $253 | 62 |
| 342 Pinecliffe Dr | 0.52mi | 3/2.0 | 1,426 (+7%) | 4mo | $348,500 | $244 | 61 |
| 3867 Perthshire Ln | 0.54mi | 3/2.0 | 1,414 (+6%) | 8mo | $393,000 | $278 | 59 |
| 225 Kennon Pointe Dr | 0.69mi | 3/2.0 | 1,303 (-3%) | 8mo | $352,000 | $270 | 57 |
| 1210 Wellington Rd | 0.64mi | 3/2.0 | 1,450 (+8%) | 2mo | $319,990 | $221 | 55 |
| 336 Pinecliffe Dr | 0.53mi | 3/2.0 | 1,467 (+10%) | 8mo | $360,000 | $245 | 52 |
Match score weights: distance 35% · size 25% · config 20% · recency 20%. Top-matched comps best support the ARV.
Projected returns pro-forma
-3.0% appreciation · 7.5% rent growth · sell at horizon
- IRR
- -11.3%
- Equity multiple
- 0.57×
- Total profit
- $-24,038
- Equity at exit
- $29,819
- IRR
- 3.4%
- Equity multiple
- 1.30×
- Total profit
- $16,611
- Equity at exit
- $17,291
Cash invested: $55,997 (down + closing). Projections, not guarantees.
Landlord ↔ Tenant lean methodology
- Overall (STATE)
- 55 Moderately Landlord-Leaning
- State Virginia
- 55 Moderately Landlord-Leaning · D+2
- County
- — inherits STATE
- City
- — inherits STATE
ZIP-level market 23834
- Rents YoY
- 7.5%
- Active inventory
- 124
- Price-to-rent
- 9.5×
Monthly cashflow live
- Estimated rent
- $1,753 medium interval (Pro) →
- Mortgage (P&I)
- −$1,049
- Tax from tax record
- −$252 /mo · $3,030/yr
- Insurance
- −$83
- HOA
- −$0
- Vacancy / Maint / Mgmt
- −$368
- Net cashflow
- $1
Break-even live
UW: 25.0% down · 7.5% · 30yr · 1.5% tax · 5.0% vac · 8.0% maint · 8.0% mgmt
Financing live
Cash to close
- Down payment
- $49,998
- Closing costs
- $6,000
- Reserves months
- —
- Total cash needed
- —
Loan-product check · same deal, 3 products live
Conventional
25% down · 7.5% · 30yr
- Down + closing
- —
- Monthly P&I
- —
- Monthly cashflow
- —
- DSCR
- —
- Eligible?
- —
Personal DTI + credit; lowest rate.
DSCR
20% down · 8.5% · 30yr
- Down + closing
- —
- Monthly P&I
- —
- Monthly cashflow
- —
- DSCR
- —
- Eligible?
- —
No personal income docs; deal must DSCR.
Hard money
10% down · 12.0% · 12mo
- Down + closing
- —
- Monthly P&I
- —
- Monthly cashflow
- —
- DSCR
- —
- Eligible?
- —
Short-term bridge; refi at stabilization.
Rent comps 1 comps
| Address | Beds | Baths | Sqft | Rent | $/sqft | DOM | Units | Dist |
|---|---|---|---|---|---|---|---|---|
| 100 Clearfield Cir Colonial Heights, VA | 2.0–3.0 | 2.0 | 1048 | $1,611 | $1.54 | 1d | 7 | 1.19mi |
Listing history 2 events
-
2026-05-11$199,990 Active 613-char remark
-
1982-11-04soldstatus $68,000
ⓘ Source: listings_history table (triggers on properties + properties_extension) + one-shot
backfill from property_details.listing_events for pre-trigger history.
Tax reassessment forecast VA · Resets to sale price
- Current annual tax
- $3,030 · $252/mo
- Projected year-2 tax
- $3,030 · $252/mo
- Expected delta
- $0/yr ($0/mo · 0.0%)
ⓘ Screening estimate from a state-policy table — verify with the county assessor before closing.
Climate risk First Street
- Flood 1/10 Low FEMA zone X (unshaded) · 0% chance over 30 yrs
- Wildfire 2/10 Low
- Heat 8/10 Severe 7 d/yr ≥110°F today · 16 d/yr by 30 yrs out
- Wind 6/10 Major 38% chance of damaging wind over 30 yrs
- Air quality 2/10 Low 0 unhealthy d/yr today · 1 by 30 yrs out
Nearby sold comps map
Loading sold comps map…
Walkable amenities ~0.75 mi
Loading nearby amenities…
Taxation est. · year 1
- Rental income
- $21,042
- − Mortgage interest
- −$11,203
- − Property taxes
- −$3,030
- − Insurance
- −$1,000
- − Repairs & maintenance
- −$1,683
- − Management
- −$1,683
- − Depreciation
- −$5,818
- Taxable loss
- −$3,375
- Est. tax savings @ 24.0%
- +$810
- After-tax cash flow
- $818/yr
For passive investors: Depreciation is non-cash, so a rental often shows a tax loss while cash-flowing — sheltering income. Rental losses are passive: they offset passive income freely, and up to $25,000/yr can offset ordinary (W-2) income if you actively participate and your MAGI is under $100k (phasing out to $0 by $150k); unused losses carry forward. On sale, claimed depreciation is recaptured at up to 25%, and gains may owe capital-gains tax (a 1031 exchange can defer both). Figures are a year-1 estimate at your 24.0% rate — not tax advice; consult a CPA.
Schools (NCES district)
- District
- Colonial Heights City Public School District
- NCES district ID
- 5100960
- Math proficiency
- 52% ▼ -31.00%
- Reading proficiency
- 64% ▼ -12.00%
- Median HH income
- $50,368
- Composite
- 49.41/100
- National rank
- #2011
- State rank
- #67 of 131 in VA
Livability — Colonial Heights
- Score
- 74/100
- State rank
- #146
- US rank
- #4726
Category grades
Schools grade is shown separately in the Schools card above.
Census & demographics
- Census place
- Colonial Heights, VA
- County
- Chesterfield County · 406,988 people
- City population
- 26,628
- Metro
- Richmond, VA
- Population (ZIP)
- 26,628
- Household income
- $84,338
- Rent vs Own
- Severe rent burden
- 814.0
Population outlook (Colonial Heights County) Hauer SSP2
- Today (2025)
- 18,627 people
- By 2030
- 19,110 · +2.6%
- By 2040
- 20,215 · +8.5%
- By 2050
- 21,424 · +15.0%
- By 2075
- 24,692 · +32.6%
- By 2100
- 26,164 · +40.5%
Race, ethnicity, and origin ACS 2023
- Neighborhood character
- Majority White (63%)
- Race & ethnicity
- White 63% Black 22% Hispanic / Latino 8% Two or more races 5% Asian 3%
- Hispanic origin (detail)
- Mexican 3% Puerto Rican 3%
- Common ancestry
- Serbian 2% Slovak 2% Lithuanian 2%
- Foreign-born
- 7% · Canada, China, South Korea
- Languages at home
- 91% English-only · Spanish 5% Other Indo-European 2% Korean 1%
Political lean MEDSL · Colonial Heights
- 2024 margin
- Solid R (+32.5) · D 33.4% · R 65.8%
- 2008→2024 swing
- +8.2pp toward D · 2008: -40.7pp · 2024: -32.5pp
- All cycles
- 2024: R+32.5 2020: R+33.2 2016: R+39.3 2012: R+39.5 2008: R+40.7
Not yet ingested
- Civics
- —
Market trends
- HPI YoY
- ▼ -212.28%
- Current HPI
- 294.4478
- Rent YoY
- ▲ 7.50%
- Metro
- Richmond, VA
- State GDP YoY
- ▲ 2.40%
- F500 in state
- 50
Industry mix (Fortune 500 HQ in VA)
| Industry | F500 HQs | Revenue |
|---|---|---|
| Aerospace / Defense | 4 | $236B |
|
||
| Technology / Defense | 3 | $32B |
|
||
| Financial Services | 2 | $176B |
|
||
| Utilities | 2 | $27B |
|
||
| Insurance | 2 | $25B |
|
||
| Technology | 2 | $15B |
|
||
Price history
+198.8% since first listed4 events — show timeline
- 2026-06-04 Sold (MLS) $203,217 CVRMLS
- 2026-05-21 Pending — CVRMLS
- 2026-05-11 Listed $199,990 CVRMLS
- 1982-11-04 Sold (Public Records) $68,000 Public Records
Property tax history
+4.3%/yrLatest (2026): $3,030 · +14.1% YoY. Source: county tax records.
Cash-flow waterfall
monthlySold comps — $/sqft
last 12 mo · ≤1 miLoading sold comps…