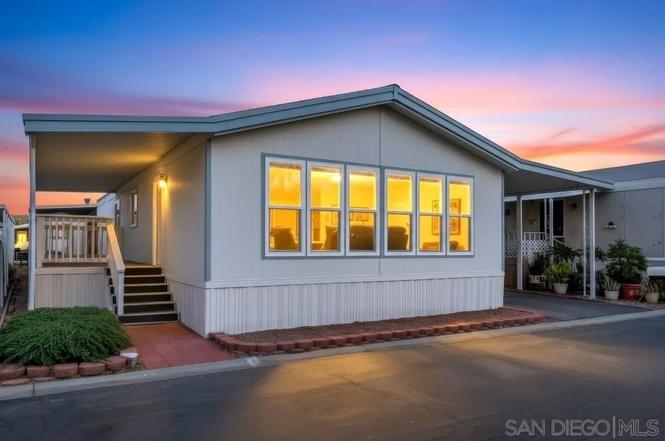
11949 Riverside Dr #28 · Lakeside, CA
Flood risk 1/10 · Minimal
- FEMA flood zone
- X (unshaded)
- Chance of flooding over 30 yrs
- 0.0%
- Est. flood insurance / yr
- $507 – $1,088
Fire risk 6/10 · Moderate
- Est. fire insurance / yr
- $659 – $1,223
Heat risk 6/10 · Moderate
- Hot days now (above 97°F)
- 7 days/yr
- Hot days in 30 yrs
- 20 days/yr
Wind risk 1/10 · Minimal
- Chance of severe wind over 30 yrs
- —
Air-quality risk 5/10 · Moderate
- Unhealthy air days now
- 7 days/yr
- Unhealthy air days in 30 yrs
- 7 days/yr
Risk factors via First Street. Map © Google.
Why this score? — see what drove the D grade
The composite is a weighted blend of 9 inputs, each scored 0–100. Each bar is that input's sub-score; the figure is the points it added to the 100-point composite (weight × sub-score).
- Cash flow +13.7/30.0
- ARV discount +8.8/15.0
- Schools +4.4/10.0
- DSCR +4.1/10.0
- 1% rule +3.8/10.0
- Rent growth +3.4/5.0
- Livability +2.8/5.0
- Condition / age +2.5/5.0
- Appreciation +0.0/10.0
$299,000
🖨 Deal sheet (PDF) 📄 Offer letter ✓ Due diligence
Listing remarks
Exquisite Golf Course Remodel in Willowbrook Welcome to this stunningly reimagined golf course home, where modern elegance meets effortless comfort. Thoughtfully redesigned with an open-concept layout, this residence is ideal for both entertaining and everyday living. The chef-inspired kitchen is the heart of the home, featuring brand-new soft-close cabinetry, high-end appliances, a 5-burner range, and striking quartz countertops that beautifully blend style and function. Expansive windows showcase breathtaking golf course views, tranquil waterways, and the graceful flight of native birds — creating a peaceful backdrop you’ll enjoy every day. The spacious primary suite offers a
Key facts
- Quartz countertops
- High-end appliances
- 5-burner range
Tags
Property features AI
Finance
- HOA & community: Community clubhouse; Community pool; Located in a senior community (Willowbrook East, Lakeside subdivision)
Exterior
- Parking: Tandem parking for 2 vehicles
- Utilities: Sewer connected; Natural gas available and connected; Cable available
- Home design: Single-story manufactured home; Residential property; Updated/Remodeled
- Construction: Composition roof
- Exterior features: Community pool; Shed(s); Golf course frontage; Has a view
Interior
- Kitchen: Dishwasher; Gas oven; Gas cooktop; Disposal
- Bedrooms: 2 possible bedrooms
- Flooring: Linoleum; Vinyl
- Bathrooms: 2 full bathrooms
- Heating & cooling: Forced air heating (natural gas); Central air conditioning (gas)
- Interior features: Updated/remodeled interior; Dishwasher; Disposal; Gas oven; Gas cooktop; Gas water heater; Linoleum flooring; Vinyl flooring
- Laundry & utility: Gas water heater
Neighborhood map
What this means for you Summary
Snapshot
- This is a 2-bed/2.0-bath manufactured listed at $299k.
Deal economics
- At list price, monthly cash flow is $21 ($247/yr) — positive.
- The deal already cash-flows at list — no discount required.
- To meet the 1% rule (rent ≥ 1% of price), the offer needs to be $264k (11.7% below list).
- Recommended offer: $264k (11.7% below list) — sets the bar for 1% rule.
- Cap rate 6.4% vs local median 2.5% in Lakeside — top-decile yield for the area; either an underpriced asset or a hidden risk that comps aren't pricing in. Stress-test before assuming the spread holds.
Location & tenants
- Location reads 55/100 on livability (#877 in CA) — a working-class tenant base; expect higher turnover. Strengths: employment A-, housing A-, health & safety B; Watch: commute D, crime D-, amenities F.
- Lakeside Union Elementary (suburban): math 41% / reading 52% proficiency, ranked #480 of 1,400 in CA (top 34%) — families likely to look elsewhere, expect single-tenant / working-renter base with shorter leases.
- Zoned schools: Lakeside Farms Elementary (649 students, 32% FRL); Lakeside Middle (676 students, 32% FRL); El Capitan High (math 20% / reading 54%, grade F, #578 of 1,170 statewide, top 51%, 1,825 students, 52% FRL) — zoned schools at 39% FRL track the district average.
- Market conditions: Rents rising (+3.6%/yr); 149 active listings in the ZIP; 15 comparable units currently listed for rent nearby; rentals leasing fast (median 0d on market — plan ~1-2 weeks tenant-placement turnaround); solid renter incomes; 11,759 units permitted in San Diego County in 2024 (7,244 in 5+ unit buildings).
Forward outlook
- Local home prices are declining (-3.0%/yr); year-one equity from $2k of loan paydown is wiped out by about $9k of value loss. Plan a longer hold.
- San Diego County population projected at +20% by 2050 — long-run rental-demand tailwind backs the buy-and-hold thesis.
Negotiation context
- It's been on market 91 days — a 9% lower offer ($272k) is reasonable based on typical stale-listing flexibility.
- Current owner paid $24k; list at $299k implies a 1146% gain — meaningful room to come down on a strong offer.
Risks & watch-outs
- Climate carrying-cost: major wildfire risk; extreme-heat days projected 7→20/yr by 2055 (HVAC capex compounding) — expect insurance premiums to compound above CPI over the hold.
Questions for the listing agent
- It's been on market 91 days. Have you received any prior offers? Is the seller open to a 12% concession, seller financing, or rate buy-down credit?
- Why hasn't it sold? Are there any deal-killer items the seller is aware of (foundation, flood, title, zoning, code violations)?
- Is there a deadline driving the sale (1031 exchange, divorce, estate, relocation)? That informs how much negotiation room exists.
- Crime grade is D in this area — have there been break-ins, vandalism, or insurance claims at this property in the last 3 years? What carrier currently insures it and at what premium?
- The area grade is low — what's the realistic commute time and amenity access for the typical tenant pool here? Any planned neighborhood developments (good or bad) we should know about?
- What's the average days-on-market for RENTAL listings here right now (not sales)? A rising rental-DOM trend means longer vacancies and softer asking-rent achievability than the comps imply.
- What's the recent tenant-quality profile in this submarket — average credit score on applications, eviction rate, late-payment / NSF rate, and stable-employment percentage? A property-management company in the area should have these aggregated.
- How much new for-sale + rental construction is in the pipeline within 1–3 miles? Heavy new supply typically softens prices + rents 12–24 months out; constrained supply supports both.
Investment metrics
- 1% rule
- 0.88% ✗
- Cap rate
- 6.38%
- Cash-on-cash
- 0.30%
- DSCR
- 1.01
- GRM
- 9.4
CMA / ARV
- ARV (on-the-fly)
- $307,776
- Comps found
- 12
Show comp detail 12 sales within ~0.75 mi
| Address | Dist | Beds/Ba | Sqft | Sold | Price | $/sf | Match |
|---|---|---|---|---|---|---|---|
| 11949 Riverside Dr #133 | 0.00mi | 2/2.0 | 1,376 (+2%) | 1mo | $161,000 | $117 | 95 |
| 11949 Riverside Dr #155 | 0.15mi | 2/2.0 | 1,344 (0%) | 2mo | $95,000 | $71 | 92 |
| 11949 Riverside Dr #55 | 0.08mi | 2/2.0 | 1,248 (-7%) | 1mo | $125,000 | $100 | 84 |
| 11949 Riverside Dr #25 | 0.00mi | 2/2.0 | 1,344 (0%) | 22mo | $340,000 | $253 | 81 |
| 11851 Riverside Dr #246 | 0.19mi | 2/2.0 | 1,400 (+4%) | 10mo | $418,500 | $299 | 76 |
| 11851 Riverside Dr Spc 223 | 0.19mi | 2/2.0 | 1,418 (+6%) | 10mo | $375,000 | $264 | 74 |
| 11851 Riverside Dr #262 | 0.19mi | 3/2.0 (+1) | 1,331 (-1%) | 20mo | $342,000 | $257 | 68 |
| 11949 Riverside Dr #38 | 0.00mi | 3/2.0 (+1) | 1,536 (+14%) | 4mo | $192,500 | $125 | 67 |
| 11851 RIVERSIDE Dr #238 | 0.19mi | 3/2.0 (+1) | 1,400 (+4%) | 15mo | $375,000 | $268 | 67 |
| 11851 Riverside Dr Spc 260 | 0.19mi | 3/2.0 (+1) | 1,360 (+1%) | 23mo | $300,000 | $221 | 65 |
| 11851 Riverside #202 | 0.19mi | 3/2.0 (+1) | 1,246 (-7%) | 21mo | $285,000 | $229 | 56 |
| 11949 Riverside Dr #7 | 0.00mi | 3/2.0 (+1) | 1,530 (+14%) | 21mo | $278,900 | $182 | 54 |
Match score weights: distance 35% · size 25% · config 20% · recency 20%. Top-matched comps best support the ARV.
Projected returns pro-forma
-3.0% appreciation · 3.56% rent growth · sell at horizon
- IRR
- -15.2%
- Equity multiple
- 0.46×
- Total profit
- $-45,603
- Equity at exit
- $44,582
- IRR
- -5.7%
- Equity multiple
- 0.62×
- Total profit
- $-31,649
- Equity at exit
- $25,852
Cash invested: $83,720 (down + closing). Projections, not guarantees.
Landlord ↔ Tenant lean methodology
- Overall (STATE)
- 18 Strongly Tenant-Friendly
- State California
- 18 Strongly Tenant-Friendly · D+13
- County
- — inherits STATE
- City
- — inherits STATE
ZIP-level market 92040
- Rents YoY
- 3.6%
- Active inventory
- 149
- Price-to-rent
- 9.4×
Monthly cashflow live
- Estimated rent
- $2,642 high interval (Pro) →
- Mortgage (P&I)
- −$1,568
- Tax est. 1.5%
- −$374 /mo · $4,485/yr
- Insurance
- −$125
- HOA
- −$0
- Vacancy / Maint / Mgmt
- −$555
- Net cashflow
- $21
Break-even live
Sensitivity live
| Price | -10% $227 | -5% $124 | +0% $21 | +5% $-83 | +10% $-186 |
|---|---|---|---|---|---|
| Rent | -10% $-188 | -5% $-84 | +0% $21 | +5% $125 | +10% $229 |
| Rate | -1.0pp $171 | -0.5pp $97 | base $21 | +0.5pp $-57 | +1.0pp $-136 |
UW: 25.0% down · 7.5% · 30yr · 1.5% tax · 5.0% vac · 8.0% maint · 8.0% mgmt
Financing live
Cash to close
- Down payment
- $74,750
- Closing costs
- $8,970
- Reserves months
- —
- Total cash needed
- —
Loan-product check · same deal, 3 products live
Conventional
25% down · 7.5% · 30yr
- Down + closing
- —
- Monthly P&I
- —
- Monthly cashflow
- —
- DSCR
- —
- Eligible?
- —
Personal DTI + credit; lowest rate.
DSCR
20% down · 8.5% · 30yr
- Down + closing
- —
- Monthly P&I
- —
- Monthly cashflow
- —
- DSCR
- —
- Eligible?
- —
No personal income docs; deal must DSCR.
Hard money
10% down · 12.0% · 12mo
- Down + closing
- —
- Monthly P&I
- —
- Monthly cashflow
- —
- DSCR
- —
- Eligible?
- —
Short-term bridge; refi at stabilization.
Rent comps 15 comps
| Address | Beds | Baths | Sqft | Rent | $/sqft | DOM | Units | Dist |
|---|---|---|---|---|---|---|---|---|
| 12156 Lakeside Ave Lakeside, CA | 3.0 | 2.0 | 1424 | $3,500 | $2.46 | 0d | 1 | 0.26mi |
| 9830 Summersun Ln Lakeside, CA | 2.0–3.0 | 1.5–2.5 | 1325 | $2,400 | $1.81 | 0d | 1 | 0.65mi |
| 12370 Parkside St Lakeside, CA | 2.0 | 2.0 | 944 | $1,925 | $2.04 | 9d | 1 | 0.71mi |
| 12001 Woodside Ave Lakeside, CA | 2.0 | 2.0 | 1006 | $2,350 | $2.34 | 0d | 1 | 0.71mi |
| 12618 Laurel St Unit 12618 C Lakeside, CA | 3.0 | 1.0 | 1100 | $2,390 | $2.17 | 3d | 1 | 0.85mi |
| 10112 Ashwood St Lakeside, CA | 2.0 | 1.0–2.0 | 763 | $1,944 | $2.55 | 0d | 8 | 0.87mi |
| 12645 Laurel St Apt 13 Lakeside, CA | 2.0 | 2.0 | 900 | $1,950 | $2.17 | 0d | 1 | 0.90mi |
| 12645 Laurel St Lakeside, CA | 2.0 | 2.0 | 900 | $1,950 | $2.17 | 12d | 1 | 0.90mi |
| 12650 Lakeshore Dr #158 Lakeside, CA | 2.0 | 2.0 | 900 | $2,500 | $2.78 | 0d | 1 | 0.96mi |
| 9662 Marilla Dr Lakeside, CA | 2.0 | 2.0 | 931 | $2,388 | $2.56 | 3d | 4 | 0.97mi |
| 9662 Marilla Dr Unit 93 Lakeside, CA | 2.0 | 2.0 | 931 | $2,350 | $2.52 | 12d | 1 | 0.97mi |
| 9728 Marilla Dr #305 Lakeside, CA | 2.0 | 2.0 | 944 | $2,590 | $2.74 | 0d | 1 | 0.98mi |
| 12840 Mapleview St Lakeside, CA | 2.0 | 2.0 | 880 | $2,100 | $2.39 | 0d | 2 | 1.04mi |
| 12738 Lakeshore Dr Lakeside, CA | 3.0 | 2.5 | 1368 | $4,300 | $3.14 | 9d | 1 | 1.04mi |
| 9205 Emerald Grove Ave Lakeside, CA | 3.0 | 2.0 | 1652 | $3,650 | $2.21 | 4d | 1 | 1.44mi |
Listing history 9 events
-
2026-06-03statusdays on market $299,000 Pending 91 DOM
-
2026-06-02days on market $299,000 Active 90 DOM
-
2026-06-01days on market $299,000 Active 89 DOM
-
2026-05-31days on market $299,000 Active 88 DOM
-
2026-04-13price $299,000
-
2026-03-24price $309,000
-
2026-03-16price $319,000
-
2026-03-04$329,000 Active
-
1994-08-11soldstatus $24,000
ⓘ Source: listings_history table (triggers on properties + properties_extension) + one-shot
backfill from property_details.listing_events for pre-trigger history.
Climate risk First Street
- Flood 1/10 Low FEMA zone X (unshaded) · 0% chance over 30 yrs
- Wildfire 6/10 Major
- Heat 6/10 Major 7 d/yr ≥97°F today · 20 d/yr by 30 yrs out
- Wind 1/10 Low
- Air quality 5/10 Major 7 unhealthy d/yr today · 7 by 30 yrs out
Nearby sold comps map
Loading sold comps map…
Walkable amenities ~0.75 mi
Loading nearby amenities…
Taxation est. · year 1
- Rental income
- $31,700
- − Mortgage interest
- −$16,749
- − Property taxes
- −$4,485
- − Insurance
- −$1,495
- − Repairs & maintenance
- −$2,536
- − Management
- −$2,536
- − Depreciation
- −$8,698
- Taxable loss
- −$4,799
- Est. tax savings @ 24.0%
- +$1,152
- After-tax cash flow
- $1,399/yr
For passive investors: Depreciation is non-cash, so a rental often shows a tax loss while cash-flowing — sheltering income. Rental losses are passive: they offset passive income freely, and up to $25,000/yr can offset ordinary (W-2) income if you actively participate and your MAGI is under $100k (phasing out to $0 by $150k); unused losses carry forward. On sale, claimed depreciation is recaptured at up to 25%, and gains may owe capital-gains tax (a 1031 exchange can defer both). Figures are a year-1 estimate at your 24.0% rate — not tax advice; consult a CPA.
Schools (NCES district)
- District
- Lakeside Union Elementary
- NCES district ID
- 0620790
- Math proficiency
- 41% ▬ 0.00%
- Reading proficiency
- 52% ▼ -1.00%
- Median HH income
- $65,574
- Composite
- 43.51/100
- National rank
- #6453
- State rank
- #480 of 1400 in CA
Livability — Lakeside
- Score
- 55/100
- State rank
- #877
- US rank
- #23702
Category grades
Schools grade is shown separately in the Schools card above.
Census & demographics
- Census place
- Lakeside, CA
- County
- San Diego County · 3,178,799 people
- City population
- 46,216
- Metro
- San Diego-Chula Vista-Carlsbad, CA
- Population (ZIP)
- 46,216
- Household income
- $107,937
- Rent vs Own
- Severe rent burden
- 1147.0
Population outlook (San Diego County) Hauer SSP2
- Today (2025)
- 3,678,185 people
- By 2030
- 3,856,546 · +4.8%
- By 2040
- 4,171,407 · +13.4%
- By 2050
- 4,421,607 · +20.2%
- By 2075
- 4,831,599 · +31.4%
- By 2100
- 4,832,502 · +31.4%
Race, ethnicity, and origin ACS 2023
- Neighborhood character
- Predominantly White (69%)
- Race & ethnicity
- White 69% Hispanic / Latino 22% Two or more races 11% Black 2% Asian 2% Native American 1%
- Hispanic origin (detail)
- Mexican 19%
- Common ancestry
- Lithuanian 3% Italian 3% Slovak 2%
- Foreign-born
- 8% · Canada
- Languages at home
- 86% English-only · Spanish 10% Arabic 1% Other Indo-European 1%
Political lean MEDSL · San Diego
- 2024 margin
- D (+16.8) · D 56.9% · R 40.1% · Other 2.9%
- 2008→2024 swing
- +6.6pp toward D · 2008: 10.2pp · 2024: 16.8pp
- All cycles
- 2024: D+16.8 2020: D+22.8 2016: D+17.8 2012: D+5.1 2008: D+10.2
Not yet ingested
- Civics
- —
Market trends
- HPI YoY
- ▼ -622.09%
- Current HPI
- 344.8263
- Rent YoY
- ▲ 3.56%
- Metro
- San Diego-Chula Vista-Carlsbad, CA
- State GDP YoY
- ▲ 3.21%
- F500 in state
- 116
Industry mix (Fortune 500 HQ in CA)
| Industry | F500 HQs | Revenue |
|---|---|---|
| Technology | 27 | $1,492B |
|
||
| Financial Services | 3 | $174B |
|
||
| Retail | 3 | $44B |
|
||
| Insurance | 3 | $26B |
|
||
| Media / Entertainment | 2 | $115B |
|
||
| Pharmaceuticals / Biotech | 2 | $62B |
|
||
Price history
+1145.8% since first listed5 events — show timeline
- 2026-04-13 Price Changed $299,000 SDMLS
- 2026-03-24 Price Changed $309,000 SDMLS
- 2026-03-16 Price Changed $319,000 SDMLS
- 2026-03-04 Listed $329,000 SDMLS
- 1994-08-11 Sold (Public Records) $24,000 Public Records
Property tax history
+3.5%/yrLatest (2013): $363 · +3.7% YoY. Source: county tax records.
Cash-flow waterfall
monthlySold comps — $/sqft
last 12 mo · ≤1 miLoading sold comps…