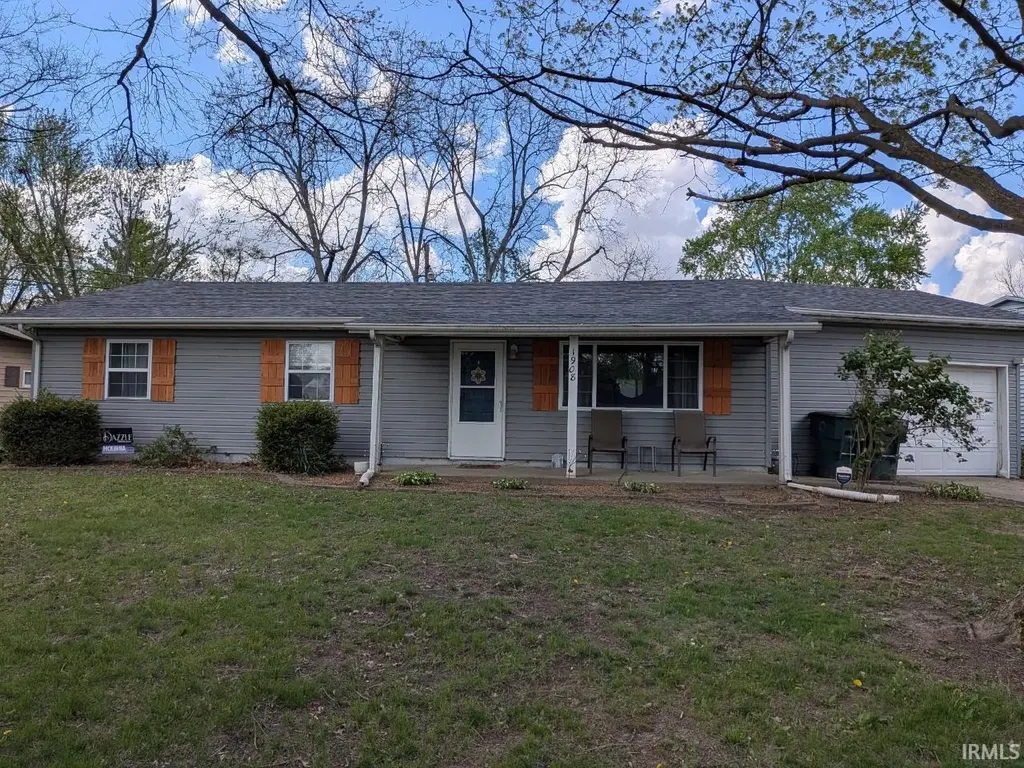
1908 W Norwood Dr · Muncie, IN
Flood risk 1/10 · Minimal
- FEMA flood zone
- X (unshaded)
- Chance of flooding over 30 yrs
- 0.0%
- Est. flood insurance / yr
- $507 – $1,088
Fire risk 1/10 · Minimal
- Est. fire insurance / yr
- $717 – $1,331
Heat risk 3/10 · Minor
- Hot days now (above 100°F)
- 7 days/yr
- Hot days in 30 yrs
- 18 days/yr
Wind risk 2/10 · Minimal
- Chance of severe wind over 30 yrs
- 0.0%
Air-quality risk 3/10 · Minor
- Unhealthy air days now
- 2 days/yr
- Unhealthy air days in 30 yrs
- 3 days/yr
Risk factors via First Street. Map © Google.
Why this score? — see what drove the D grade
The composite is a weighted blend of 9 inputs, each scored 0–100. Each bar is that input's sub-score; the figure is the points it added to the 100-point composite (weight × sub-score).
- Cash flow +13.9/30.0
- ARV discount +10.7/15.0
- Rent growth +4.5/5.0
- DSCR +4.2/10.0
- Livability +4.0/5.0
- 1% rule +3.2/10.0
- Condition / age +2.5/5.0
- Schools +1.7/10.0
- Appreciation +0.0/10.0
$149,900
🖨 Deal sheet 📄 Offer letter ✓ Due diligence
Key facts
- New roof
- New vinyl flooring
- 8,811 sq ft lot
Tags
Neighborhood map
What this means for you Summary
Snapshot
- This is a 3-bed/1.0-bath single-family listed at $150k.
Deal economics
- At list price, monthly cash flow is $16 ($195/yr) — positive.
- The deal already cash-flows at list — no discount required.
- To meet the 1% rule (rent ≥ 1% of price), the offer needs to be $123k (17.7% below list).
- Recommended offer: $123k (17.7% below list) — sets the bar for 1% rule.
Location & tenants
- Location reads 80/100 on livability (#18 in IN, #1,654 nationally) — a professional / high-income tenant draw. Strengths: amenities A+, commute A+, cost of living A+; Watch: crime F, employment F.
- Muncie Community Schools (urban): math 18% / reading 25% proficiency, ranked #275 of 301 in IN (top 91%) — low school quality limits family demand, transient renter base, plan for 1-2y turnover; 68% free/reduced lunch — lower-income household profile, screen leases tightly.
- Zoned schools: Northside Middle School (math 17% / reading 36%, grade F, #236 of 330 statewide, top 72%, 583 students, 70% FRL) — zoned schools at 70% FRL track the district average.
- Market conditions: Rents rising fast (+8.1%/yr); 202 active listings in the ZIP; 20 comparable units currently listed for rent nearby; rentals lingering (median 44d on market — plan ~5-8 weeks vacancy on turnover, expect pricing pressure); 100% of comp listings sitting > 30 days — soft ceiling on asking rent; 171 units permitted in Delaware County in 2024 (57 in 5+ unit buildings).
Forward outlook
- Local home prices are declining (-3.0%/yr); year-one equity from $1k of loan paydown is wiped out by about $4k of value loss. Plan a longer hold.
- Delaware County population projected at -11% by 2050 — secular population decline; favor cash flow + early exit over multi-decade hold.
Negotiation context
- Only 4 days on market — expect competitive offers; lowballing is unlikely to land.
- 3 sale attempts since 16y ago with the ask held roughly flat each time — persistent listings suggest the price (not the market) is what's stuck; bring a comps-based counter.
Risks & watch-outs
- Watch-outs: built in 1959 — expect roof / HVAC / electrical / plumbing capex.
Questions for the listing agent
- Built in 1959 — when were the roof, HVAC, electrical panel, plumbing, and water heater last replaced?
- Is there a deadline driving the sale (1031 exchange, divorce, estate, relocation)? That informs how much negotiation room exists.
- Schools are D-rated, which usually means shorter tenancies and higher turnover. Who's the typical renter profile here, and what's been the actual vacancy rate?
- Crime grade is F in this area — have there been break-ins, vandalism, or insurance claims at this property in the last 3 years? What carrier currently insures it and at what premium?
- The area grade is low — what's the realistic commute time and amenity access for the typical tenant pool here? Any planned neighborhood developments (good or bad) we should know about?
- What's the average days-on-market for RENTAL listings here right now (not sales)? A rising rental-DOM trend means longer vacancies and softer asking-rent achievability than the comps imply.
- What's the recent tenant-quality profile in this submarket — average credit score on applications, eviction rate, late-payment / NSF rate, and stable-employment percentage? A property-management company in the area should have these aggregated.
- How much new for-sale + rental construction is in the pipeline within 1–3 miles? Heavy new supply typically softens prices + rents 12–24 months out; constrained supply supports both.
Investment metrics
- 1% rule
- 0.82% ✗
- Cap rate
- 6.42%
- Cash-on-cash
- 0.46%
- DSCR
- 1.02
- GRM
- 10.1
CMA / ARV
- ARV (on-the-fly)
- $161,460
- Comps found
- 12
Show comp detail 12 sales within ~0.75 mi
| Address | Dist | Beds/Ba | Sqft | Sold | Price | $/sf | Match |
|---|---|---|---|---|---|---|---|
| 1908 W Norwood Dr | 0.00mi | 3/1.0 | 1,170 (0%) | 0mo | $153,900 | $132 | 100 |
| 3709 N Lanewood Dr | 0.44mi | 3/1.0 | 1,147 (-2%) | 2mo | $169,900 | $148 | 75 |
| 2008 W Bryden Rd | 0.14mi | 3/2.0 | 1,300 (+11%) | 2mo | $137,000 | $105 | 70 |
| 3509 N Lanewood Dr | 0.44mi | 3/1.0 | 1,230 (+5%) | 4mo | $180,000 | $146 | 68 |
| 3507 N Glenwood Ave | 0.31mi | 3/1.0 | 1,060 (-9%) | 2mo | $160,000 | $151 | 68 |
| 2011 W Sheffield Dr | 0.38mi | 3/1.0 | 1,248 (+7%) | 5mo | $162,000 | $130 | 67 |
| 4205 N New York Ave | 0.50mi | 3/1.0 | 1,100 (-6%) | 4mo | $159,900 | $145 | 64 |
| 1501 W Sheffield Dr | 0.48mi | 3/2.5 | 1,200 (+3%) | 5mo | $165,000 | $138 | 63 |
| 2117 N Maplewood Ave | 0.71mi | 3/2.0 | 1,188 (+2%) | 0mo | $140,000 | $118 | 60 |
| 2209 W Concord Rd | 0.48mi | 3/1.0 | 1,026 (-12%) | 5mo | $159,900 | $156 | 53 |
| 3613 N Locust St | 0.56mi | 3/1.0 | 1,050 (-10%) | 5mo | $135,000 | $129 | 53 |
| 2009 W Sherman Dr | 0.53mi | 3/1.0 | 1,024 (-12%) | 6mo | $129,000 | $126 | 50 |
Match score weights: distance 35% · size 25% · config 20% · recency 20%. Top-matched comps best support the ARV.
Projected returns pro-forma
-3.0% appreciation · 8.0% rent growth · sell at horizon
- IRR
- -10.5%
- Equity multiple
- 0.60×
- Total profit
- $-16,768
- Equity at exit
- $22,351
- IRR
- 4.4%
- Equity multiple
- 1.39×
- Total profit
- $16,273
- Equity at exit
- $12,961
Cash invested: $41,972 (down + closing). Projections, not guarantees.
Landlord ↔ Tenant lean methodology
- Overall (STATE)
- 90 Strongly Landlord-Friendly
- State Indiana
- 90 Strongly Landlord-Friendly · R+11
- County
- — inherits STATE
- City
- — inherits STATE
ZIP-level market 47304
- Home prices YoY
- -28.4%
- Rents YoY
- 8.1%
- Active inventory
- 202
- Price-to-rent
- 10.1×
Monthly cashflow live
- Estimated rent
- $1,233 high interval (Pro) →
- Mortgage (P&I)
- −$786
- Tax from tax record
- −$109 /mo · $1,313/yr
- Insurance
- −$62
- HOA
- −$0
- Vacancy / Maint / Mgmt
- −$259
- Net cashflow
- $16
Break-even live
UW: 25.0% down · 7.5% · 30yr · 1.5% tax · 5.0% vac · 8.0% maint · 8.0% mgmt
Financing live
Cash to close
- Down payment
- $37,475
- Closing costs
- $4,497
- Reserves months
- —
- Total cash needed
- —
Loan-product check · same deal, 3 products live
Conventional
25% down · 7.5% · 30yr
- Down + closing
- —
- Monthly P&I
- —
- Monthly cashflow
- —
- DSCR
- —
- Eligible?
- —
Personal DTI + credit; lowest rate.
DSCR
20% down · 8.5% · 30yr
- Down + closing
- —
- Monthly P&I
- —
- Monthly cashflow
- —
- DSCR
- —
- Eligible?
- —
No personal income docs; deal must DSCR.
Hard money
10% down · 12.0% · 12mo
- Down + closing
- —
- Monthly P&I
- —
- Monthly cashflow
- —
- DSCR
- —
- Eligible?
- —
Short-term bridge; refi at stabilization.
Rent comps 20 comps
| Address | Beds | Baths | Sqft | Rent | $/sqft | DOM | Units | Dist |
|---|---|---|---|---|---|---|---|---|
| 1810 W Northfield Dr Muncie, IN | 2.0 | 1.5 | 1418 | $1,300 | $0.92 | 43d | 1 | 0.18mi |
| 2600 N Wheeling Ave Muncie, IN | 2.0–3.0 | 1.0 | 1024 | $1,035 | $1.01 | 43d | 1 | 0.78mi |
| 2000 N Oakwood Ave Muncie, IN | 2.0 | 1.0 | 626 | $825 | $1.32 | 43d | 1 | 0.83mi |
| 3413 N Milton St Muncie, IN | 4.0 | 1.5 | 1422 | $1,350 | $0.95 | 43d | 1 | 0.88mi |
| 1801 N Glenwood Ave Muncie, IN | 2.0 | 1.0 | 1096 | $1,250 | $1.14 | 43d | 1 | 0.91mi |
| 1701 N Rosewood Ave Muncie, IN | 2.0 | 1.0 | 750 | $1,405 | $1.87 | 43d | 1 | 0.93mi |
| 2010 W Enterprise Ave Unit 2014 Muncie, IN | 2.0 | 1.0 | 864 | $800 | $0.93 | 43d | 1 | 1.04mi |
| 3905 N Franklin St Muncie, IN | 2.0 | 1.5 | 1342 | $1,200 | $0.89 | 43d | 1 | 1.07mi |
| 3906 N Franklin St Apt 1 Muncie, IN | 2.0 | 1.0 | 972 | $972 | $1.00 | 43d | 1 | 1.10mi |
| 3910 N Franklin St Muncie, IN | 2.0 | 1.5 | 1008 | $999 | $0.99 | 43d | 2 | 1.10mi |
| 1200 W Bethel Ave Muncie, IN | 3.0 | 2.0 | 1100 | $1,300 | $1.18 | 43d | 13 | 1.15mi |
| 720 W Centennial Ave Muncie, IN | 2.0–3.0 | 1.0–2.0 | 1034 | $1,099 | $1.06 | 43d | 1 | 1.17mi |
| 4000 N Walnut St Muncie, IN | 1.0–3.0 | 1.0 | 880 | $1,060 | $1.20 | 43d | 5 | 1.21mi |
| 125 E Oldfield Ln Muncie, IN | 1.0–3.0 | 1.0–2.0 | 886 | $1,325 | $1.50 | 43d | 7 | 1.24mi |
| 711 W Centennial Ave Muncie, IN | 3.0 | 2.0 | 1372 | $1,200 | $0.87 | 43d | 1 | 1.25mi |
| 3601 N Chadam Ln Muncie, IN | 1.0–2.0 | 1.0–2.0 | 822 | $2,600 | $3.16 | 43d | 33 | 1.26mi |
| 3000 W Cypress Dr Unit 3008 Muncie, IN | 2.0 | 1.0 | 1200 | $1,000 | $0.83 | 43d | 1 | 1.26mi |
| 111 E Streeter Ave Muncie, IN | 2.0–3.0 | 1.0 | 816 | $999 | $1.22 | 43d | 3 | 1.35mi |
| 222 W Centennial Ave Muncie, IN | 2.0 | 1.5 | 1042 | $925 | $0.89 | 43d | 1 | 1.40mi |
| 151 E Streeter Ave Unit 2 Bedroom Apartment Muncie, IN | 2.0 | 1.0 | 750 | $692 | $0.92 | 43d | 1 | 1.40mi |
Listing history 6 events
-
2026-04-21status Pending
-
2026-04-17$149,900 Active
-
2011-09-13historical
-
2011-07-16$79,900
-
2011-04-23historical
-
2010-03-31$84,900
ⓘ Source: listings_history table (triggers on properties + properties_extension) + one-shot
backfill from property_details.listing_events for pre-trigger history.
Tax reassessment forecast IN · Partial reset (capped growth)
- Current annual tax
- $1,313 · $109/mo
- Projected year-2 tax
- $1,313 · $109/mo
- Expected delta
- $0/yr ($0/mo · 0.0%)
ⓘ Screening estimate from a state-policy table — verify with the county assessor before closing.
Climate risk First Street
- Flood 1/10 Low FEMA zone X (unshaded) · 0% chance over 30 yrs
- Wildfire 1/10 Low
- Heat 3/10 Moderate 7 d/yr ≥100°F today · 18 d/yr by 30 yrs out
- Wind 2/10 Low 0% chance of damaging wind over 30 yrs
- Air quality 3/10 Moderate 2 unhealthy d/yr today · 3 by 30 yrs out
Nearby sold comps map
Loading sold comps map…
Walkable amenities ~0.75 mi
Loading nearby amenities…
Taxation est. · year 1
- Rental income
- $14,798
- − Mortgage interest
- −$8,397
- − Property taxes
- −$1,313
- − Insurance
- −$750
- − Repairs & maintenance
- −$1,184
- − Management
- −$1,184
- − Depreciation
- −$4,361
- Taxable loss
- −$2,390
- Est. tax savings @ 24.0%
- +$574
- After-tax cash flow
- $768/yr
For passive investors: Depreciation is non-cash, so a rental often shows a tax loss while cash-flowing — sheltering income. Rental losses are passive: they offset passive income freely, and up to $25,000/yr can offset ordinary (W-2) income if you actively participate and your MAGI is under $100k (phasing out to $0 by $150k); unused losses carry forward. On sale, claimed depreciation is recaptured at up to 25%, and gains may owe capital-gains tax (a 1031 exchange can defer both). Figures are a year-1 estimate at your 24.0% rate — not tax advice; consult a CPA.
Schools (NCES district)
- District
- Muncie Community Schools
- NCES district ID
- 1807320
- Math proficiency
- 18% ▼ -9.00%
- Reading proficiency
- 25% ▼ -4.00%
- Median HH income
- $30,052
- Composite
- 17.22/100
- National rank
- #9099
- State rank
- #275 of 301 in IN
Livability — Muncie
- Score
- 80/100
- State rank
- #18
- US rank
- #1654
Category grades
Schools grade is shown separately in the Schools card above.
Census & demographics
- Census place
- Muncie, IN
- County
- Delaware County · 84,658 people
- City population
- 84,658
- Metro
- Muncie, IN
- Population (ZIP)
- 31,237
- Household income
- $63,215
- Rent vs Own
- Severe rent burden
- 1141.0
Population outlook (Delaware County) Hauer SSP2
- Today (2025)
- 113,036 people
- By 2030
- 111,313 · -1.5%
- By 2040
- 106,432 · -5.8%
- By 2050
- 100,747 · -10.9%
- By 2075
- 91,000 · -19.5%
- By 2100
- 80,687 · -28.6%
Race, ethnicity, and origin ACS 2023
- Neighborhood character
- Predominantly White (85%)
- Race & ethnicity
- White 85% Two or more races 5% Black 4% Asian 4% Hispanic / Latino 3%
- Common ancestry
- Lithuanian 2% Romanian 2% Slovak 1%
- Foreign-born
- 5% · Canada, Vietnam, China
- Languages at home
- 94% English-only · Spanish 2% Other Indo-European 1% Vietnamese 1%
Political lean MEDSL · Delaware
- 2024 margin
- R (+15.8) · D 41.2% · R 57.0% · Other 1.8%
- 2008→2024 swing
- -30.8pp toward R · 2008: 15.0pp · 2024: -15.8pp
- All cycles
- 2024: R+15.8 2020: R+13.2 2016: R+13.7 2012: D+3.1 2008: D+15.0
Not yet ingested
- Civics
- —
Market trends
- HPI YoY
- ▼ -78.53%
- Current HPI
- 197.5213
- Rent YoY
- ▲ 8.08%
- Metro
- Muncie, IN
- State GDP YoY
- ▲ 2.90%
- F500 in state
- 18
Industry mix (Fortune 500 HQ in IN)
| Industry | F500 HQs | Revenue |
|---|---|---|
| Industrial Machinery | 2 | $37B |
|
||
| Healthcare | 1 | $177B |
|
||
| Pharmaceuticals | 1 | $45B |
|
||
| Metals / Steel | 1 | $18B |
|
||
| Agriculture | 1 | $17B |
|
||
| Packaging | 1 | $12B |
|
||
Price history
+76.6% since first listed6 events — show timeline
- 2026-04-21 Pending — IRMLS
- 2026-04-17 Listed $149,900 IRMLS
- 2011-09-13 Listing Removed — MIBOR as Distributed by MLS Grid
- 2011-07-16 Listed $79,900 MIBOR as Distributed by MLS Grid
- 2011-04-23 Listing Removed — MIBOR as Distributed by MLS Grid
- 2010-03-31 Listed $84,900 MIBOR as Distributed by MLS Grid
Property tax history
+6.2%/yrLatest (2024): $1,313 · +9.2% YoY. Source: county tax records.
Cash-flow waterfall
monthlySold comps — $/sqft
last 12 mo · ≤1 miLoading sold comps…