None · Crescent Lake, OR
Flood risk 1/10 · Minimal
- FEMA flood zone
- X
- Chance of flooding over 30 yrs
- 0.0%
- Est. flood insurance / yr
- $507 – $1,088
Fire risk 5/10 · Moderate
- Est. fire insurance / yr
- $498 – $926
Heat risk 1/10 · Minimal
- Hot days now (above 84°F)
- 8 days/yr
- Hot days in 30 yrs
- 18 days/yr
Wind risk 1/10 · Minimal
- Chance of severe wind over 30 yrs
- —
Air-quality risk 8/10 · Major
- Unhealthy air days now
- 11 days/yr
- Unhealthy air days in 30 yrs
- 12 days/yr
Risk factors via First Street. Map © Google.
Why this score? — see what drove the D grade
The composite is a weighted blend of 9 inputs, each scored 0–100. Each bar is that input's sub-score; the figure is the points it added to the 100-point composite (weight × sub-score).
- Cash flow +13.9/30.0
- ARV discount +7.5/15.0
- Appreciation +5.0/10.0
- DSCR +4.2/10.0
- 1% rule +2.8/10.0
- Rent growth +2.5/5.0
- Schools +2.5/10.0
- Livability +2.5/5.0
- Condition / age +2.5/5.0
$175,000
🖨 Deal sheet (PDF) 📄 Offer letter ✓ Due diligence
Listing remarks
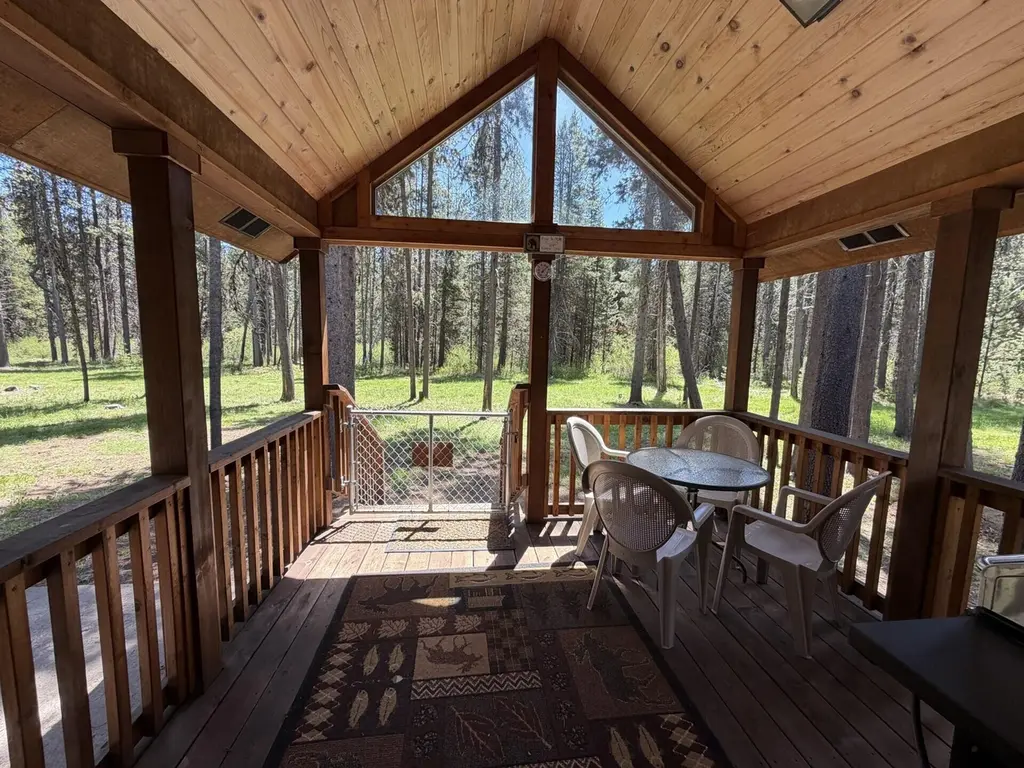
1 Bedroom 1 Bath park model Chalet w/ loft & large living room offering warm rustic feel with pine ceilings and walls. The exterior features durable cedar siding, metal roof + covered deck that overlooks peaceful meadow-perfect for relaxing & enjoying the private setting. This home comes fully furnished & is truly ready for immediate use or rental. +RV parking is available, adding flexibility for guest or extra storage. Located at Willamette Pass Inn in Crescent Lake, Oregon. The property sits within approximately 3 miles of Crescent Lake, Odell Lake, & numerous other mountain lakes, making it ideal for outdoor enthusiasts. It's also approx. 7 miles from Willamette Pa
Key facts
- Covered deck
- Metal roof
- Rv parking
Tags
Property features AI
Finance
- Financial info: Monthly land lease: $400
- HOA & community: CCRs apply
Exterior
- Parking: Driveway
- Security: Smoke and carbon monoxide detectors
- Utilities: Public water and well; Public sewer; Electricity connected; Propane available
- Home design: Mobile home (park model) on leased land; One level; May remain in park; Short-term rental permitted
- Construction: Built in 2007; Metal roof; Pillar/post/pier foundation; Wood skirting
- Exterior features: Level lot with native plants; Double-pane windows; Carbon monoxide and smoke detectors
Interior
- Kitchen: Dishwasher; Oven; Range; Range hood; Refrigerator; Water heater
- Bedrooms: 1 bedroom (Primary on main level)
- Flooring: Carpet; Laminate
- Bathrooms: 1 full bathroom
- Heating & cooling: Electric forced-air heating; Cooling (type: Other)
- Interior features: Ceiling fans; Double vanity; Primary bedroom on main level; Shower/tub combo; Vaulted ceilings; Electric fireplace in living room
Neighborhood map
What this means for you Summary
Snapshot
- This is a 2-bed/1.0-bath manufactured listed at $175k.
Deal economics
- At list price, monthly cash flow is $18 ($213/yr) — positive.
- The deal already cash-flows at list — no discount required.
- To meet the 1% rule (rent ≥ 1% of price), the offer needs to be $136k (22.4% below list).
- Recommended offer: $136k (22.4% below list) — sets the bar for 1% rule.
Location & tenants
- Location reads: area grade D — affects rentability + tenant quality, not the cash-flow math above.
- Klamath County SD (rural): math 21% / reading 37% proficiency, ranked #46 of 58 in OR (top 79%) — low school quality limits family demand, transient renter base, plan for 1-2y turnover.
- Zoned schools: Gearhart Elementary School (32 students, 78% FRL); Gilchrist Junior/Senior High School (math 5% / reading 10%, grade F, #143 of 143 statewide, top 100%, 104 students, 74% FRL) — zoned schools average 76% FRL vs 59% district-wide (17 pts higher); higher-poverty schools than district average — tighter screening recommended.
- Zoned-school proficiency averages 8% at this address vs 29% district-wide (-22 pts) — the specific schools serving this property underperform the Klamath County SD average; the district grade overstates school quality for this exact location.
- Market conditions: 83 active listings in the ZIP; 232 units permitted in Klamath County in 2024 (72 in 5+ unit buildings).
Forward outlook
- In year one you build about $6k of equity ($1k loan paydown + $5k appreciation (3.0% local appreciation)).
- Klamath County population projected at -12% by 2050 — secular population decline; favor cash flow + early exit over multi-decade hold.
- At projected returns (3.0% appreciation + 3.0% rent growth), your $49k cash investment doubles in ~6 years — after that, you're playing with house money.
- By year 6, paydown + projected appreciation supports a ~$34k cash-out refi (75% LTV) — recoverable capital for the next deal without selling this one.
Negotiation context
- It's been on market 29 days — a 2% lower offer ($172k) is reasonable based on typical stale-listing flexibility.
- 3 sale attempts since 14y ago with the ask held roughly flat each time — persistent listings suggest the price (not the market) is what's stuck; bring a comps-based counter.
Risks & watch-outs
- Climate carrying-cost: moderate wildfire risk — expect insurance premiums to compound above CPI over the hold.
Questions for the listing agent
- Is there a deadline driving the sale (1031 exchange, divorce, estate, relocation)? That informs how much negotiation room exists.
- The area grade is low — what's the realistic commute time and amenity access for the typical tenant pool here? Any planned neighborhood developments (good or bad) we should know about?
- What's the average days-on-market for RENTAL listings here right now (not sales)? A rising rental-DOM trend means longer vacancies and softer asking-rent achievability than the comps imply.
- What's the recent tenant-quality profile in this submarket — average credit score on applications, eviction rate, late-payment / NSF rate, and stable-employment percentage? A property-management company in the area should have these aggregated.
- How much new for-sale + rental construction is in the pipeline within 1–3 miles? Heavy new supply typically softens prices + rents 12–24 months out; constrained supply supports both.
Investment metrics
- 1% rule
- 0.78% ✗
- Cap rate
- 6.41%
- Cash-on-cash
- 0.44%
- DSCR
- 1.02
- GRM
- 10.7
CMA / ARV
No comps found within radius.
Projected returns pro-forma
3.0% appreciation · 3.0% rent growth · sell at horizon
- IRR
- 7.9%
- Equity multiple
- 1.45×
- Total profit
- $22,140
- Equity at exit
- $78,688
- IRR
- 10.5%
- Equity multiple
- 2.57×
- Total profit
- $77,153
- Equity at exit
- $121,267
Cash invested: $49,000 (down + closing). Projections, not guarantees.
Landlord ↔ Tenant lean methodology
- Overall (STATE)
- 28 Tenant-Leaning
- State Oregon
- 28 Tenant-Leaning · D+6
- County
- — inherits STATE
- City
- — inherits STATE
ZIP-level market 97733
- Active inventory
- 83
- Price-to-rent
- 10.7×
Monthly cashflow live
- Estimated rent
- $1,358 medium interval (Pro) →
- Mortgage (P&I)
- −$918
- Tax from tax record
- −$64 /mo · $771/yr
- Insurance
- −$73
- HOA
- −$0
- Vacancy / Maint / Mgmt
- −$285
- Net cashflow
- $18
Break-even live
Sensitivity live
| Price | -10% $117 | -5% $67 | +0% $18 | +5% $-32 | +10% $-81 |
|---|---|---|---|---|---|
| Rent | -10% $-89 | -5% $-36 | +0% $18 | +5% $71 | +10% $125 |
| Rate | -1.0pp $106 | -0.5pp $62 | base $18 | +0.5pp $-28 | +1.0pp $-74 |
UW: 25.0% down · 7.5% · 30yr · 1.5% tax · 5.0% vac · 8.0% maint · 8.0% mgmt
Financing live
Cash to close
- Down payment
- $43,750
- Closing costs
- $5,250
- Reserves months
- —
- Total cash needed
- —
Loan-product check · same deal, 3 products live
Conventional
25% down · 7.5% · 30yr
- Down + closing
- —
- Monthly P&I
- —
- Monthly cashflow
- —
- DSCR
- —
- Eligible?
- —
Personal DTI + credit; lowest rate.
DSCR
20% down · 8.5% · 30yr
- Down + closing
- —
- Monthly P&I
- —
- Monthly cashflow
- —
- DSCR
- —
- Eligible?
- —
No personal income docs; deal must DSCR.
Hard money
10% down · 12.0% · 12mo
- Down + closing
- —
- Monthly P&I
- —
- Monthly cashflow
- —
- DSCR
- —
- Eligible?
- —
Short-term bridge; refi at stabilization.
Listing history 20 events
-
2026-06-19days on market $175,000 Active 29 DOM
-
2026-06-18days on market $175,000 Active 28 DOM
-
2026-06-17days on market $175,000 Active 27 DOM
-
2026-06-16days on market $175,000 Active 26 DOM
-
2026-06-15days on market $175,000 Active 25 DOM
-
2026-06-14days on market $175,000 Active 23 DOM
-
2026-06-12days on market $175,000 Active 22 DOM
-
2026-06-09days on market $175,000 Active 19 DOM
-
2026-06-08days on market $175,000 Active 18 DOM
-
2026-06-07days on market $175,000 Active 17 DOM
-
2026-06-05days on market $175,000 Active 14 DOM
-
2026-06-02days on market $175,000 Active 12 DOM
-
2026-06-01days on market $175,000 Active 11 DOM
-
2026-05-31days on market $175,000 Active 10 DOM
-
2026-05-30days on market $175,000 Active 9 DOM
-
2026-05-21$175,000 Active
-
2015-01-06historical
-
2013-06-11$105,000
-
2012-10-19historical
-
2012-02-24$124,900
ⓘ Source: listings_history table (triggers on properties + properties_extension) + one-shot
backfill from property_details.listing_events for pre-trigger history.
Tax reassessment forecast OR · Resets to sale price
- Current annual tax
- $771 · $64/mo
- Projected year-2 tax
- $1,698 · $141/mo
- Expected delta
- +$926/yr (+$77/mo · 120.1%)
ⓘ Screening estimate from a state-policy table — verify with the county assessor before closing.
Climate risk First Street
- Flood 1/10 Low FEMA zone X · 0% chance over 30 yrs
- Wildfire 5/10 Major
- Heat 1/10 Low 8 d/yr ≥84°F today · 18 d/yr by 30 yrs out
- Wind 1/10 Low
- Air quality 8/10 Severe 11 unhealthy d/yr today · 12 by 30 yrs out
Nearby sold comps map
Loading sold comps map…
Walkable amenities ~0.75 mi
Loading nearby amenities…
Taxation est. · year 1
- Rental income
- $16,294
- − Mortgage interest
- −$9,803
- − Property taxes
- −$771
- − Insurance
- −$875
- − Repairs & maintenance
- −$1,304
- − Management
- −$1,304
- − Depreciation
- −$5,091
- Taxable loss
- −$2,853
- Est. tax savings @ 24.0%
- +$685
- After-tax cash flow
- $898/yr
For passive investors: Depreciation is non-cash, so a rental often shows a tax loss while cash-flowing — sheltering income. Rental losses are passive: they offset passive income freely, and up to $25,000/yr can offset ordinary (W-2) income if you actively participate and your MAGI is under $100k (phasing out to $0 by $150k); unused losses carry forward. On sale, claimed depreciation is recaptured at up to 25%, and gains may owe capital-gains tax (a 1031 exchange can defer both). Figures are a year-1 estimate at your 24.0% rate — not tax advice; consult a CPA.
Schools (NCES district)
- District
- Klamath County SD
- NCES district ID
- 4107020
- Math proficiency
- 21% ▼ -17.00%
- Reading proficiency
- 37% ▼ -16.00%
- Median HH income
- $44,906
- Composite
- 24.83/100
- National rank
- #7593
- State rank
- #46 of 58 in OR
Livability — Crescent Lake
No livability data for this city. (Only ~50 U.S. cities are tracked.)
Census & demographics
- Census place
- Crescent Lake, OR
- Population (ZIP)
- 592
Population outlook (Klamath County) Hauer SSP2
- Today (2025)
- 63,870 people
- By 2030
- 62,279 · -2.5%
- By 2040
- 58,891 · -7.8%
- By 2050
- 56,207 · -12.0%
- By 2075
- 51,239 · -19.8%
- By 2100
- 46,526 · -27.2%
Race, ethnicity, and origin ACS 2023
- Neighborhood character
- Predominantly White (94%)
- Race & ethnicity
- White 94% Two or more races 5%
- Common ancestry
- Slovak 9% Hungarian 5% Iranian 5%
- Foreign-born
- 8% · Canada
Political lean MEDSL · Klamath
- 2024 margin
- Solid R (+41.9) · D 27.9% · R 69.8% · Other 2.4%
- 2008→2024 swing
- -8.8pp toward R · 2008: -33.1pp · 2024: -41.9pp
- All cycles
- 2024: R+41.9 2020: R+40.6 2016: R+44.8 2012: R+38.2 2008: R+33.1
Not yet ingested
- Civics
- —
Market trends
- HPI YoY
- —
- Current HPI
- —
- Rent YoY
- —
- Metro
- —
- State GDP YoY
- ▲ 2.05%
- F500 in state
- 2
Industry mix (Fortune 500 HQ in OR)
| Industry | F500 HQs | Revenue |
|---|---|---|
| Consumer Goods | 1 | $51B |
|
||
Price history
+40.1% since first listed5 events — show timeline
- 2026-05-21 Listed $175,000 MLSCO
- 2015-01-06 Listing Removed — MLSCO
- 2013-06-11 Listed $105,000 MLSCO
- 2012-10-19 Listing Removed — MLSCO
- 2012-02-24 Listed $124,900 MLSCO
Property tax history
+3.2%/yrLatest (2025): $771 · +2.7% YoY. Source: county tax records.
Cash-flow waterfall
monthlySold comps — $/sqft
last 12 mo · ≤1 miLoading sold comps…