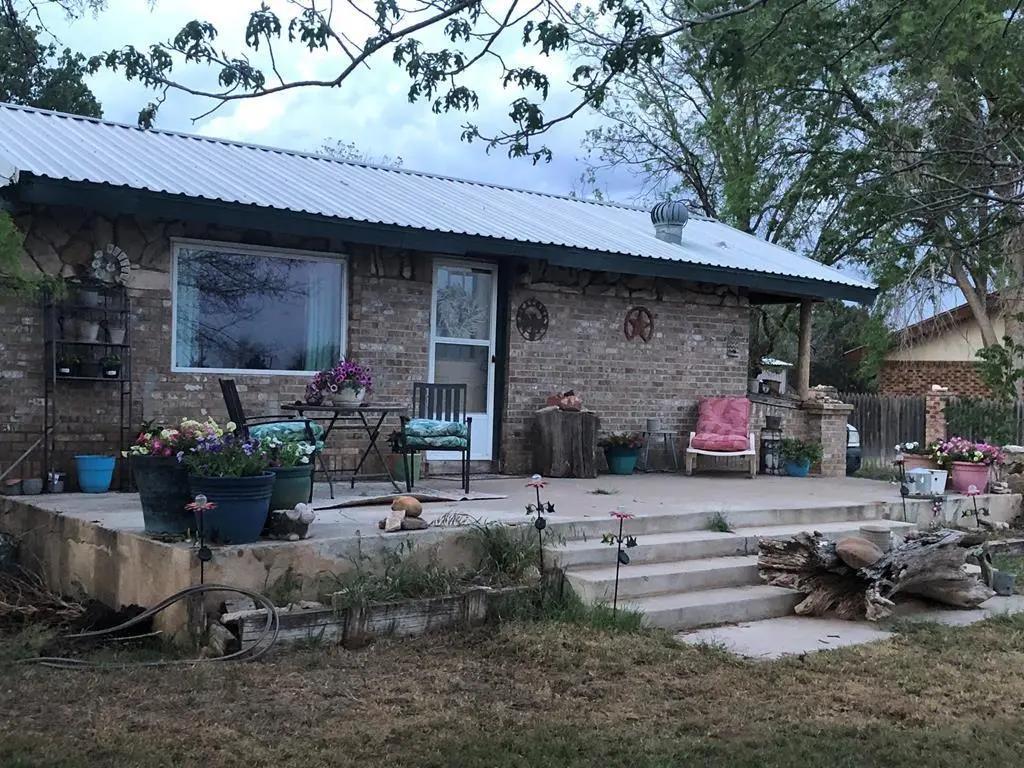
5807 Walter Rd · Big Spring, TX
Flood risk 1/10 · Minimal
- FEMA flood zone
- X (unshaded)
- Chance of flooding over 30 yrs
- 0.0%
- Est. flood insurance / yr
- $507 – $1,088
Fire risk 10/10 · Severe
- Est. fire insurance / yr
- $1,222 – $2,270
Heat risk 6/10 · Moderate
- Hot days now (above 102°F)
- 6 days/yr
- Hot days in 30 yrs
- 19 days/yr
Wind risk 2/10 · Minimal
- Chance of severe wind over 30 yrs
- 4.0%
Air-quality risk 1/10 · Minimal
- Unhealthy air days now
- 0 days/yr
- Unhealthy air days in 30 yrs
- 0 days/yr
Risk factors via First Street. Map © Google.
Why this score? — see what drove the C+ grade
The composite is a weighted blend of 9 inputs, each scored 0–100. Each bar is that input's sub-score; the figure is the points it added to the 100-point composite (weight × sub-score).
- Cash flow +28.4/30.0
- DSCR +10.0/10.0
- ARV discount +7.5/15.0
- 1% rule +7.1/10.0
- Livability +3.1/5.0
- Rent growth +2.5/5.0
- Schools +2.5/10.0
- Condition / age +2.5/5.0
- Appreciation +0.0/10.0
$163,000
🖨 Deal sheet (PDF) 📄 Offer letter ✓ Due diligence
Listing remarks
Motivated Seller!! Spacious 2-4BR (two of the bedrooms do not have a closet), 1-bath home situated on 1.57 unrestricted acres in Coahoma ISD. This property offers incredible potential for horse owners, RV parking, or additional outdoor living. Updates completed in 2021 per seller include HVAC, electrical, PEX plumbing, windows, patio doors, split unit, metal roof, subfloors, and laminate flooring for added peace of mind. Property features fenced pastures, up to 3 horses, a large storage building, a water well with a new pump installed in 4/2025, plus access to city water. Appraised 2025- $235K
Key facts
- Hvac
- Rv parking
- Pex plumbing
Tags
Property features AI
Exterior
- Security: Security system; Smoke detectors
- Utilities: Public and private well water available; Septic tank sewer
- Home design: Single Family Residence; One story
- Construction: Brick veneer construction; Metal roof; Slab foundation; Built on a 1.57-acre lot
- Exterior features: Covered patio/porch; Wood fencing; Shed(s); Workshop
Interior
- Kitchen: Gas Range; Refrigerator
- Flooring: Carpet; Vinyl
- Bathrooms: 1 full bathroom
- Heating & cooling: Central heating (natural gas); Central air; Ceiling fan(s)
- Interior features: Gas Range; Refrigerator; Gas Water Heater; Carpet flooring; Vinyl flooring
- Laundry & utility: Gas water heater
Neighborhood map
What this means for you Summary
Snapshot
- This is a 4-bed/1.0-bath single-family listed at $163k.
Deal economics
- At list price, monthly cash flow is $525 ($6k/yr) — positive.
- The deal already cash-flows at list — no discount required.
- Meets the 1% rule at list price ($2k rent vs $163k).
- Recommended offer: $161k (1.5% below list) — sets the bar for market timing.
Location & tenants
- Location reads 62/100 on livability (#948 in TX) — a middle-class / working-renter tenant base. Strengths: cost of living A+, housing A+, health & safety A+; Watch: employment C-, crime F, amenities F.
- Coahoma ISD (rural): math 25% / reading 32% proficiency, ranked #649 of 826 in TX (top 79%) — low school quality limits family demand, transient renter base, plan for 1-2y turnover.
- Zoned schools: Coahoma El (math 30% / reading 36%, grade F, #2,208 of 4,322 statewide, top 52%, 568 students, 43% FRL); Coahoma J H (math 25% / reading 28%, grade F, #1,200 of 1,662 statewide, top 73%, 256 students, 39% FRL); Coahoma H S (math 5% / reading 32%, grade F, #1,436 of 1,632 statewide, top 88%, 271 students, 33% FRL).
- Market conditions: 266 active listings in the ZIP; 69 units permitted in Howard County in 2024 (5 in 5+ unit buildings).
- This rent runs 34% of the median local income ($69k/yr) — at the standard rent-burdened threshold; future hikes will face affordability resistance.
Forward outlook
- Local home prices are declining (-3.0%/yr); year-one equity from $1k of loan paydown is wiped out by about $5k of value loss. Plan a longer hold.
- Howard County population projected at +42% by 2050 — long-run rental-demand tailwind backs the buy-and-hold thesis.
- At projected returns (-3.0% appreciation + 3.0% rent growth), your $46k cash investment doubles in ~9 years — after that, you're playing with house money.
Negotiation context
- It's been on market 26 days — a 2% lower offer ($161k) is reasonable based on typical stale-listing flexibility.
Risks & watch-outs
- Climate carrying-cost: severe wildfire risk; extreme-heat days projected 6→19/yr by 2055 (HVAC capex compounding) — expect insurance premiums to compound above CPI over the hold.
Questions for the listing agent
- Built in 1967 — when were the roof, HVAC, electrical panel, plumbing, and water heater last replaced?
- Is there a deadline driving the sale (1031 exchange, divorce, estate, relocation)? That informs how much negotiation room exists.
- Schools are F-rated, which usually means shorter tenancies and higher turnover. Who's the typical renter profile here, and what's been the actual vacancy rate?
- Crime grade is F in this area — have there been break-ins, vandalism, or insurance claims at this property in the last 3 years? What carrier currently insures it and at what premium?
- What's the average days-on-market for RENTAL listings here right now (not sales)? A rising rental-DOM trend means longer vacancies and softer asking-rent achievability than the comps imply.
- What's the recent tenant-quality profile in this submarket — average credit score on applications, eviction rate, late-payment / NSF rate, and stable-employment percentage? A property-management company in the area should have these aggregated.
- How much new for-sale + rental construction is in the pipeline within 1–3 miles? Heavy new supply typically softens prices + rents 12–24 months out; constrained supply supports both.
Investment metrics
- 1% rule
- 1.21% ✓
- Cap rate
- 10.16%
- Cash-on-cash
- 13.81%
- DSCR
- 1.61
- GRM
- 6.9
CMA / ARV
No comps found within radius.
Projected returns pro-forma
-3.0% appreciation · 3.0% rent growth · sell at horizon
- IRR
- 4.0%
- Equity multiple
- 1.15×
- Total profit
- $7,012
- Equity at exit
- $24,304
- IRR
- 13.5%
- Equity multiple
- 2.08×
- Total profit
- $49,072
- Equity at exit
- $14,093
Cash invested: $45,640 (down + closing). Projections, not guarantees.
Landlord ↔ Tenant lean methodology
- Overall (STATE)
- 87 Strongly Landlord-Friendly
- State Texas
- 87 Strongly Landlord-Friendly · R+5
- County
- — inherits STATE
- City
- — inherits STATE
ZIP-level market 79720
- Active inventory
- 266
- Price-to-rent
- 6.9×
Monthly cashflow live
- Estimated rent
- $1,974 medium interval (Pro) →
- Mortgage (P&I)
- −$855
- Tax from tax record
- −$112 /mo · $1,342/yr
- Insurance
- −$68
- HOA
- −$0
- Vacancy / Maint / Mgmt
- −$415
- Net cashflow
- $525
Break-even live
Sensitivity live
| Price | -10% $617 | -5% $571 | +0% $525 | +5% $479 | +10% $433 |
|---|---|---|---|---|---|
| Rent | -10% $369 | -5% $447 | +0% $525 | +5% $603 | +10% $681 |
| Rate | -1.0pp $607 | -0.5pp $567 | base $525 | +0.5pp $483 | +1.0pp $440 |
UW: 25.0% down · 7.5% · 30yr · 1.5% tax · 5.0% vac · 8.0% maint · 8.0% mgmt
Financing live
Cash to close
- Down payment
- $40,750
- Closing costs
- $4,890
- Reserves months
- —
- Total cash needed
- —
Loan-product check · same deal, 3 products live
Conventional
25% down · 7.5% · 30yr
- Down + closing
- —
- Monthly P&I
- —
- Monthly cashflow
- —
- DSCR
- —
- Eligible?
- —
Personal DTI + credit; lowest rate.
DSCR
20% down · 8.5% · 30yr
- Down + closing
- —
- Monthly P&I
- —
- Monthly cashflow
- —
- DSCR
- —
- Eligible?
- —
No personal income docs; deal must DSCR.
Hard money
10% down · 12.0% · 12mo
- Down + closing
- —
- Monthly P&I
- —
- Monthly cashflow
- —
- DSCR
- —
- Eligible?
- —
Short-term bridge; refi at stabilization.
Listing history 26 events
-
2026-06-19days on market $163,000 Active 26 DOM
-
2026-06-18days on market $163,000 Active 25 DOM
-
2026-06-17days on market $163,000 Active 24 DOM
-
2026-06-17price $163,000 Active 23 DOM
-
2026-06-16days on market $168,000 Active 23 DOM
-
2026-06-16remarks 600-char remark
-
2026-06-15days on market $168,000 Active 22 DOM
-
2026-06-14days on market $168,000 Active 20 DOM
-
2026-06-12days on market $168,000 Active 19 DOM
-
2026-06-09days on market $168,000 Active 16 DOM
-
2026-06-08days on market $168,000 Active 15 DOM
-
2026-06-07days on market $168,000 Active 14 DOM
-
2026-06-05days on market $168,000 Active 11 DOM
-
2026-06-03days on market $168,000 Active 10 DOM
-
2026-06-02days on market $168,000 Active 9 DOM
-
2026-06-01days on market $168,000 Active 8 DOM
-
2026-05-31days on market $168,000 Active 7 DOM
-
2026-05-30days on market $168,000 Active 6 DOM
-
2026-05-24$168,000 Active
-
2026-03-22price $199,999
-
2026-02-18price $205,000
-
2026-01-14price $210,000
-
2025-09-18price $215,000
-
2025-05-22price $220,000
-
2023-01-18soldstatus
-
2021-08-27soldstatus
ⓘ Source: listings_history table (triggers on properties + properties_extension) + one-shot
backfill from property_details.listing_events for pre-trigger history.
Tax reassessment forecast TX · Resets to sale price
- Current annual tax
- $1,342 · $112/mo
- Projected year-2 tax
- $2,983 · $249/mo
- Expected delta
- +$1,641/yr (+$137/mo · 122.3%)
ⓘ Screening estimate from a state-policy table — verify with the county assessor before closing.
Climate risk First Street
- Flood 1/10 Low FEMA zone X (unshaded) · 0% chance over 30 yrs
- Wildfire 10/10 Extreme
- Heat 6/10 Major 6 d/yr ≥102°F today · 19 d/yr by 30 yrs out
- Wind 2/10 Low 4% chance of damaging wind over 30 yrs
- Air quality 1/10 Low 0 unhealthy d/yr today · 0 by 30 yrs out
Nearby sold comps map
Loading sold comps map…
Walkable amenities ~0.75 mi
Loading nearby amenities…
Taxation est. · year 1
- Rental income
- $23,693
- − Mortgage interest
- −$9,131
- − Property taxes
- −$1,342
- − Insurance
- −$815
- − Repairs & maintenance
- −$1,895
- − Management
- −$1,895
- − Depreciation
- −$4,742
- Taxable income
- $3,872
- Est. tax owed @ 24.0%
- −$929
- After-tax cash flow
- $5,373/yr
For passive investors: Depreciation is non-cash, so a rental often shows a tax loss while cash-flowing — sheltering income. Rental losses are passive: they offset passive income freely, and up to $25,000/yr can offset ordinary (W-2) income if you actively participate and your MAGI is under $100k (phasing out to $0 by $150k); unused losses carry forward. On sale, claimed depreciation is recaptured at up to 25%, and gains may owe capital-gains tax (a 1031 exchange can defer both). Figures are a year-1 estimate at your 24.0% rate — not tax advice; consult a CPA.
Schools (NCES district)
- District
- Coahoma ISD
- NCES district ID
- 4814490
- Math proficiency
- 25% ▼ -11.00%
- Reading proficiency
- 32% ▼ -7.00%
- Median HH income
- $49,651
- Composite
- 24.9/100
- National rank
- #7579
- State rank
- #649 of 826 in TX
Livability — Big Spring
- Score
- 62/100
- State rank
- #948
- US rank
- #16886
Category grades
Schools grade is shown separately in the Schools card above.
Census & demographics
- County
- Howard County · 29,936 people
- City population
- 29,936
- Metro
- Big Spring, TX
- Population (ZIP)
- 29,936
- Household income
- $68,785
- Rent vs Own
- Severe rent burden
- 638.0
Population outlook (Howard County) Hauer SSP2
- Today (2025)
- 43,396 people
- By 2030
- 46,792 · +7.8%
- By 2040
- 54,096 · +24.7%
- By 2050
- 61,707 · +42.2%
- By 2075
- 79,809 · +83.9%
- By 2100
- 87,385 · +101.4%
Race, ethnicity, and origin ACS 2023
- Neighborhood character
- Diverse neighborhood (Simpson 0.59)
- Race & ethnicity
- Hispanic / Latino 45% White 45% Two or more races 17% Black 5% Asian 1%
- Hispanic origin (detail)
- Mexican 37%
- Common ancestry
- Slovak 1% Italian 1% Lithuanian 1%
- Foreign-born
- 10% · Canada
- Languages at home
- 71% English-only · Spanish 28%
Political lean MEDSL · Howard
- 2024 margin
- Solid R (+62.8) · D 18.2% · R 81.1%
- 2008→2024 swing
- -16.6pp toward R · 2008: -46.3pp · 2024: -62.8pp
- All cycles
- 2024: R+62.8 2020: R+58.4 2016: R+56.0 2012: R+58.2 2008: R+46.3
Not yet ingested
- Civics
- —
Market trends
- HPI YoY
- ▼ -207.13%
- Current HPI
- 140.8159
- Rent YoY
- —
- Metro
- Big Spring, TX
- State GDP YoY
- ▲ 3.95%
- F500 in state
- 110
Industry mix (Fortune 500 HQ in TX)
| Industry | F500 HQs | Revenue |
|---|---|---|
| Energy | 16 | $1,198B |
|
||
| Technology | 5 | $198B |
|
||
| Engineering / Construction | 4 | $72B |
|
||
| Energy Services | 3 | $60B |
|
||
| Utilities | 3 | $41B |
|
||
| Healthcare | 2 | $330B |
|
||
Price history
-23.6% since first listed8 events — show timeline
- 2026-05-24 Listed $168,000 PBBOR
- 2026-03-22 Price Changed $199,999 PBBOR
- 2026-02-18 Price Changed $205,000 PBBOR
- 2026-01-14 Price Changed $210,000 PBBOR
- 2025-09-18 Price Changed $215,000 PBBOR
- 2025-05-22 Price Changed $220,000 PBBOR
- 2023-01-18 Sold (Public Records) — Public Records
- 2021-08-27 Sold (Public Records) — Public Records
Property tax history
-0.0%/yrLatest (2025): $1,342 · +21.7% YoY. Source: county tax records.
Cash-flow waterfall
monthlySold comps — $/sqft
last 12 mo · ≤1 miLoading sold comps…