 🏗️ New Construction
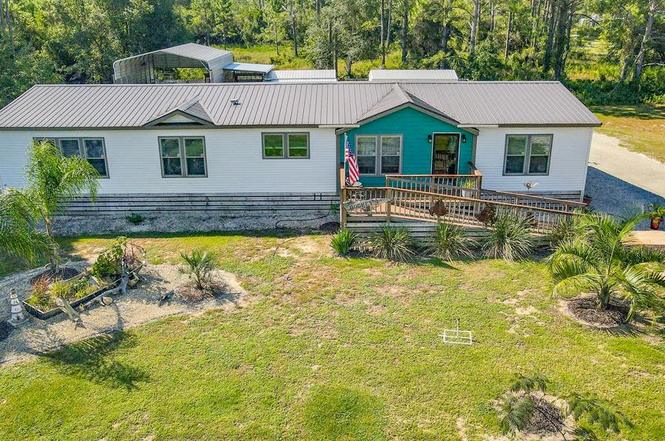
511 NE Ave H · Carrabelle, FL
Flood risk 5/10 · Moderate
- FEMA flood zone
- A
- Chance of flooding over 30 yrs
- 0.26%
- Est. flood insurance / yr
- $1,009 – $1,996
Fire risk 6/10 · Moderate
- Est. fire insurance / yr
- $947 – $1,759
Heat risk 10/10 · Severe
- Hot days now (above 108°F)
- 7 days/yr
- Hot days in 30 yrs
- 21 days/yr
Wind risk 10/10 · Severe
- Chance of severe wind over 30 yrs
- 99.0%
Air-quality risk 1/10 · Minimal
- Unhealthy air days now
- 0 days/yr
- Unhealthy air days in 30 yrs
- 0 days/yr
Risk factors via First Street. Map © Google.
Why this score? — see what drove the C- grade
The composite is a weighted blend of 9 inputs, each scored 0–100. Each bar is that input's sub-score; the figure is the points it added to the 100-point composite (weight × sub-score).
- Cash flow +22.6/30.0
- ARV discount +7.5/15.0
- DSCR +7.2/10.0
- 1% rule +4.8/10.0
- Livability +3.5/5.0
- Schools +3.0/10.0
- Rent growth +2.5/5.0
- Condition / age +2.5/5.0
- Appreciation +0.0/10.0
$405,000
🖨 Deal sheet 📄 Offer letter ✓ Due diligence
Listing remarks
REDUCED!!!!! IMMACULATE CUSTOM 2021 MANUFACTURED HOME! BUILT BY STONEY POINTE BY WINSTON HOMES. Franklin County Tax Appraiser CAMA code upgraded to code#000821 -"MANUFACTURED HIGH". Wind zone 3 rating. Too many custom upgrades to list. The seller will supply the list. Zone 3 construction includes a stronger chassis and anchoring systems to secure the home to its foundation. Reinforced roofing and side materials to withstand strong wind pressures. Impact-resistant DP-50 windows and storm doors. X FLOOD ZONE, so no flood insurance required! Survey and Elevation Certificate available! Electric fireplace in the main den, also a portable electric fireplace. ADA friendly throughout.
Key facts
- Screened back porch
- Full bathroom
- Outdoor cookshed
Tags
Property features AI
Finance
- Other: Workshop, outdoor kitchen, and additional storage structures on property; Zoned R-2 (mobile home / residential single family)
Exterior
- Parking: 6 parking spaces; Boat parking; Carport; Circular driveway; Covered parking; RV access/parking
- Security: Security system; Smoke detectors
- Utilities: Public water and well available; Public sewer; Sewer connected; Electricity available and connected; Underground utilities; Cable available and connected; Phone available; Water connected
- Home design: Manufactured home (mobile/manufactured); Residential property; New construction
- Construction: Vinyl siding; Metal roof
- Exterior features: Deck; Patio; Covered and screened porch; Rear porch; Front porch; Enclosed porch; Partial backyard fencing; Landscaped, level lot; City street frontage
Interior
- Kitchen: Dishwasher; Freezer; Microwave
- Bedrooms: Walk-in closet(s) included
- Flooring: Vinyl flooring
- Bathrooms: 3 full bathrooms
- Heating & cooling: Central heating; Electric heating; Heat pump; Central air conditioning; Ceiling fans
- Interior features: Kitchen island; Walk-in closets; Built-in bookcases; Crown molding; Interior storage; Recessed lighting; Storm windows; Window coverings
Neighborhood map
What this means for you Summary
Snapshot
- This is a 4-bed/3.0-bath manufactured listed at $405k.
Deal economics
- At list price, monthly cash flow is $563 ($7k/yr) — positive.
- The deal already cash-flows at list — no discount required.
- To meet the 1% rule (rent ≥ 1% of price), the offer needs to be $396k (2.1% below list).
- Recommended offer: $356k (12.0% below list) — sets the bar for market timing.
- Cap rate 8.3% vs local median 1.9% in Carrabelle — top-decile yield for the area; either an underpriced asset or a hidden risk that comps aren't pricing in. Stress-test before assuming the spread holds.
Location & tenants
- Location reads 69/100 on livability (#466 in FL) — a middle-class / working-renter tenant base. Strengths: cost of living A+, housing A+, health & safety A+; Watch: employment D, schools F, amenities F.
- Franklin (rural): math 33% / reading 38% proficiency, ranked #67 of 73 in FL (top 92%) — families likely to look elsewhere, expect single-tenant / working-renter base with shorter leases; 84% free/reduced lunch — lower-income household profile, screen leases tightly.
- Market conditions: 320 active listings in the ZIP; 1 comparable units currently listed for rent nearby; 113 units permitted in Franklin County in 2024 (0 in 5+ unit buildings).
Forward outlook
- Local home prices are declining (-3.0%/yr); year-one equity from $3k of loan paydown is wiped out by about $12k of value loss. Plan a longer hold.
- Franklin County population projected to shrink 5% by 2050 — rents likely to lag national; underwrite the cash flow, not the appreciation.
Negotiation context
- It's been on market 279 days — a 12% lower offer ($356k) is reasonable based on typical stale-listing flexibility.
- 2 sale attempts with the ask held roughly flat each time — persistent listings suggest the price (not the market) is what's stuck; bring a comps-based counter.
Risks & watch-outs
- Watch-outs: flood insurance adds $125/mo.
- Climate carrying-cost: in FEMA flood zone A (mandatory federal flood insurance); severe wind risk, 99% chance of damaging wind over 30y; major wildfire risk; extreme-heat days projected 7→21/yr by 2055 (HVAC capex compounding) — expect insurance premiums to compound above CPI over the hold.
Questions for the listing agent
- It's been on market 279 days. Have you received any prior offers? Is the seller open to a 12% concession, seller financing, or rate buy-down credit?
- What's the actual annual flood-insurance premium (NFIP or private), and is the property in a SFHA with mandatory coverage?
- Why hasn't it sold? Are there any deal-killer items the seller is aware of (foundation, flood, title, zoning, code violations)?
- Is there a deadline driving the sale (1031 exchange, divorce, estate, relocation)? That informs how much negotiation room exists.
- Schools are F-rated, which usually means shorter tenancies and higher turnover. Who's the typical renter profile here, and what's been the actual vacancy rate?
- What's the average days-on-market for RENTAL listings here right now (not sales)? A rising rental-DOM trend means longer vacancies and softer asking-rent achievability than the comps imply.
- What's the recent tenant-quality profile in this submarket — average credit score on applications, eviction rate, late-payment / NSF rate, and stable-employment percentage? A property-management company in the area should have these aggregated.
- How much new for-sale + rental construction is in the pipeline within 1–3 miles? Heavy new supply typically softens prices + rents 12–24 months out; constrained supply supports both.
Investment metrics
- 1% rule
- 0.98% ✗
- Cap rate
- 8.33%
- Cash-on-cash
- 7.29%
- DSCR
- 1.32
- GRM
- 8.5
CMA / ARV
No comps found within radius.
Projected returns pro-forma
-3.0% appreciation · 3.0% rent growth · sell at horizon
- IRR
- -7.1%
- Equity multiple
- 0.74×
- Total profit
- $-29,823
- Equity at exit
- $60,387
- IRR
- 2.5%
- Equity multiple
- 1.18×
- Total profit
- $19,906
- Equity at exit
- $35,017
Cash invested: $113,400 (down + closing). Projections, not guarantees.
Landlord ↔ Tenant lean methodology
- Overall (STATE)
- 87 Strongly Landlord-Friendly
- State Florida
- 87 Strongly Landlord-Friendly · R+3
- County
- — inherits STATE
- City
- — inherits STATE
ZIP-level market 32322
- Home prices YoY
- -8.8%
- Active inventory
- 320
- Price-to-rent
- 8.5×
Monthly cashflow live
- Estimated rent
- $3,964 medium interval (Pro) →
- Mortgage (P&I)
- −$2,124
- Tax from tax record
- −$150 /mo · $1,804/yr
- Insurance
- −$169
- Flood insurance flood zone
- −$125 /mo · $1,502/yr
- HOA
- −$0
- Vacancy / Maint / Mgmt
- −$832
- Net cashflow
- $563
Break-even live
UW: 25.0% down · 7.5% · 30yr · 1.5% tax · 5.0% vac · 8.0% maint · 8.0% mgmt
Financing live
Cash to close
- Down payment
- $101,250
- Closing costs
- $12,150
- Reserves months
- —
- Total cash needed
- —
Loan-product check · same deal, 3 products live
Conventional
25% down · 7.5% · 30yr
- Down + closing
- —
- Monthly P&I
- —
- Monthly cashflow
- —
- DSCR
- —
- Eligible?
- —
Personal DTI + credit; lowest rate.
DSCR
20% down · 8.5% · 30yr
- Down + closing
- —
- Monthly P&I
- —
- Monthly cashflow
- —
- DSCR
- —
- Eligible?
- —
No personal income docs; deal must DSCR.
Hard money
10% down · 12.0% · 12mo
- Down + closing
- —
- Monthly P&I
- —
- Monthly cashflow
- —
- DSCR
- —
- Eligible?
- —
Short-term bridge; refi at stabilization.
Rent comps 1 comps
| Address | Beds | Baths | Sqft | Rent | $/sqft | DOM | Units | Dist |
|---|---|---|---|---|---|---|---|---|
| 105 Anglers Harbor Ln Unit 1545694P Carrabelle, FL | 3.0 | 3.0 | 2195 | $3,964 | $1.81 | 13d | 1 | 1.40mi |
Listing history 21 events
-
2026-06-19days on market $405,000 Active 279 DOM
-
2026-06-18days on market $405,000 Active 278 DOM
-
2026-06-17days on market $405,000 Active 277 DOM
-
2026-06-16days on market $405,000 Active 276 DOM
-
2026-06-15days on market $405,000 Active 275 DOM
-
2026-06-14days on market $405,000 Active 273 DOM
-
2026-06-13days on market $405,000 Active 272 DOM
-
2026-06-10days on market $405,000 Active 270 DOM
-
2026-06-09days on market $405,000 Active 269 DOM
-
2026-06-08days on market $405,000 Active 268 DOM
-
2026-06-07days on market $405,000 Active 267 DOM
-
2026-06-05days on market $405,000 Active 264 DOM
-
2026-06-03days on market $405,000 Active 263 DOM
-
2026-06-02days on market $405,000 Active 262 DOM
-
2026-06-01days on market $405,000 Active 261 DOM
-
2026-05-31days on market $405,000 Active 260 DOM
-
2026-05-30days on market $405,000 Active 259 DOM
-
2026-04-22price $405,000
-
2025-09-12$410,000 Active
-
2025-09-11historical
-
2025-08-24$439,000 Active
ⓘ Source: listings_history table (triggers on properties + properties_extension) + one-shot
backfill from property_details.listing_events for pre-trigger history.
Tax reassessment forecast FL · Resets to sale price
- Current annual tax
- $1,804 · $150/mo
- Projected year-2 tax
- $3,362 · $280/mo
- Expected delta
- +$1,558/yr (+$130/mo · 86.4%)
ⓘ Screening estimate from a state-policy table — verify with the county assessor before closing.
Climate risk First Street
- Flood 5/10 Major FEMA zone A · 26% chance over 30 yrs
- Wildfire 6/10 Major
- Heat 10/10 Extreme 7 d/yr ≥108°F today · 21 d/yr by 30 yrs out
- Wind 10/10 Extreme 99% chance of damaging wind over 30 yrs
- Air quality 1/10 Low 0 unhealthy d/yr today · 0 by 30 yrs out
Nearby sold comps map
Loading sold comps map…
Walkable amenities ~0.75 mi
Loading nearby amenities…
Taxation est. · year 1
- Rental income
- $47,568
- − Mortgage interest
- −$22,686
- − Property taxes
- −$1,804
- − Insurance
- −$3,528
- − Repairs & maintenance
- −$3,805
- − Management
- −$3,805
- − Depreciation
- −$11,782
- Taxable income
- $158
- Est. tax owed @ 24.0%
- −$38
- After-tax cash flow
- $6,723/yr
For passive investors: Depreciation is non-cash, so a rental often shows a tax loss while cash-flowing — sheltering income. Rental losses are passive: they offset passive income freely, and up to $25,000/yr can offset ordinary (W-2) income if you actively participate and your MAGI is under $100k (phasing out to $0 by $150k); unused losses carry forward. On sale, claimed depreciation is recaptured at up to 25%, and gains may owe capital-gains tax (a 1031 exchange can defer both). Figures are a year-1 estimate at your 24.0% rate — not tax advice; consult a CPA.
Schools (NCES district)
- District
- Franklin
- NCES district ID
- 1200570
- Math proficiency
- 33% ▼ -9.00%
- Reading proficiency
- 38% ▼ -4.00%
- Median HH income
- $39,084
- Composite
- 29.7/100
- National rank
- #6454
- State rank
- #67 of 73 in FL
Livability — Carrabelle
- Score
- 69/100
- State rank
- #466
- US rank
- #8398
Category grades
Schools grade is shown separately in the Schools card above.
Census & demographics
- Census place
- Carrabelle, FL
- Population (ZIP)
- 4,348
Population outlook (Franklin County) Hauer SSP2
- Today (2025)
- 11,827 people
- By 2030
- 11,839 · +0.1%
- By 2040
- 11,707 · -1.0%
- By 2050
- 11,218 · -5.1%
- By 2075
- 9,849 · -16.7%
- By 2100
- 7,286 · -38.4%
Race, ethnicity, and origin ACS 2023
- Neighborhood character
- Predominantly White (70%)
- Race & ethnicity
- White 70% Black 15% Two or more races 10% Hispanic / Latino 9%
- Hispanic origin (detail)
- Mexican 2% Puerto Rican 4% Cuban 1%
- Common ancestry
- Slovak 2% Italian 2% Lithuanian 1%
- Foreign-born
- 6% · Canada
- Languages at home
- 89% English-only · Spanish 7% French/Haitian/Cajun 1%
Political lean MEDSL · Franklin
- 2024 margin
- Solid R (+43.8) · D 27.7% · R 71.5%
- 2008→2024 swing
- -15.9pp toward R · 2008: -27.9pp · 2024: -43.8pp
- All cycles
- 2024: R+43.8 2020: R+37.3 2016: R+39.7 2012: R+31.5 2008: R+27.9
Not yet ingested
- Civics
- —
Market trends
- HPI YoY
- ▼ -17.76%
- Current HPI
- 185.16
- Rent YoY
- —
- Metro
- —
- State GDP YoY
- ▲ 3.28%
- F500 in state
- 36
Industry mix (Fortune 500 HQ in FL)
| Industry | F500 HQs | Revenue |
|---|---|---|
| Industrial Technology | 2 | $29B |
|
||
| Insurance | 2 | $17B |
|
||
| Retail | 1 | $60B |
|
||
| Technology Distribution | 1 | $58B |
|
||
| Homebuilding | 1 | $35B |
|
||
| Technology Manufacturing | 1 | $35B |
|
||
Price history
-7.7% since first listed4 events — show timeline
- 2026-04-22 Price Changed $405,000 RAFGC
- 2025-09-12 Listed $410,000 RAFGC
- 2025-09-11 Listing Removed — CPARMLS
- 2025-08-24 Listed $439,000 CPARMLS
Property tax history
+58.3%/yrLatest (2024): $1,804 · +1.9% YoY. Source: county tax records.
Cash-flow waterfall
monthlySold comps — $/sqft
last 12 mo · ≤1 miLoading sold comps…