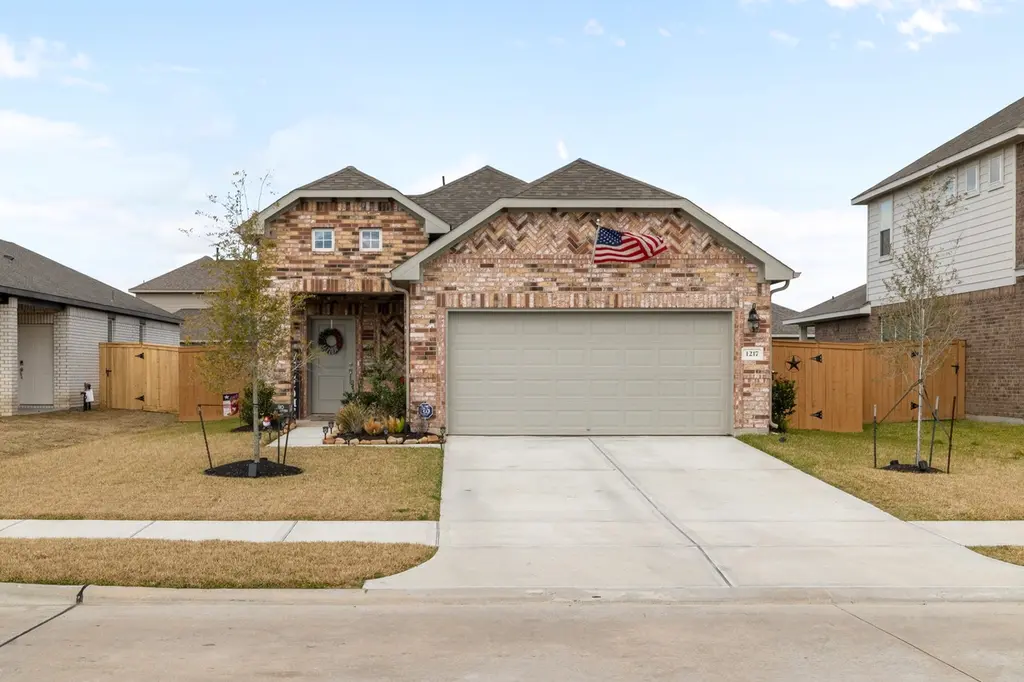
1217 Red Hills Dr · Iowa Colony, TX
Flood risk 3/10 · Minor
- FEMA flood zone
- X (unshaded)
- Chance of flooding over 30 yrs
- 0.2%
- Est. flood insurance / yr
- $507 – $1,088
Fire risk 6/10 · Moderate
- Est. fire insurance / yr
- $1,222 – $2,270
Heat risk 9/10 · Severe
- Hot days now (above 110°F)
- 7 days/yr
- Hot days in 30 yrs
- 23 days/yr
Wind risk 9/10 · Severe
- Chance of severe wind over 30 yrs
- 99.0%
Air-quality risk 2/10 · Minimal
- Unhealthy air days now
- 1 days/yr
- Unhealthy air days in 30 yrs
- 2 days/yr
Risk factors via First Street. Map © Google.
Why this score? — see what drove the D grade
The composite is a weighted blend of 9 inputs, each scored 0–100. Each bar is that input's sub-score; the figure is the points it added to the 100-point composite (weight × sub-score).
- ARV discount +10.6/15.0
- Cash flow +8.7/30.0
- 1% rule +5.0/10.0
- Condition / age +4.0/5.0
- Schools +3.9/10.0
- Livability +3.2/5.0
- Rent growth +2.6/5.0
- DSCR +2.4/10.0
- Appreciation +0.0/10.0
$274,900
🖨 Deal sheet 📄 Offer letter ✓ Due diligence
Listing remarks MLS
Welcome to your dream home at the heart of Darlington! Step into luxury with our spacious and meticulously designed 3-bedroom, 2-bath haven. This single-story abode boasts a generous 1,464 square feet of living space, ideal for families and those seeking tranquility in style. Park effortlessly with a 2-car garage, ensuring convenience for all. Entertain or unwind in the expansive great room, offering versatility and comfort for any occasion. Embrace the serene outdoors on your covered patio, measuring 11 x 7, perfect for al fresco dining or peaceful moments. The optional utility room adds practicality, catering to your individual lifestyle needs. Experience the epitome of modern living with this exquisite Darlington floor plan, where luxury meets functionality seamlessly. Your oasis awaits!
Key facts
- 6,250 sq ft lot
- 2 garage spots
- Community pool
Property features AI
Finance
- HOA & community: Principal Management Group association; Annual association fee: $1,180 (covers recreation facilities); Community pool; Clubhouse; Fitness center; Playground; Basketball court; Tennis courts; Pickleball; Sport court; Curbs
Exterior
- Parking: Attached garage (2 spaces); Driveway; Garage door opener
- Security: Smoke detector(s)
- Utilities: Public water; Public sewer; Generator (electric)
- Home design: Residential property; Faces south
- Construction: Built in 2024; Brick and wood siding; Composition roof; Slab foundation
- Exterior features: Covered patio; Patio; Deck; Fence (back yard); Subdivision lot
Interior
- Kitchen: Dishwasher; Disposal; Gas oven; Gas range; Microwave
- Bedrooms: 5 rooms total
- Flooring: Carpet; Tile
- Bathrooms: 2 full bathrooms
- Heating & cooling: Central heating (gas); Central air (electric)
- Interior features: Breakfast bar; Double vanity; Granite counters; Kitchen island; Kitchen/family room combo; Pantry; Separate shower; Tub/shower combination; Ceiling fan(s); Living/dining room
- Laundry & utility: Washer hookup; Electric dryer hookup; Gas dryer hookup; Tankless water heater
Neighborhood map
What this means for you Summary
Snapshot
- This is a 3-bed/2.0-bath single-family listed at $275k. Condition is rated good.
Deal economics
- At list price, monthly cash flow is $-232 ($-3k/yr) — negative.
- To cash-flow at today's rent, offer at most $234k (14.9% below list).
- Meets the 1% rule at list price ($3k rent vs $275k).
- Recommended offer: $234k (14.9% below list) — sets the bar for cash-flow.
- Cap rate 5.3% vs local median 4.2% in Iowa Colony — meaningfully above typical; check what's discounted (condition, days-on-market, listing class) to confirm the premium yield is real.
Location & tenants
- Location reads 64/100 on livability (#757 in TX) — a middle-class / working-renter tenant base. Strengths: crime A+, employment A+, cost of living A+; Watch: amenities F, commute F, health & safety F.
- Alvin ISD (suburban): math 39% / reading 48% proficiency, ranked #255 of 826 in TX (top 31%) — families likely to look elsewhere, expect single-tenant / working-renter base with shorter leases.
- Zoned schools: Iowa Colony H S (792 students, 56% FRL).
- Market conditions: Rents flat; 1139 active listings in the ZIP; 13 comparable units currently listed for rent nearby; rentals leasing fast (median 13d on market — plan ~1-2 weeks tenant-placement turnaround); high-income renter base; 3,960 units permitted in Brazoria County in 2024 (593 in 5+ unit buildings).
Forward outlook
- Local home prices are declining (-3.0%/yr); year-one equity from $2k of loan paydown is wiped out by about $8k of value loss. Plan a longer hold.
- Brazoria County population projected at +44% by 2050 — long-run rental-demand tailwind backs the buy-and-hold thesis.
Negotiation context
- It's been on market 49 days — a 3% lower offer ($267k) is reasonable based on typical stale-listing flexibility.
- 3 sale attempts since 2y ago with the ask held roughly flat each time — persistent listings suggest the price (not the market) is what's stuck; bring a comps-based counter.
Risks & watch-outs
- Watch-outs: property tax is 3.3% of price.
- Climate carrying-cost: severe wind risk, 99% chance of damaging wind over 30y; major wildfire risk; extreme-heat days projected 7→23/yr by 2055 (HVAC capex compounding) — expect insurance premiums to compound above CPI over the hold.
Questions for the listing agent
- What do current leases actually rent for vs. the listed asking? Can we see a recent rent roll and the last 12 months of T-12 income?
- It's been on market 49 days. Have you received any prior offers? Is the seller open to a 15% concession, seller financing, or rate buy-down credit?
- Property tax is high relative to price — has the assessment been appealed recently, and will the sale trigger a re-assessment?
- What does the HOA fee cover, when was the last increase, and are there any pending special assessments or reserve-fund shortfalls?
- Is there a deadline driving the sale (1031 exchange, divorce, estate, relocation)? That informs how much negotiation room exists.
- Schools are F-rated, which usually means shorter tenancies and higher turnover. Who's the typical renter profile here, and what's been the actual vacancy rate?
- The area grade is low — what's the realistic commute time and amenity access for the typical tenant pool here? Any planned neighborhood developments (good or bad) we should know about?
- What's the average days-on-market for RENTAL listings here right now (not sales)? A rising rental-DOM trend means longer vacancies and softer asking-rent achievability than the comps imply.
- What's the recent tenant-quality profile in this submarket — average credit score on applications, eviction rate, late-payment / NSF rate, and stable-employment percentage? A property-management company in the area should have these aggregated.
- How much new for-sale + rental construction is in the pipeline within 1–3 miles? Heavy new supply typically softens prices + rents 12–24 months out; constrained supply supports both.
Investment metrics
- 1% rule
- 1.00% ✓
- Cap rate
- 5.28%
- Cash-on-cash
- -3.62%
- DSCR
- 0.84
- GRM
- 8.3
CMA / ARV
- ARV (median comp)
- $295,254
- List price
- $274,900
- Delta
- -6.89%
- Verdict
- FAIR
- Comps
- 20 within 1.0 mi
Show comp detail 12 sales within ~0.75 mi
| Address | Dist | Beds/Ba | Sqft | Sold | Price | $/sf | Match |
|---|---|---|---|---|---|---|---|
| 1213 Red Hills Dr | 0.01mi | 4/2.0 (+1) | 1,582 (+7%) | 3mo | $299,900 | $190 | 80 |
| 10510 Watershed Dr | 0.29mi | 3/2.0 | 1,641 (+11%) | 1mo | $258,000 | $157 | 68 |
| 10321 Mount Winchell Dr | 0.34mi | 3/2.0 | 1,581 (+7%) | 8mo | $270,000 | $171 | 66 |
| 1202 Paradise Found Dr | 0.53mi | 3/2.0 | 1,581 (+7%) | 1mo | $265,000 | $168 | 63 |
| 10410 Russell Pines Dr | 0.35mi | 3/2.0 | 1,631 (+10%) | 4mo | $254,000 | $156 | 63 |
| 1306 Paradise Found Dr | 0.55mi | 3/2.0 | 1,393 (-6%) | 2mo | $239,000 | $172 | 63 |
| 10413 Junction Peak Dr | 0.09mi | 3/2.5 | 1,690 (+14%) | 9mo | $289,900 | $172 | 62 |
| 1313 Scarlet Mountain Dr | 0.20mi | 3/2.5 | 1,690 (+14%) | 12mo | $299,999 | $178 | 55 |
| 9910 Blue Sapphire Ln | 0.72mi | 3/2.0 | 1,581 (+7%) | 6mo | $235,000 | $149 | 50 |
| 1638 Pink Stone Dr | 0.75mi | 3/2.0 | 1,393 (-6%) | 10mo | $225,000 | $162 | 47 |
| 1814 Homewood Point Ln | 0.71mi | 3/2.0 | 1,635 (+10%) | 3mo | $319,990 | $196 | 47 |
| 9610 Garnet Grove Dr | 0.72mi | 3/2.0 | 1,393 (-6%) | 15mo | $223,900 | $161 | 44 |
Match score weights: distance 35% · size 25% · config 20% · recency 20%. Top-matched comps best support the ARV.
Projected returns pro-forma
-3.0% appreciation · 0.44% rent growth · sell at horizon
- IRR
- -26.0%
- Equity multiple
- 0.14×
- Total profit
- $-65,875
- Equity at exit
- $40,988
- IRR
- -38.5%
- Equity multiple
- -0.32×
- Total profit
- $-101,890
- Equity at exit
- $23,768
Cash invested: $76,972 (down + closing). Projections, not guarantees.
Landlord ↔ Tenant lean methodology
- Overall (STATE)
- 87 Strongly Landlord-Friendly
- State Texas
- 87 Strongly Landlord-Friendly · R+5
- County
- — inherits STATE
- City
- — inherits STATE
ZIP-level market 77583
- Rents YoY
- 0.4%
- Active inventory
- 1139
- Price-to-rent
- 8.3×
Monthly cashflow live
- Estimated rent
- $2,751 high interval (Pro) →
- Mortgage (P&I)
- −$1,442
- Tax from tax record
- −$751 /mo · $9,012/yr
- Insurance
- −$115
- HOA
- −$98
- Vacancy / Maint / Mgmt
- −$578
- Net cashflow
- $-232
Break-even live
UW: 25.0% down · 7.5% · 30yr · 1.5% tax · 5.0% vac · 8.0% maint · 8.0% mgmt
Financing live
Cash to close
- Down payment
- $68,725
- Closing costs
- $8,247
- Reserves months
- —
- Total cash needed
- —
Loan-product check · same deal, 3 products live
Conventional
25% down · 7.5% · 30yr
- Down + closing
- —
- Monthly P&I
- —
- Monthly cashflow
- —
- DSCR
- —
- Eligible?
- —
Personal DTI + credit; lowest rate.
DSCR
20% down · 8.5% · 30yr
- Down + closing
- —
- Monthly P&I
- —
- Monthly cashflow
- —
- DSCR
- —
- Eligible?
- —
No personal income docs; deal must DSCR.
Hard money
10% down · 12.0% · 12mo
- Down + closing
- —
- Monthly P&I
- —
- Monthly cashflow
- —
- DSCR
- —
- Eligible?
- —
Short-term bridge; refi at stabilization.
Rent comps 13 comps
| Address | Beds | Baths | Sqft | Rent | $/sqft | DOM | Units | Dist |
|---|---|---|---|---|---|---|---|---|
| 10502 Moon Valley Ln Rosharon, TX | 3.0 | 2.0 | 1615 | $2,725 | $1.69 | 1d | 1 | 0.09mi |
| 10507 Moon Valley Ln Rosharon, TX | 3.0 | 2.0 | 1548 | $2,650 | $1.71 | 1d | 1 | 0.11mi |
| 10538 Wildflower View Dr Rosharon, TX | 3.0 | 2.0 | 1522 | $2,775 | $1.82 | 1d | 1 | 0.16mi |
| 10602 Wildflower View Dr Rosharon, TX | 4.0 | 2.0 | 1596 | $2,850 | $1.79 | 20d | 1 | 0.18mi |
| 10610 Cascade Creek Dr Rosharon, TX | 3.0 | 2.0 | 1548 | $2,700 | $1.74 | 43d | 1 | 0.19mi |
| 10622 Cascade Creek Dr Rosharon, TX | 4.0 | 2.0 | 1780 | $2,775 | $1.56 | 43d | 1 | 0.19mi |
| 1234 Scarlet Creek Dr Rosharon, TX | 3.0 | 2.0 | 1548 | $2,650 | $1.71 | 1d | 1 | 0.23mi |
| 10313 Malta Trace Dr Rosharon, TX | 4.0 | 2.0 | 1802 | $2,545 | $1.41 | 43d | 1 | 0.73mi |
| 1816 Corsica Creek Ln Rosharon, TX | 3.0–4.0 | 2.0–2.5 | 1653 | $2,306 | $1.40 | 1d | 21 | 0.84mi |
| 1123 Diamond Drape Dr Rosharon, TX | 4.0 | 2.0 | 1844 | $2,000 | $1.08 | 12d | 1 | 0.95mi |
| 10211 Alpine Lake Ln Rosharon, TX | 3.0–4.0 | 2.0–2.5 | 1731 | $2,700 | $1.56 | 1d | 6 | 1.20mi |
| 10211 Alpine Lake Ln Rosharon, TX | 3.0–4.0 | 2.0–2.5 | 1731 | $2,469 | $1.43 | 43d | 7 | 1.20mi |
| 9518 Peridot Green Dr Rosharon, TX | 4.0 | 2.0 | 1593 | $1,886 | $1.18 | 22d | 1 | 1.45mi |
HOA detail
- Monthly dues
- $98 · $1,176/yr
Listing history 20 events
-
2026-06-17statusdays on market $274,900 Pending 49 DOM
-
2026-06-16days on market $274,900 Active 48 DOM
-
2026-06-15days on market $274,900 Active 47 DOM
-
2026-06-13days on market $274,900 Active 45 DOM
-
2026-06-13days on market $274,900 Active 44 DOM
-
2026-06-09days on market $274,900 Active 41 DOM
-
2026-06-08days on market $274,900 Active 40 DOM
-
2026-06-07days on market $274,900 Active 39 DOM
-
2026-06-04days on market $274,900 Active 36 DOM
-
2026-06-03days on market $274,900 Active 35 DOM
-
2026-06-02days on market $274,900 Active 34 DOM
-
2026-06-01days on market $274,900 Active 33 DOM
-
2026-05-31days on market $274,900 Active 32 DOM
-
2026-04-29$274,900 Active 344-char remark
-
2026-04-29historical
-
2026-03-16price $274,900
-
2026-02-11$279,900 Active
-
2024-11-18soldstatus Sold
Show marketing remark (801 chars)
Welcome to your dream home at the heart of Darlington! Step into luxury with our spacious and meticulously designed 3-bedroom, 2-bath haven. This single-story abode boasts a generous 1,464 square feet of living space, ideal for families and those seeking tranquility in style. Park effortlessly with a 2-car garage, ensuring convenience for all. Entertain or unwind in the expansive great room, offering versatility and comfort for any occasion. Embrace the serene outdoors on your covered patio, measuring 11 x 7, perfect for al fresco dining or peaceful moments. The optional utility room adds practicality, catering to your individual lifestyle needs. Experience the epitome of modern living with this exquisite Darlington floor plan, where luxury meets functionality seamlessly. Your oasis awaits!
-
2024-05-13status Pending
Show marketing remark (801 chars)
Welcome to your dream home at the heart of Darlington! Step into luxury with our spacious and meticulously designed 3-bedroom, 2-bath haven. This single-story abode boasts a generous 1,464 square feet of living space, ideal for families and those seeking tranquility in style. Park effortlessly with a 2-car garage, ensuring convenience for all. Entertain or unwind in the expansive great room, offering versatility and comfort for any occasion. Embrace the serene outdoors on your covered patio, measuring 11 x 7, perfect for al fresco dining or peaceful moments. The optional utility room adds practicality, catering to your individual lifestyle needs. Experience the epitome of modern living with this exquisite Darlington floor plan, where luxury meets functionality seamlessly. Your oasis awaits!
-
2024-04-24$284,990 Active
Show marketing remark (801 chars)
Welcome to your dream home at the heart of Darlington! Step into luxury with our spacious and meticulously designed 3-bedroom, 2-bath haven. This single-story abode boasts a generous 1,464 square feet of living space, ideal for families and those seeking tranquility in style. Park effortlessly with a 2-car garage, ensuring convenience for all. Entertain or unwind in the expansive great room, offering versatility and comfort for any occasion. Embrace the serene outdoors on your covered patio, measuring 11 x 7, perfect for al fresco dining or peaceful moments. The optional utility room adds practicality, catering to your individual lifestyle needs. Experience the epitome of modern living with this exquisite Darlington floor plan, where luxury meets functionality seamlessly. Your oasis awaits!
ⓘ Source: listings_history table (triggers on properties + properties_extension) + one-shot
backfill from property_details.listing_events for pre-trigger history.
Tax reassessment forecast TX · Resets to sale price
- Current annual tax
- $9,012 · $751/mo
- Projected year-2 tax
- $9,012 · $751/mo
- Expected delta
- $0/yr ($0/mo · 0.0%)
ⓘ Screening estimate from a state-policy table — verify with the county assessor before closing.
Climate risk First Street
- Flood 3/10 Moderate FEMA zone X (unshaded) · 20% chance over 30 yrs
- Wildfire 6/10 Major
- Heat 9/10 Extreme 7 d/yr ≥110°F today · 23 d/yr by 30 yrs out
- Wind 9/10 Extreme 99% chance of damaging wind over 30 yrs
- Air quality 2/10 Low 1 unhealthy d/yr today · 2 by 30 yrs out
Nearby sold comps map
Loading sold comps map…
Walkable amenities ~0.75 mi
Loading nearby amenities…
Taxation est. · year 1
- Rental income
- $33,011
- − Mortgage interest
- −$15,399
- − Property taxes
- −$9,012
- − Insurance
- −$1,374
- − Repairs & maintenance
- −$2,641
- − Management
- −$2,641
- − HOA
- −$1,176
- − Depreciation
- −$7,997
- Taxable loss
- −$7,229
- Est. tax savings @ 24.0%
- +$1,735
- After-tax cash flow
- $-1,048/yr
For passive investors: Depreciation is non-cash, so a rental often shows a tax loss while cash-flowing — sheltering income. Rental losses are passive: they offset passive income freely, and up to $25,000/yr can offset ordinary (W-2) income if you actively participate and your MAGI is under $100k (phasing out to $0 by $150k); unused losses carry forward. On sale, claimed depreciation is recaptured at up to 25%, and gains may owe capital-gains tax (a 1031 exchange can defer both). Figures are a year-1 estimate at your 24.0% rate — not tax advice; consult a CPA.
Condition & rehab AI · 12 photos
This single-family home is in good condition with modern updates and a well-maintained exterior. It is ready for a new owner and can be further enhanced with some exterior painting and gutter cleaning to boost its value.
Value-add opportunities
- Both Paint exterior trim — Enhances curb appeal and can increase both resale and rental value.
- Both Clean gutters — Improves drainage and can prevent water damage, increasing both resale and rental value.
Renovation cost estimate screening
Value-add ROI direction
- Both Paint exterior trim — Enhances curb appeal and can increase both resale and rental value. ↑
- Both Clean gutters — Improves drainage and can prevent water damage, increasing both resale and rental value. ↑
ⓘ Cost ranges are severity-bucket heuristics (US national rule-of-thumb). Get contractor quotes + a written scope before underwriting a rehab budget.
Schools (NCES district)
- District
- Alvin ISD
- NCES district ID
- 4808090
- Math proficiency
- 39% ▼ -11.00%
- Reading proficiency
- 48% ▬ 0.00%
- Median HH income
- $66,740
- Composite
- 38.96/100
- National rank
- #4080
- State rank
- #255 of 826 in TX
Livability — Iowa Colony
- Score
- 64/100
- State rank
- #757
- US rank
- #13904
Category grades
Schools grade is shown separately in the Schools card above.
Census & demographics
- County
- Brazoria County · 374,982 people
- City population
- 52,747
- Metro
- Houston-The Woodlands-Sugar Land, TX
- Population (ZIP)
- 52,747
- Household income
- $119,287
- Rent vs Own
- Severe rent burden
- 251.0
Population outlook (Brazoria County) Hauer SSP2
- Today (2025)
- 420,414 people
- By 2030
- 457,585 · +8.8%
- By 2040
- 532,232 · +26.6%
- By 2050
- 605,399 · +44.0%
- By 2075
- 779,358 · +85.4%
- By 2100
- 883,759 · +110.2%
Race, ethnicity, and origin ACS 2023
- Neighborhood character
- Highly diverse neighborhood (Simpson 0.70)
- Race & ethnicity
- Hispanic / Latino 38% Black 34% White 20% Two or more races 18% Asian 5%
- Hispanic origin (detail)
- Mexican 31% Puerto Rican 2%
- Common ancestry
- Lithuanian 1% Slovak 1% Romanian 1%
- Foreign-born
- 16% · Canada, Vietnam, China
- Languages at home
- 64% English-only · Spanish 28% Other Asian/Pacific 2% Vietnamese 1%
Political lean MEDSL · Brazoria
- 2024 margin
- R (+19.7) · D 39.5% · R 59.2% · Other 1.3%
- 2008→2024 swing
- +9.9pp toward D · 2008: -29.6pp · 2024: -19.7pp
- All cycles
- 2024: R+19.7 2020: R+18.2 2016: R+24.6 2012: R+34.2 2008: R+29.6
Not yet ingested
- Civics
- —
Market trends
- HPI YoY
- ▼ -120.19%
- Current HPI
- 198.6559
- Rent YoY
- ▲ 0.44%
- Metro
- Houston-The Woodlands-Sugar Land, TX
- State GDP YoY
- ▲ 3.95%
- F500 in state
- 110
Industry mix (Fortune 500 HQ in TX)
| Industry | F500 HQs | Revenue |
|---|---|---|
| Energy | 16 | $1,198B |
|
||
| Technology | 5 | $198B |
|
||
| Engineering / Construction | 4 | $72B |
|
||
| Energy Services | 3 | $60B |
|
||
| Utilities | 3 | $41B |
|
||
| Healthcare | 2 | $330B |
|
||
Price history
-3.5% since first listed8 events — show timeline
- 2026-06-17 Pending — HARMLS
- 2026-04-29 Listing Removed — HARMLS
- 2026-04-29 Listed $274,900 HARMLS
- 2026-03-16 Price Changed $274,900 HARMLS
- 2026-02-11 Listed $279,900 HARMLS
- 2024-11-18 Sold (MLS) — HARMLS
- 2024-05-13 Pending — HARMLS
- 2024-04-24 Listed $284,990 HARMLS
Property tax history
+91.2%/yrLatest (2025): $9,012 · +367.8% YoY. Source: county tax records.
Cash-flow waterfall
monthlySold comps — $/sqft
last 12 mo · ≤1 miLoading sold comps…