 🌊 Lakefront
137 Horseshoe Dr Dr · Montezuma, IA
Flood risk 1/10 · Minimal
- FEMA flood zone
- X (unshaded)
- Chance of flooding over 30 yrs
- 0.0%
- Est. flood insurance / yr
- $507 – $1,088
Fire risk 3/10 · Minor
- Est. fire insurance / yr
- $902 – $1,676
Heat risk 3/10 · Minor
- Hot days now (above 103°F)
- 7 days/yr
- Hot days in 30 yrs
- 15 days/yr
Wind risk 2/10 · Minimal
- Chance of severe wind over 30 yrs
- —
Air-quality risk 2/10 · Minimal
- Unhealthy air days now
- 1 days/yr
- Unhealthy air days in 30 yrs
- 1 days/yr
Risk factors via First Street. Map © Google.
Why this score? — see what drove the D grade
The composite is a weighted blend of 9 inputs, each scored 0–100. Each bar is that input's sub-score; the figure is the points it added to the 100-point composite (weight × sub-score).
- ARV discount +13.4/15.0
- Appreciation +10.0/10.0
- Schools +6.5/10.0
- Livability +3.8/5.0
- Rent growth +2.5/5.0
- Condition / age +2.5/5.0
- Cash flow +1.4/30.0
- 1% rule +0.0/10.0
- DSCR +0.0/10.0
$320,000
🖨 Deal sheet 📄 Offer letter ✓ Due diligence
Listing remarks
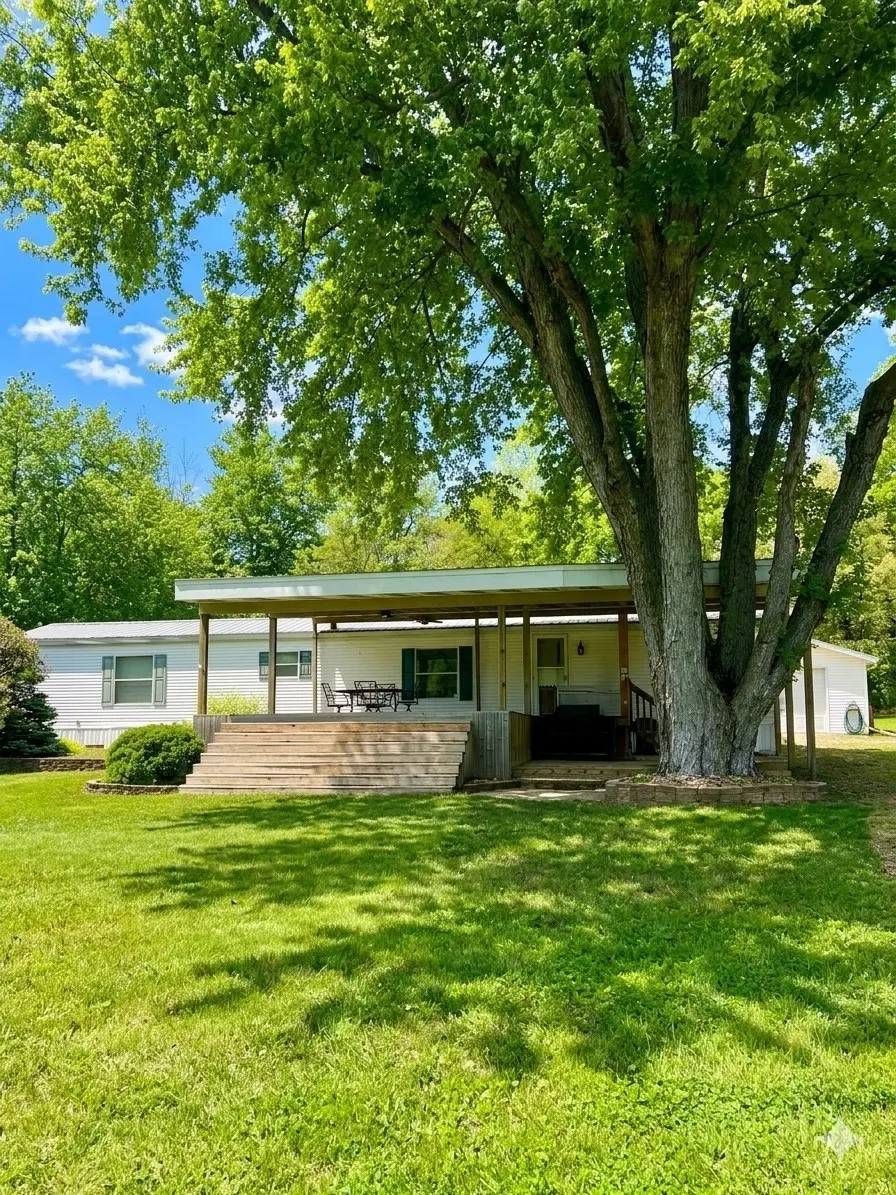
Experience lake living at beautiful Lake Ponderosa with stunning unobstructed water views that feel just like true lakefront property. This turnkey getaway features an open-concept single-wide Manufactured home designed for comfortable lake life and easy entertaining. Enjoy your morning coffee or evening sunsets from the spacious covered front deck overlooking the lake. The home offers 2 bedrooms, 2 bathrooms, a dedicated laundry room, and comes completely furnished — making it ready for immediate enjoyment. A large double garage provides excellent storage for your vehicle, side-by-side, golf cart, and all your lake toys. An RV hookup at the rear of the property adds even more conveni
Key facts
- Open-concept home
- Turnkey getaway
- Completely furnished
Tags
Property features AI
Finance
- Other: Listed by Realty87
Exterior
- Parking: Detached garage; 2 garage spaces; Garage door opener; Guest parking available
- Utilities: Public water; Septic tank sewer
- Home design: Single-family residence; Residential property
- Construction: Metal siding; See remarks for additional construction details; 952 above-grade finished area
- Exterior features: Deck; Waterfront lot; Pets allowed
Interior
- Kitchen: Dishwasher; Microwave; Range; Refrigerator; Electric water heater
- Bathrooms: 2 full bathrooms
- Heating & cooling: Natural gas forced-air heating; Central air conditioning
- Interior features: Includes dishwasher, microwave, range, refrigerator, electric water heater
- Laundry & utility: Washer and dryer included
Neighborhood map
What this means for you Summary
Snapshot
- This is a 2-bed/2.5-bath manufactured listed at $320k.
Deal economics
- At list price, monthly cash flow is $-1k ($-15k/yr) — negative.
- To cash-flow at today's rent, offer at most $97k (69.7% below list).
- To meet the 1% rule (rent ≥ 1% of price), the offer needs to be $89k (72.2% below list).
- Recommended offer: $89k (72.2% below list) — sets the bar for 1% rule.
Location & tenants
- Location reads 75/100 on livability (#228 in IA, #4,319 nationally) — a middle-class / working-renter tenant base. Strengths: crime A+, cost of living A+, housing A+; Watch: amenities F, commute F, employment F.
- Montezuma Community School District (rural): math 73% / reading 79% proficiency, ranked #55 of 289 in IA (top 19%) — strong family-tenant draw, lease renewals of 3-5y typical.
- Zoned schools: Montezuma Elementary School (math 92% / reading 77%, grade A+, #31 of 616 statewide, top 6%, 229 students, 34% FRL); Montezuma Junior High School (math 62% / reading 72%, grade A-, #140 of 246 statewide, top 60%, 112 students, 39% FRL); Montezuma High School (math 67% / reading 87%, grade A-, #60 of 336 statewide, top 21%, 148 students, 28% FRL).
- Market conditions: 66 active listings in the ZIP; 27 units permitted in Poweshiek County in 2024 (0 in 5+ unit buildings).
Forward outlook
- In year one you build about $34k of equity ($2k loan paydown + $32k appreciation (10.0% local appreciation)).
- Poweshiek County population projected to shrink 3% by 2050 — rents likely to lag national; underwrite the cash flow, not the appreciation.
- By year 2, paydown + projected appreciation supports a ~$55k cash-out refi (75% LTV) — recoverable capital for the next deal without selling this one.
Negotiation context
- It's been on market 35 days — a 3% lower offer ($310k) is reasonable based on typical stale-listing flexibility.
- Current owner paid $70k; list at $320k implies a 357% gain — meaningful room to come down on a strong offer.
Questions for the listing agent
- What do current leases actually rent for vs. the listed asking? Can we see a recent rent roll and the last 12 months of T-12 income?
- It's been on market 35 days. Have you received any prior offers? Is the seller open to a 72% concession, seller financing, or rate buy-down credit?
- Is there a deadline driving the sale (1031 exchange, divorce, estate, relocation)? That informs how much negotiation room exists.
- Schools are A-rated — typically a magnet for longer-tenancy family renters. What's the average tenant stay here, and is there a school-zone premium baked into asking?
- The area grade is low — what's the realistic commute time and amenity access for the typical tenant pool here? Any planned neighborhood developments (good or bad) we should know about?
- This sits on a lake — are riparian / water-frontage rights deeded with the parcel? Any dock permits, shoreline easements, or HOA water-use restrictions?
- What's the documented flood / surge / shoreline-erosion history here (FEMA AND non-FEMA — e.g., storm surge, creek backup, septic-field saturation)?
- Any water-quality or seasonal algae-bloom issues that affect tenant satisfaction or short-term-rental demand?
- What's the average days-on-market for RENTAL listings here right now (not sales)? A rising rental-DOM trend means longer vacancies and softer asking-rent achievability than the comps imply.
- What's the recent tenant-quality profile in this submarket — average credit score on applications, eviction rate, late-payment / NSF rate, and stable-employment percentage? A property-management company in the area should have these aggregated.
- How much new for-sale + rental construction is in the pipeline within 1–3 miles? Heavy new supply typically softens prices + rents 12–24 months out; constrained supply supports both.
Investment metrics
- 1% rule
- 0.28% ✗
- Cap rate
- 1.56%
- Cash-on-cash
- -16.92%
- DSCR
- 0.25
- GRM
- 30.0
CMA / ARV
- ARV (median comp)
- $368,737
- List price
- $320,000
- Delta
- -13.22%
- Verdict
- UNDERPRICED
- Comps
- 14 within 1.0 mi
Projected returns pro-forma
10.0% appreciation · 3.0% rent growth · sell at horizon
- IRR
- 12.6%
- Equity multiple
- 2.05×
- Total profit
- $93,696
- Equity at exit
- $288,281
- IRR
- 13.0%
- Equity multiple
- 4.78×
- Total profit
- $338,909
- Equity at exit
- $621,690
Cash invested: $89,600 (down + closing). Projections, not guarantees.
Landlord ↔ Tenant lean methodology
- Overall (STATE)
- 83 Strongly Landlord-Friendly
- State Iowa
- 83 Strongly Landlord-Friendly · R+6
- County
- — inherits STATE
- City
- — inherits STATE
ZIP-level market 50171
- Home prices YoY
- 9.3%
- Active inventory
- 66
- Price-to-rent
- 30.0×
Monthly cashflow live
- Estimated rent
- $889 medium interval (Pro) →
- Mortgage (P&I)
- −$1,678
- Tax from tax record
- −$154 /mo · $1,850/yr
- Insurance
- −$133
- HOA
- −$0
- Vacancy / Maint / Mgmt
- −$187
- Net cashflow
- $-1,263
Break-even live
UW: 25.0% down · 7.5% · 30yr · 1.5% tax · 5.0% vac · 8.0% maint · 8.0% mgmt
Financing live
Cash to close
- Down payment
- $80,000
- Closing costs
- $9,600
- Reserves months
- —
- Total cash needed
- —
Loan-product check · same deal, 3 products live
Conventional
25% down · 7.5% · 30yr
- Down + closing
- —
- Monthly P&I
- —
- Monthly cashflow
- —
- DSCR
- —
- Eligible?
- —
Personal DTI + credit; lowest rate.
DSCR
20% down · 8.5% · 30yr
- Down + closing
- —
- Monthly P&I
- —
- Monthly cashflow
- —
- DSCR
- —
- Eligible?
- —
No personal income docs; deal must DSCR.
Hard money
10% down · 12.0% · 12mo
- Down + closing
- —
- Monthly P&I
- —
- Monthly cashflow
- —
- DSCR
- —
- Eligible?
- —
Short-term bridge; refi at stabilization.
Listing history 17 events
-
2026-06-18days on market $320,000 Active 35 DOM
-
2026-06-17days on market $320,000 Active 34 DOM
-
2026-06-16days on market $320,000 Active 33 DOM
-
2026-06-15days on market $320,000 Active 32 DOM
-
2026-06-13days on market $320,000 Active 30 DOM
-
2026-06-12days on market $320,000 Active 29 DOM
-
2026-06-09days on market $320,000 Active 26 DOM
-
2026-06-08days on market $320,000 Active 25 DOM
-
2026-06-07days on market $320,000 Active 24 DOM
-
2026-06-05days on market $320,000 Active 22 DOM
-
2026-06-04days on market $320,000 Active 20 DOM
-
2026-06-02days on market $320,000 Active 19 DOM
-
2026-06-01days on market $320,000 Active 18 DOM
-
2026-05-31days on market $320,000 Active 17 DOM
-
2026-05-31days on market $320,000 Active 16 DOM
-
2026-05-14$320,000 Active 1103-char remark
-
2008-06-16soldstatus $70,000
ⓘ Source: listings_history table (triggers on properties + properties_extension) + one-shot
backfill from property_details.listing_events for pre-trigger history.
Tax reassessment forecast IA · Partial reset (capped growth)
- Current annual tax
- $1,850 · $154/mo
- Projected year-2 tax
- $3,437 · $286/mo
- Expected delta
- +$1,587/yr (+$132/mo · 85.8%)
ⓘ Screening estimate from a state-policy table — verify with the county assessor before closing.
Climate risk First Street
- Flood 1/10 Low FEMA zone X (unshaded) · 0% chance over 30 yrs
- Wildfire 3/10 Moderate
- Heat 3/10 Moderate 7 d/yr ≥103°F today · 15 d/yr by 30 yrs out
- Wind 2/10 Low
- Air quality 2/10 Low 1 unhealthy d/yr today · 1 by 30 yrs out
Nearby sold comps map
Loading sold comps map…
Walkable amenities ~0.75 mi
Loading nearby amenities…
Taxation est. · year 1
- Rental income
- $10,671
- − Mortgage interest
- −$17,925
- − Property taxes
- −$1,850
- − Insurance
- −$1,600
- − Repairs & maintenance
- −$854
- − Management
- −$854
- − Depreciation
- −$9,309
- Taxable loss
- −$21,720
- Est. tax savings @ 24.0%
- +$5,213
- After-tax cash flow
- $-9,944/yr
For passive investors: Depreciation is non-cash, so a rental often shows a tax loss while cash-flowing — sheltering income. Rental losses are passive: they offset passive income freely, and up to $25,000/yr can offset ordinary (W-2) income if you actively participate and your MAGI is under $100k (phasing out to $0 by $150k); unused losses carry forward. On sale, claimed depreciation is recaptured at up to 25%, and gains may owe capital-gains tax (a 1031 exchange can defer both). Figures are a year-1 estimate at your 24.0% rate — not tax advice; consult a CPA.
Schools (NCES district)
- District
- Montezuma Community School District
- NCES district ID
- 1919590
- Math proficiency
- 73% ▼ -6.00%
- Reading proficiency
- 79% ▲ 3.00%
- Median HH income
- $57,449
- Composite
- 65.04/100
- National rank
- #503
- State rank
- #55 of 289 in IA
Livability — Montezuma
- Score
- 75/100
- State rank
- #228
- US rank
- #4319
Category grades
Schools grade is shown separately in the Schools card above.
Census & demographics
- City population
- 2,445
- Population (ZIP)
- 2,445
Population outlook (Poweshiek County) Hauer SSP2
- Today (2025)
- 18,601 people
- By 2030
- 18,342 · -1.4%
- By 2040
- 17,944 · -3.5%
- By 2050
- 18,029 · -3.1%
- By 2075
- 19,945 · +7.2%
- By 2100
- 22,637 · +21.7%
Race, ethnicity, and origin ACS 2023
- Neighborhood character
- Predominantly White (93%)
- Race & ethnicity
- White 93% Two or more races 5% Hispanic / Latino 3%
- Common ancestry
- Iranian 5% Portuguese 5% Lithuanian 3%
- Foreign-born
- 1% · Canada, Jamaica
- Languages at home
- 98% English-only · Spanish 2%
Political lean MEDSL · Poweshiek
- 2024 margin
- R (+17.0) · D 40.8% · R 57.8% · Other 1.5%
- 2008→2024 swing
- -28.7pp toward R · 2008: 11.8pp · 2024: -17.0pp
- All cycles
- 2024: R+17.0 2020: R+13.3 2016: R+6.8 2012: D+9.1 2008: D+11.8
Not yet ingested
- Civics
- —
Market trends
- HPI YoY
- ▲ 30.91%
- Current HPI
- 364.6554
- Rent YoY
- —
- Metro
- —
- State GDP YoY
- ▲ 2.48%
- F500 in state
- 4
Industry mix (Fortune 500 HQ in IA)
| Industry | F500 HQs | Revenue |
|---|---|---|
| Financial Services | 1 | $16B |
|
||
| Retail / Convenience | 1 | $15B |
|
||
Price history
+357.1% since first listed2 events — show timeline
- 2026-05-14 Listed $320,000 CRAAR, CDRMLS
- 2008-06-16 Sold (Public Records) $70,000 Public Records
Property tax history
+6.0%/yrLatest (2025): $1,850 · -3.5% YoY. Source: county tax records.
Cash-flow waterfall
monthlySold comps — $/sqft
last 12 mo · ≤1 miLoading sold comps…