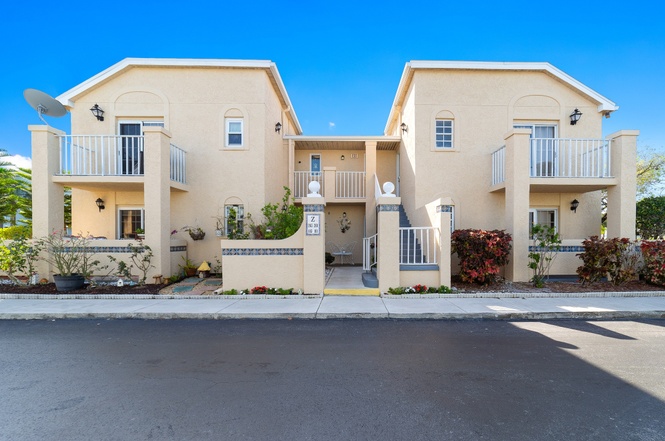
1627 SE Green Acres Cir Unit Z203 · Port St. Lucie, FL
Flood risk 1/10 · Minimal
- FEMA flood zone
- X (unshaded)
- Chance of flooding over 30 yrs
- 0.0%
- Est. flood insurance / yr
- $507 – $1,088
Fire risk 3/10 · Minor
- Est. fire insurance / yr
- $947 – $1,759
Heat risk 10/10 · Severe
- Hot days now (above 106°F)
- 7 days/yr
- Hot days in 30 yrs
- 25 days/yr
Wind risk 10/10 · Severe
- Chance of severe wind over 30 yrs
- 99.0%
Air-quality risk 2/10 · Minimal
- Unhealthy air days now
- 1 days/yr
- Unhealthy air days in 30 yrs
- 1 days/yr
Risk factors via First Street. Map © Google.
Why this score? — see what drove the D grade
The composite is a weighted blend of 9 inputs, each scored 0–100. Each bar is that input's sub-score; the figure is the points it added to the 100-point composite (weight × sub-score).
- Cash flow +11.3/30.0
- ARV discount +7.5/15.0
- 1% rule +6.7/10.0
- Schools +3.7/10.0
- DSCR +3.3/10.0
- Rent growth +3.0/5.0
- Livability +2.5/5.0
- Condition / age +2.5/5.0
- Appreciation +0.0/10.0
$162,000
🖨 Deal sheet 📄 Offer letter ✓ Due diligence
Listing remarks
Don't miss this opportunity to own a charming, light-filled coastal second-floor condo. This two-bedroom, two-bath residence features vaulted ceilings, creating an open and spacious feel. The updated kitchen offers white shaker-style cabinetry, Corian countertops, a glass tile backsplash, and stainless-steel appliances, including a Bosch dishwasher. Tile flooring runs throughout the unit. The guest bedroom features a private balcony, while the main bath includes a tub/shower combination. Two sets of French-door sliders open from the living room and primary bedroom to a screened-in porch featuring roll down shades, perfect for enjoying the coastal breeze. Take the next step and make your off
Key facts
- Screened-in porch
- Private balcony
- Updated kitchen
Tags
Property features AI
Finance
- Financial info: Pets allowed with breed restrictions
- HOA & community: Community clubhouse and pool; Street lights; HOA fee paid monthly; HOA covers insurance, grounds maintenance, pest control, sewer, trash, water, common areas, common real estate tax, and recreation facility
Exterior
- Parking: Assigned parking; Guest parking
- Utilities: Public water; Public sewer; Three-phase electric; Cable available
- Home design: Condominium; Multi/split levels; Entry-level living area; Faces north
- Construction: Block construction; Composition/shingle roof; 2 total stories
- Exterior features: Paved road access; Not waterfront
Interior
- Kitchen: Dishwasher; Electric range; Microwave; Refrigerator
- Bedrooms: 2 bedrooms on the main level
- Bathrooms: 2 full bathrooms on the main level
- Interior features: Cathedral and vaulted ceilings; Walk-in closet(s); Split bedroom layout; Blinds, drapes, and sliding windows
- Laundry & utility: Laundry inside with washer hookup; Unfurnished
Neighborhood map
What this means for you Summary
Snapshot
- This is a 2-bed/2.0-bath condo listed at $162k.
Deal economics
- At list price, monthly cash flow is $-59 ($-704/yr) — negative.
- To cash-flow at today's rent, offer at most $154k (5.2% below list).
- Meets the 1% rule at list price ($2k rent vs $162k).
- Recommended offer: $143k (12.0% below list) — sets the bar for market timing.
- Cap rate 5.9% vs local median 3.9% in Port St. Lucie — top-decile yield for the area; either an underpriced asset or a hidden risk that comps aren't pricing in. Stress-test before assuming the spread holds.
Location & tenants
- Location reads: area grade D — affects rentability + tenant quality, not the cash-flow math above.
- St. Lucie (urban): math 40% / reading 48% proficiency, ranked #51 of 73 in FL (top 70%) — families likely to look elsewhere, expect single-tenant / working-renter base with shorter leases.
- Zoned schools: Savanna Ridge Elementary School (math 40% / reading 45%, grade F, #1,383 of 2,144 statewide, top 65%, 452 students, 75% FRL); Port St. Lucie High School (math 21% / reading 43%, grade F, #415 of 667 statewide, top 63%, 1,748 students, 67% FRL).
- Market conditions: Rents rising (+1.9%/yr); 639 active listings in the ZIP; 24 comparable units currently listed for rent nearby; rentals at typical pace (median 14d on market — plan ~3-4 weeks tenant-placement turnaround); 4,868 units permitted in St. Lucie County in 2024 (268 in 5+ unit buildings).
- This rent runs 37% of the median local income ($62k/yr) — at the standard rent-burdened threshold; future hikes will face affordability resistance.
Forward outlook
- Local home prices are declining (-3.0%/yr); year-one equity from $1k of loan paydown is wiped out by about $5k of value loss. Plan a longer hold.
- St. Lucie County population projected at +20% by 2050 — long-run rental-demand tailwind backs the buy-and-hold thesis.
Negotiation context
- It's been on market 126 days — a 12% lower offer ($143k) is reasonable based on typical stale-listing flexibility.
- 5 sale attempts since 19y ago; this cycle's ask has dropped $17k (9%) from the opening price — seller is motivated, your offer sets the floor, not the list.
- Current owner paid $116k; 40% above their basis — modest negotiation headroom, anchor on the comps not their cost.
Risks & watch-outs
- Watch-outs: HOA is 23% of rent.
- Climate carrying-cost: severe wind risk, 99% chance of damaging wind over 30y; extreme-heat days projected 7→25/yr by 2055 (HVAC capex compounding) — expect insurance premiums to compound above CPI over the hold.
Questions for the listing agent
- What do current leases actually rent for vs. the listed asking? Can we see a recent rent roll and the last 12 months of T-12 income?
- It's been on market 126 days. Have you received any prior offers? Is the seller open to a 12% concession, seller financing, or rate buy-down credit?
- What does the HOA fee cover, when was the last increase, and are there any pending special assessments or reserve-fund shortfalls?
- Any open or pending special assessments — roof, HVAC, plumbing, elevator, façade? What's the per-unit balance and payoff schedule, and is the seller paying it off at close or rolling it to the buyer?
- Why hasn't it sold? Are there any deal-killer items the seller is aware of (foundation, flood, title, zoning, code violations)?
- Is there a deadline driving the sale (1031 exchange, divorce, estate, relocation)? That informs how much negotiation room exists.
- The area grade is low — what's the realistic commute time and amenity access for the typical tenant pool here? Any planned neighborhood developments (good or bad) we should know about?
- What's the average days-on-market for RENTAL listings here right now (not sales)? A rising rental-DOM trend means longer vacancies and softer asking-rent achievability than the comps imply.
- What's the recent tenant-quality profile in this submarket — average credit score on applications, eviction rate, late-payment / NSF rate, and stable-employment percentage? A property-management company in the area should have these aggregated.
- How much new apartment / multifamily construction is in the pipeline within 1–3 miles? Heavy new supply (>2% of stock underway) typically softens rents 12–24 months out; light construction supports rent growth.
Investment metrics
- 1% rule
- 1.17% ✓
- Cap rate
- 5.86%
- Cash-on-cash
- -1.55%
- DSCR
- 0.93
- GRM
- 7.1
CMA / ARV
No comps found within radius.
Projected returns pro-forma
-3.0% appreciation · 1.92% rent growth · sell at horizon
- IRR
- -20.3%
- Equity multiple
- 0.30×
- Total profit
- $-31,730
- Equity at exit
- $24,155
- IRR
- -16.6%
- Equity multiple
- 0.13×
- Total profit
- $-39,418
- Equity at exit
- $14,007
Cash invested: $45,360 (down + closing). Projections, not guarantees.
Landlord ↔ Tenant lean methodology
- Overall (STATE)
- 87 Strongly Landlord-Friendly
- State Florida
- 87 Strongly Landlord-Friendly · R+3
- County
- — inherits STATE
- City
- — inherits STATE
ZIP-level market 34952
- Home prices YoY
- -29.6%
- Rents YoY
- 1.9%
- Active inventory
- 639
- Price-to-rent
- 7.1×
Monthly cashflow live
- Estimated rent
- $1,895 high interval (Pro) →
- Mortgage (P&I)
- −$850
- Tax est. 1.5%
- −$202 /mo · $2,430/yr
- Insurance
- −$68
- HOA
- −$436
- Vacancy / Maint / Mgmt
- −$398
- Net cashflow
- $-59
Break-even live
UW: 25.0% down · 7.5% · 30yr · 1.5% tax · 5.0% vac · 8.0% maint · 8.0% mgmt
Financing live
Cash to close
- Down payment
- $40,500
- Closing costs
- $4,860
- Reserves months
- —
- Total cash needed
- —
Loan-product check · same deal, 3 products live
Conventional
25% down · 7.5% · 30yr
- Down + closing
- —
- Monthly P&I
- —
- Monthly cashflow
- —
- DSCR
- —
- Eligible?
- —
Personal DTI + credit; lowest rate.
DSCR
20% down · 8.5% · 30yr
- Down + closing
- —
- Monthly P&I
- —
- Monthly cashflow
- —
- DSCR
- —
- Eligible?
- —
No personal income docs; deal must DSCR.
Hard money
10% down · 12.0% · 12mo
- Down + closing
- —
- Monthly P&I
- —
- Monthly cashflow
- —
- DSCR
- —
- Eligible?
- —
Short-term bridge; refi at stabilization.
Rent comps 24 comps
| Address | Beds | Baths | Sqft | Rent | $/sqft | DOM | Units | Dist |
|---|---|---|---|---|---|---|---|---|
| 1516 SE Royal Green Cir #202 Port St Lucie, FL | 3.0 | 2.0 | 921 | $2,100 | $2.28 | 23d | 1 | 0.12mi |
| 1520 SE Royal Green Cir Unit K-203 Port St. Lucie, FL | 2.0 | 2.0 | 886 | $1,800 | $2.03 | 23d | 1 | 0.12mi |
| 1524 SE Royal Green Cir Unit Q102 Port St. Lucie, FL | 2.0 | 2.0 | 865 | $1,800 | $2.08 | 14d | 1 | 0.13mi |
| 1550 SE Royal Green Cir Port St. Lucie, FL | 2.0 | 2.0 | 782 | $1,850 | $2.37 | 14d | 1 | 0.14mi |
| 1562 SE Royal Green Cir Unit T-204 Port St. Lucie, FL | 2.0 | 2.0 | 782 | $1,900 | $2.43 | 23d | 1 | 0.14mi |
| 1536 SE Royal Green Cir #101 Port St Lucie, FL | 2.0 | 2.0 | 782 | $1,750 | $2.24 | 23d | 1 | 0.18mi |
| 1537 SE Royal Green Cir Unit E204 Port St. Lucie, FL | 2.0 | 2.0 | 886 | $1,750 | $1.98 | 14d | 1 | 0.20mi |
| 1565 SE Royal Green Cir #108 Port St Lucie, FL | 1.0 | 1.0 | 705 | $1,595 | $2.26 | 14d | 1 | 0.24mi |
| 1503 SE Royal Green Cir Unit V104 Port St. Lucie, FL | 2.0 | 2.0 | 865 | $1,750 | $2.02 | 23d | 1 | 0.24mi |
| 1550 SE Royal Green Cir Unit P-203 Port St. Lucie, FL | 2.0 | 2.0 | 782 | $1,750 | $2.24 | 23d | 1 | 0.27mi |
| 1548 SE Royal Green Cir Unit M-103 Port St. Lucie, FL | 2.0 | 2.0 | 886 | $1,800 | $2.03 | 23d | 1 | 0.28mi |
| 1548 SE Royal Green Cir #108 Port St Lucie, FL | 1.0 | 1.0 | 705 | $1,650 | $2.34 | 14d | 1 | 0.28mi |
| 1566 SE Royal Green Cir #203 Port St Lucie, FL | 2.0 | 2.0 | 782 | $2,000 | $2.56 | 14d | 1 | 0.28mi |
| 1455 SE Colchester Cir Port Saint Lucie, FL | 2.0 | 2.0 | 921 | $1,795 | $1.95 | 14d | 1 | 0.32mi |
| 1456 SE Rivergreen Cir Port Saint Lucie, FL | 2.0 | 2.0 | 921 | $1,825 | $1.98 | 14d | 1 | 0.53mi |
| 1350 SE La Haven Ct Port Saint Lucie, FL | 2.0 | 2.0 | 1041 | $2,100 | $2.02 | 23d | 1 | 0.56mi |
| 9905 S US Highway 1 Port Saint Lucie, FL | 1.0–2.0 | 1.0–2.0 | 966 | $2,239 | $2.32 | 14d | 15 | 0.56mi |
| 1810 SE Pinewood Trl Port Saint Lucie, FL | 1.0–2.0 | 1.0–2.0 | 1013 | $2,055 | $2.03 | 14d | 7 | 0.63mi |
| 1811 SE Walton Lakes Dr Port Saint Lucie, FL | 2.0 | 1.0–2.0 | 1117 | $1,926 | $1.72 | 14d | 6 | 0.73mi |
| 1500 SE Tiffany Club Pl Port Saint Lucie, FL | 1.0–3.0 | 1.0–2.0 | 895 | $1,922 | $2.15 | 14d | 7 | 0.82mi |
| 2051 SE Hillmoor Dr Port Saint Lucie, FL | 1.0–2.0 | 1.0–2.0 | 1014 | $2,539 | $2.50 | 23d | 15 | 0.94mi |
| 1131 SE Parrish Ct Port Saint Lucie, FL | 2.0 | 1.0 | 902 | $2,000 | $2.22 | 23d | 1 | 1.21mi |
| 991 SE Walters Ter Port Saint Lucie, FL | 2.0 | 2.0 | 1040 | $8,500 | $8.17 | 23d | 1 | 1.36mi |
| 1900 Bella Vista Way Port Saint Lucie, FL | 1.0–2.0 | 1.0–2.0 | 995 | $1,764 | $1.77 | 14d | 15 | 1.42mi |
HOA detail condo
- Monthly dues
- $436 · $5,232/yr
- Assessments
- None detected in remarks — confirm with the listing agent.
Listing history 34 events
-
2026-06-18days on market $162,000 Active 126 DOM
-
2026-06-17days on market $162,000 Active 125 DOM
-
2026-06-16days on market $162,000 Active 124 DOM
-
2026-06-15days on market $162,000 Active 123 DOM
-
2026-06-14days on market $162,000 Active 121 DOM
-
2026-06-13days on market $162,000 Active 120 DOM
-
2026-06-10days on market $162,000 Active 118 DOM
-
2026-06-09days on market $162,000 Active 117 DOM
-
2026-06-08days on market $162,000 Active 116 DOM
-
2026-06-07days on market $162,000 Active 115 DOM
-
2026-06-05days on market $162,000 Active 112 DOM
-
2026-06-03days on market $162,000 Active 111 DOM
-
2026-06-02days on market $162,000 Active 110 DOM
-
2026-06-01days on market $162,000 Active 109 DOM
-
2026-05-31days on market $162,000 Active 108 DOM
-
2026-05-30days on market $162,000 Active 107 DOM
-
2026-03-16price $168,500
-
2026-02-12$179,000 Active
-
2025-11-03historical
-
2025-09-16price $183,000
-
2025-05-02$192,000 Active
-
2019-07-22soldstatus $116,000
-
2017-03-17soldstatus $80,000
-
2014-10-07historical
-
2013-05-09soldstatus $39,900
-
2013-05-09soldstatus $39,900
-
2013-04-10historical
-
2012-10-08$39,900
-
2008-05-20$99,500
-
2007-10-17historical
-
2007-09-04$145,000
-
2005-04-19soldstatus $125,000
-
2002-08-26soldstatus $58,200
-
1987-07-01soldstatus $72,500
ⓘ Source: listings_history table (triggers on properties + properties_extension) + one-shot
backfill from property_details.listing_events for pre-trigger history.
Climate risk First Street
- Flood 1/10 Low FEMA zone X (unshaded) · 0% chance over 30 yrs
- Wildfire 3/10 Moderate
- Heat 10/10 Extreme 7 d/yr ≥106°F today · 25 d/yr by 30 yrs out
- Wind 10/10 Extreme 99% chance of damaging wind over 30 yrs
- Air quality 2/10 Low 1 unhealthy d/yr today · 1 by 30 yrs out
Nearby sold comps map
Loading sold comps map…
Walkable amenities ~0.75 mi
Loading nearby amenities…
Taxation est. · year 1
- Rental income
- $22,737
- − Mortgage interest
- −$9,075
- − Property taxes
- −$2,430
- − Insurance
- −$810
- − Repairs & maintenance
- −$1,819
- − Management
- −$1,819
- − HOA
- −$5,232
- − Depreciation
- −$4,713
- Taxable loss
- −$3,160
- Est. tax savings @ 24.0%
- +$758
- After-tax cash flow
- $54/yr
For passive investors: Depreciation is non-cash, so a rental often shows a tax loss while cash-flowing — sheltering income. Rental losses are passive: they offset passive income freely, and up to $25,000/yr can offset ordinary (W-2) income if you actively participate and your MAGI is under $100k (phasing out to $0 by $150k); unused losses carry forward. On sale, claimed depreciation is recaptured at up to 25%, and gains may owe capital-gains tax (a 1031 exchange can defer both). Figures are a year-1 estimate at your 24.0% rate — not tax advice; consult a CPA.
Schools (NCES district)
- District
- St. Lucie
- NCES district ID
- 1201770
- Math proficiency
- 40% ▼ -11.00%
- Reading proficiency
- 48% ▼ -4.00%
- Median HH income
- $44,737
- Composite
- 37.28/100
- National rank
- #4449
- State rank
- #51 of 73 in FL
Livability — Port St. Lucie
No livability data for this city. (Only ~50 U.S. cities are tracked.)
Census & demographics
- Census place
- Port St. Lucie, FL
- County
- Saint Lucie County · 337,150 people
- City population
- 221,051
- Metro
- Port St. Lucie, FL
- Population (ZIP)
- 42,655
- Household income
- $61,628
- Rent vs Own
- Severe rent burden
- 1759.0
Population outlook (St. Lucie County) Hauer SSP2
- Today (2025)
- 338,016 people
- By 2030
- 355,687 · +5.2%
- By 2040
- 385,521 · +14.1%
- By 2050
- 406,106 · +20.1%
- By 2075
- 441,054 · +30.5%
- By 2100
- 436,885 · +29.2%
Race, ethnicity, and origin ACS 2023
- Neighborhood character
- Diverse neighborhood (Simpson 0.57)
- Race & ethnicity
- White 62% Hispanic / Latino 19% Two or more races 14% Black 10% Asian 3%
- Hispanic origin (detail)
- Mexican 4% Puerto Rican 4% Cuban 2% Dominican 2%
- Common ancestry
- Romanian 3% Lithuanian 2% Hispanic 1%
- Foreign-born
- 18% · Canada, Jamaica, China
- Languages at home
- 76% English-only · Spanish 16% French/Haitian/Cajun 3% Tagalog/Filipino 2%
Political lean MEDSL · St. Lucie
- 2024 margin
- Lean R (+9.1) · D 45.1% · R 54.2%
- 2008→2024 swing
- -21.2pp toward R · 2008: 12.1pp · 2024: -9.1pp
- All cycles
- 2024: R+9.1 2020: R+1.6 2016: R+2.5 2012: D+7.9 2008: D+12.1
Not yet ingested
- Civics
- —
Market trends
- HPI YoY
- ▼ -155.80%
- Current HPI
- 371.0573
- Rent YoY
- ▲ 1.92%
- Metro
- Port St. Lucie, FL
- State GDP YoY
- ▲ 3.28%
- F500 in state
- 36
Industry mix (Fortune 500 HQ in FL)
| Industry | F500 HQs | Revenue |
|---|---|---|
| Industrial Technology | 2 | $29B |
|
||
| Insurance | 2 | $17B |
|
||
| Retail | 1 | $60B |
|
||
| Technology Distribution | 1 | $58B |
|
||
| Homebuilding | 1 | $35B |
|
||
| Technology Manufacturing | 1 | $35B |
|
||
Price history
+132.4% since first listed18 events — show timeline
- 2026-03-16 Price Changed $168,500 Beaches MLS
- 2026-02-12 Listed $179,000 Beaches MLS
- 2025-11-03 Listing Removed — Beaches MLS
- 2025-09-16 Price Changed $183,000 Beaches MLS
- 2025-05-02 Listed $192,000 Beaches MLS
- 2019-07-22 Sold (Public Records) $116,000 Public Records
- 2017-03-17 Sold (Public Records) $80,000 Public Records
- 2014-10-07 Listing Removed — Beaches MLS
- 2013-05-09 Sold (Public Records) $39,900 Public Records
- 2013-05-09 Sold (MLS) $39,900 Beaches MLS
- 2013-04-10 Listing Removed — Beaches MLS
- 2012-10-08 Listed $39,900 Beaches MLS
- 2008-05-20 Listed $99,500 Beaches MLS
- 2007-10-17 Listing Removed — Beaches MLS
- 2007-09-04 Listed $145,000 Beaches MLS
- 2005-04-19 Sold (Public Records) $125,000 Public Records
- 2002-08-26 Sold (Public Records) $58,200 Public Records
- 1987-07-01 Sold (Public Records) $72,500 Public Records
Property tax history
-15.5%/yrLatest (2025): $189 · +3.3% YoY. Source: county tax records.
Cash-flow waterfall
monthlySold comps — $/sqft
last 12 mo · ≤1 miLoading sold comps…